The âIJSâ system uses statistical data compression models for email classification. Such models can be used .... The reason for this step was to undo line breaks added to messages by email clients. The newline ... 1http://trec.nist.gov/pubs.html.
Spam Filtering using Character-level Markov Models: Experiments for the TREC 2005 Spam Track Andrej Bratko1,2 and Bogdan Filipiˇc1 {andrej.bratko,bogdan.filipic}@ijs.si 1 Department
of Intelligent Systems Jozef Stefan Institute Jamova 39, Ljubljana, Slovenia SI-1000
2 Klika,
informacijske tehnologije, d.o.o. Stegne 21c, Ljubljana, Slovenia SI-1000
Abstract This paper summarizes our participation in the TREC 2005 spam track, in which we consider the use of adaptive statistical data compression models for the spam filtering task. The nature of these models allows them to be employed as Bayesian text classifiers based on character sequences. We experimented with two different compression algorithms under varying model parameters. All four filters that we submitted exhibited strong performance in the official evaluation, indicating that data compression models are well suited to the spam filtering problem.
1
Introduction
The Text REtrieval Conference (TREC) is an annual event devised to encourage and support research within the information retrieval community by providing the infrastructure necessary for large-scale evaluation of text retrieval methodologies. In 2005, the set of tracks included in TREC was expanded with the addition of a new track on spam filtering. The goal of the spam track is to provide a standard evaluation of current and proposed spam filtering approaches. To this end, a methodology for filter evaluation and a software toolkit that implements this methodology were developed. As a testbed for the comparison, a collection of evaluation corpora, both public and private, was also compiled by the organizers of the track. This paper describes the system submitted to the spam track by the Department of Intelligent Systems at the Jozef Stefan Institute in Slovenia (“Institut Joˇzef Stefan” - IJS). The primary goal of our participation was to evaluate a character-based approach to spam filtering, as opposed to common word-based methods. Specifically, we consider the use of adaptive statistical data compression models for the spam filtering task. The nature of these models allows them to be employed as Bayesian text classifiers based on character sequences (Frank et al., 2000). We compare the filtering performance of the Prediction by Partial Matching (PPM) (Cleary
and Witten, 1984) and Context Tree Weighting (CTW) (Willems et al., 1995) compression algorithms, and study the effect of varying the order of the compression model. Our approach is substantially different from the methods adopted by typical spam filtering systems. In most spam filtering work, text is modeled with the widely used bag-of-words (BOW) representation, even though it is widely accepted that tokenization is a vulnerability of keyword-based spam filters. Some filters, such as the Chung-Kwei system (Rigoutsos and Huynh, 2004), use patterns of characters instead of word features. However, their techniques are different to the statistical data compression models that are evaluated here. In particular, while other systems use character-based features in combination with some supervised learning algorithm, compression models were designed from the ground up for the specific purpose of modeling character sequences. Furthermore, the search for useful character patterns is expensive, and does not lend itself well to the incremental learning setting that was used for the TREC evaluation. To our knowledge, our system was the only character-based system that was evaluated in the spam track at TREC 2005. The remainder of this paper is structured as follows. Section 2 outlines the approach to spam filtering that was adopted in our system with a brief review of statistical data compression models and the relation to Bayesian text classification. We then describe the filter evaluation procedure that was used for TREC 2005, as well as the four system configurations that were submitted for the official runs by our group (Section 3). In Section 4, we summarize the relevant results from the official evaluation. The major conclusions that can be drawn from the evaluation are presented in Section 5, which also outlines our plans for the future development of our system.
2
Methods
The “IJS” system uses statistical data compression models for email classification. Such models can be used to estimate the probability of an observed sequence of characters. By building one model from the training data of each class, compression models can be employed as Bayesian text classifiers (Frank et al., 2000). The classification outcome is determined by the model that deems the sequence of characters contained in the target document most likely. The following subsections describe our methods in greater detail.
2.1
Statistical Data Compression Models
Probability plays a central role in data compression: Knowing the exact probability distribution governing an information source allows us to construct optimal or nearoptimal codes for messages produced by the source. Statistical data compression algorithms exploit this relationship by building a statistical model of the information source, which can be used to estimate the probability of each possible message that can be emitted by the source. Each message d produced by such a source is typically represented as a sequence sn1 = s1 . . . sn ∈ Σ∗ of symbols over the source alphabet Σ.
For text generating sources, a symbol is usually interpreted as a single character. To make the inference problem tractable, each symbol in a message d ∈ Σ∗ is assumed to be independent of all but the preceding k symbols (the symbol’s context): P (d) =
|d| Y
P (si |si−1 1 )≈
i=1
|d| Y
P (si |si−1 i−k )
(1)
i=1
The number of context symbols k is also referred to as the order of the model. To achieve accurate prediction from limited training data, compression algorithms typically blend models of different orders, much like smoothing methods used for modeling natural language (n-gram language models).
2.1.1
Prediction by Partial Matching
The Prediction by Partial Matching (PPM) algorithm (Cleary and Witten, 1984) uses a special escape mechanism for smoothing. An order-k PPM model works as follows: When predicting the next symbol in a sequence, the longest context found in the training text is used (up to length k). If the target symbol has appeared in this context in the training text, its relative frequency within the context is used as an estimate of the symbol’s probability. These probabilities are discounted to reserve some probability mass for the escape mechanism. The accumulated escape probability is effectively distributed among symbols not seen in the current context, according to a lower-order model. The procedure is applied recursively, ultimately terminating in a default model of order −1, which always predicts a uniform distribution among all possible symbols. Many versions of the PPM algorithm exist, differing mainly in the way the escape probability is estimated. In our implementation, we used escape method D (Howard, 1993) in combination with the exclusion principle (Sayood, 2000).
2.1.2
Context Tree Weighting
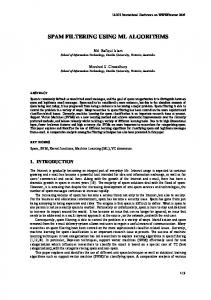
The Context Tree Weighting (CTW) algorithm (Willems et al., 1995) uses a mixture of all tree source models up to a certain order to predict the next symbol in a sequence. Each such model can be interpreted as a set of contexts with one set of parameters (i.e. next-symbol probabilities) for each context in the model. These contexts form a tree. The CTW algorithm blends all models that are subtrees of the full order-k context tree (see Figure 1). When predicting the next symbol, the models are weighted according to their Bayesian posterior, which is estimated k−1 from the training data. Although the mixture includes more than 2|Σ| different models, the algorithm’s complexity is linear in the length of the training text. This is achieved with a clever decomposition of the posteriors, exploiting the property that many of these models share the same parameters. The CTW algorithm has favorable theoretical properties, i.e. a theoretical upper bound on non-asymptotic redundancy can be proven for this algorithm. However, the algorithm is not widely used in practice, possibly due to its complex implementation, and the observation that it yields only minor gains in compression compared to PPM (or no gains at all). The original CTW algorithm was designed for compression of binary sources.
We used a version of the algorithm that is adapted for multi-alphabet sources, using a PPM-style escape method for estimating zero-frequency symbols that is described in (Tjalkens et al., 1993). p(0)
p(0|1)
p(0|11)
p(0|1)
p(0|11)
1
0
1
0
1
0
1
0
1 0
1 0
1 0
1 0
Input sequence: 010110 ...
Figure 1: All tree models considered by an order-2 CTW algorithm with a binary alphabet. An example input sequence is given to show the context that each of the models use for prediction of the last character in this sequence.
2.2
Using Compression Models for Text Classification
To classify a target document d, Bayesian classifiers select the class c that is most probable with respect to the document text using Bayes rule:
c(d) = arg max [P (c|d)] c∈C
= arg max [P (c)P (d|c)] c∈C
(2) (3)
A statistical compression model Mc , built from the training data for class c, can be used to estimate the conditional probability of the document given the class P (d|c): c(d) = arg
max
M ∈{Mham ,Mspam }
[P (c)PM (d)]
(4)
For the binary spam filtering problem, compression models Mspam and Mham are trained from examples of spam and legitimate email. In our implementation, we ignored the class priors, which is equivalent to setting P (c) in Equation 4 to 0.5 for both spam and ham.
2.3
Adapting the Model During Classification
Each sequence of characters in an email message (such as, for example, a word), can be considered a piece of evidence on which the final classification is based. The simplest such sequence is a single character, which is always evaluated in the context of its preceding k characters. Each sequence favors classification into one particular class, albeit to a varying degree. While the first occurrence of a sequence undoubtedly provides fresh evidence to be used for classification, repetitions of a sequence are to some extent redundant, since they convey little new information.
However, when evaluating the (conditional) probability of a document according to Equation 1, repeated occurrences of the same sequence contribute an equal weight on the classification outcome. To discount the influence of repeated subsequences, we chose to allow the model to adapt during the evaluation of the target document, as would typically be the case in adaptive data compression. To this end, the statistical counters contained in model M are incremented after the evaluation of each character when estimating the conditional document probability PM (d) according to Equation 1. These statistics are removed from both models Mham and Mspam after classification. Updating the models at each character improved performance considerably in our preliminary experiments, as well as in follow-up experiments on the public corpus compiled for TREC. A further theoretical analysis of this modification and empirical evaluation of its effect on performance are given in Bratko and Filipiˇc (2005).
2.4
Calculating the Spamminess Score
Probability estimates for P (d|spam) and P (d|ham) are computed as a product over all character occurrences in the document text (Equation 1). With increasing document length, these estimates converge towards zero. To convert probability estimates into “spamminess scores” that are comparable across documents, the following transformation was used: spam score(d) =
p(d|spam)1/|d| p(d|spam)1/|d| + p(d|ham)1/|d|
(5)
In the above equation, |d| denotes the length of the document text, i.e. the total number of all character occurrences. The spamminess score can be loosely interpreted as the geometric mean of the probability that the target document is spam, calculated over all character occurrences. Note that this transformation does not affect the classification outcome for any target document, but helps produce scores that are relatively independent of document length. This is crucial when thresholding is used to reach a desirable tradeoff between ham misclassification and spam misclassification, which is also the basis of the Receiver Operating Characteristic (ROC) curve analysis that was the primary measure of classifier performance for TREC.
3
The Spam Filtering Task at TREC 2005
For the spam filtering task at TREC, a number of email corpora containing legitimate (ham) and spam email were constructed automatically or labeled by hand. To make the evaluation realistic, messages were ordered by time of arrival. Evaluation is performed by presenting each message in sequence to the classifier, which has to label the message as spam or ham (i.e. legitimate mail), as well as provide some measure of confidence in the prediction - the “spamminess score”. After each classification, the filter is informed of the true label of the message, which allows the filter to update its model accordingly. This behavior simulates a typical setting in
personal email filtering, which is usually based on user feedback, with the additional assumption that the user promptly corrects the classifier after every misclassification. Each participating group was allowed to submit up to four different filters for evaluation.
3.1
Filters Submitted by the IJS Group
The filters that were submitted by our group at the Jozef Stefan Institute are listed in Table 1. Three of the filters were based the PPM compression algorithm, the fourth was based on the CTW algorithm, since, in our initial tests, it was found that the PPM algorithm generally outperforms CTW. The difference between the three PPM-based filters was in a different order of the model, since we primarily wanted to study the effect of varying the PPM model order. All of the four submitted filters adaptive the classification models during evaluation of the target document, as described in Section 2.3. This decision was based on the results of initial experiments, in which this approach generally outperformed a static model. In hindsight, we probably should have omitted the CTW-based method altogether and submitted at least one filter in which the model would be kept static during classification. We would very much wish to see the difference in performance confirmed in the results of experiments on the private corpora.
Table 1: Filters submitted by IJS for evaluation in the TREC 2005 spam track. Label Comp. algorithm ijsSPAM1pm8 PPM ijsSPAM2pm6 PPM ijsSPAM3pm4 PPM ijsSPAM4cw8 CTW
Order 8 6 4 8
Our system was designed as a client-server application. The server maintains the compression models required for classification in main memory and updates the models incrementally with each new training example. The system performs very limited message preprocessing, which primarily includes mime-decoding and stripping messages of all non-textual message parts. All sequences of whitespace characters (tabs, spaces and newline characters) were replaced by a single space. The reason for this step was to undo line breaks added to messages by email clients. The newline characters that delimit header fields and separate the header from the body part were preserved. No other preprocessing was done. Since the data collections used for TREC were large, we limited memory usage to around 500MB. When this limit was reached, the server discarded one half of the training data and rebuilt the classification models from the remaining examples. In general, the newest examples were kept for the pruned model, but measures were also taken to keep the dataset balanced. Specifically, if the number of all training messages was N when the memory limit was hit, the server would discard all but the newest N/4 spam and N/4 ham messages.
4
Results
In this section, we summarize the results of the TREC evaluation that are most relevant to our system. In particular, we compare the performance of different compression models and evaluate the effect of varying the order of the compression model. Finally, we compare the performance of our system to the results achieved by other participants. The full official results of the evaluation are reported in the spam track results section of the TREC 2005 proceedings1 .
4.1
Datasets
Four email datasets were used for the official TREC evaluation. The TREC 2005 public dataset2 (t05p) contains almost 100,000 messages received by employees of the Enron corporation. The dataset was prepared specifically for the evaluation in the TREC 2005 spam track. The messages were labeled semi-automatically with an iterative procedure described by Cormack and Lynam (2005). The mrx, sb and tm datasets contain hand-labeled personal email. As these datasets are not publicly available for privacy reasons, the evaluation of filters was done by the organizers of the TREC 2005 spam track. The basic statistics for all four datasets are given in Table 2.
Table 2: Basic statistics for the evaluation datasets. Dataset Messages Ham Spam t05p 92189 39399 52790 mrx 49086 9038 40048 sb 7006 6231 775 tm 170201 150685 19516
4.2
Evaluation Criteria
A number of evaluation criteria proposed by Cormack and Lynam (2004) were used for the official evaluation. In this paper, we only report on a selection of these measures: • HMR: Ham Misclassification Rate, the fraction of ham messages labeled as spam. • SMR: Spam Misclassification Rate, the fraction of spam messages labeled as ham. • 1-ROCA: Area above the Receiver Operating Characteristic (ROC) curve. We believe the 1-ROCA statistic is the most comprehensive measure, since it captures the behavior of the filter at different filtering thresholds. Increasing the 1 2
http://trec.nist.gov/pubs.html http://trec.nist.gov/data.html
filtering threshold will reduce the HMR at the expense of increasing the SMR, and vice versa. The desired tradeoff will generally depend on the user and the type of mail they receive. The HMR and SMR statistics are interesting for practical purposes, since they are easy to interpret and give a good idea of the kind of performance one can expect from a spam filter. They are, however, less suitable for comparing filters, since one of these measures can always be improved at the expense of the other. For this reason, we focus on the 1-ROCA statistic when comparing different filters.
4.3
A Comparison Between Compression Algorithms
A comparison between the performance of the PPM and CTW algorithms is given in Figure 2. In all comparisons, an order-8 compression model is used, since we only submitted an order-8 CTW-based filter. The reason for this is that the CTW algorithm weights models of different orders according to their utility, so we expect performance to improve as the order of the model is increased. Dataset CTW PPM 0.45 SpamAssa 0.161 0.132 t05p 0.025 0.021 mrx 0.4 0.063 0.069 sb 0.422 0.372 0.35 tm 0.167 0.155
1-ROCA (%)
0.3 0.25
CTW PPM
0.2 0.15 0.1 0.05 0
t05p
mrx
sb
tm
Figure 2: Performance of CTW and PPM algorithms for spam filtering. Although the performance of the algorithms is similar, the PPM algorithm usually outperforms CTW in the 1-ROCA statistic, with the exception of the mrx dataset. We observed a similar pattern in our preliminary experiments (Bratko and Filipiˇc, 2005). The CTW algorithm is more complex and slower than PPM, without yielding any noticeable improvement in PPM’s performance.
4.4
Varying the Model Order
The effect of varying the order of the PPM compression model on classification performance is given in Figure 3. No particular model is uniformly best, however, it can be seen that using an order-6 model usually produces good results. In data compression, it is known that increasing the order of PPM to beyond 5 characters or so usually results in a gradual decrease of compression performance (Teahan, 2000), so the results are not unexpected. Since the difference in performance is much greater between different datasets than the order of the PPM model, we may conclude that the filter is rather robust to the choice of this parameter.
Comparison 0.5 of order-4, order-6 and order-8 PPM models. The best results in the 1-AUC statistic are in bold. 0.45
Order
1-ROCA (%)
Dataset 0.4 SpamAssassin t05p 0.35 mrx 0.3 sb tm 0.25
4 0.188 0.022 0.05 0.475 0.181
6 0.148 0.019 0.069 0.285 0.135
8 0.132 0.021 0.069 0.372 0.155
t05p mrx sb tm
0.2 0.15 0.1 0.05 0
4
6
8
PPM model order
Figure 3: Comparison of order-4, order-6 and order-8 PPM models.
4.5
Comparison to Other Filters
A summary of the results achieved with our order-6 PPM model (ijsSPAM2pm6) on the official datasets is listed in the first row of Table 3. Overall, ijsSPAM2pm6 was our best performing filter configuration. The results achieved by the best performing filters of six other groups are also listed for comparison. The IJS system outperformed other systems on most of the evaluation corpora in the 1-ROCA criterion. However, the tradeoff between ham misclassification and spam misclassification varies considerably for different datasets. A comparison with the statistics in Table 2 reveals that our system disproportionately favored classification into the class that contains more training examples. Our system did not vary the filtering threshold dynamically, but rather kept it fixed at a spamminess score above 0.5. The results in Table 3 indicate that adjusting the threshold with respect to the number of ham and spam training examples or, alternatively, with respect to previous performance statistics, would be beneficial. This modification would have no effect on the ROC curve analysis.
Table 3: Comparison of seven best performing filters from different groups. t05p
mrx
sb
tm
Filter
1-roca
hm%
sm%
1-roca
hm%
sm%
1-roca
hm%
sm%
1-roca
hm%
sm%
ijsSPAM2
0.019
0.23
0.95
0.069
1.52
0.34
0.285
0.16
11.74
0.135
0.36
3.43
lbSPAM2
0.037
0.51
0.93
0.083
1.63
0.23
0.835
0.03
33.16
0.411
0.29
11.63
621SPAM1
0.044
2.38
0.20
2.616
2.31
2.77
2.389
1.57
5.29
0.161
2.17
0.74
crmSPAM2
0.122
0.62
0.87
0.051
1.50
0.24
1.888
0.30
13.55
0.166
0.21
2.91
tamSPAM1
0.164
0.26
4.10
0.138
0.28
2.55
1.892
0.14
27.48
0.294
0.25
8.25
yorSPAM2
0.457
0.92
1.74
0.051
0.34
1.03
0.983
0.14
23.64
0.619
0.25
14.90
kidSPAM1
1.463
0.91
9.40
1.274
4.02
9.10
3.553
3.37
13.57
0.530
0.65
5.24
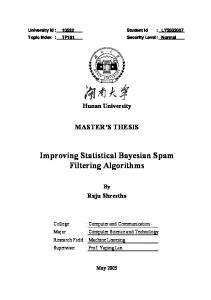
ROC curves for the same set of filters on the aggregate result set of per-message classification outcomes on all four datasets are plotted in Figure 4. Note that ham misclassification and spam misclassification rates are plotted in log scale. The ROC
learning curves on the same aggregate results for the seven best-performing groups is also depicted in Figure 4. The graph shows how the area above the ROC curve changes with an increasing number of examples. Note that the 1-ROCA statistic is plotted in log-scale. All filters learn fast at the start, but performance levels off at around 50,000 messages. This behavior may be attributed to the implicit bias in the learning algorithms, data or concept drift, or even errors in the gold stand. It remains to be seen whether a more refined model pruning strategy would help the filter to continue improving beyond this mark. 0.01
621SPAM1 kidSPAM1 yorSPAM2 tamSPAM1 lbSPAM2 crmSPAM2 ijsSPAM2
0.10 (1-R OC A)% (logit s cale)
% S pam Mis clas s ification (logit s cale)
50.00
1.00
ijsSPAM2 crmSPAM2 lbSPAM2 tamSPAM1 yorSPAM2 kidSPAM1 621SPAM1
10.00
50.00 0.01
0.10
1.00 % Ham Mis clas s ification (logit s cale)
10.00
10.00
1.00
0.10
50.00
0.01 0
50000
100000
150000
200000
250000
300000
350000
Mes s ages
Figure 4: ROC curves (left) and learning curves (right) for seven best performing filters from different groups on the aggregated raw results.
5
Conclusion
Our system performed beyond our expectations in the TREC evaluation, especially since some competing systems were large open source and commercial (IBM) solutions with a long development history. The TREC results confirmed our intuition that compression models offer a number of advantages over word-based spam filtering methods. By using character-based models, tokenization, stemming and other tedious and error-prone preprocessing steps that are often exploited by spammers are omitted altogether. Also, characteristic sequences of punctuation and other special characters, which are generally thought to be useful in spam filtering, are naturally included in the model. We find that Prediction by Partial Matching usually outperforms the Context Tree Weighting algorithm, although the margin is typically small. Somewhat surprisingly, varying the order of the PPM compression model does not have a major effect on performance. An order-6 PPM model performed best in most experiments. This filter configuration was also the best ranking filter overall in the 1-ROCA statistic for most of the datasets in the official evaluation. Despite the encouraging results at TREC, we believe there is much room for improvement in our system. In future work, we intend to adapt the system to use a disk-based a model, rather than keeping the data structures in main memory. This
would enable us to overcome the need for pruning the model, which was typically required at around 15,000 examples. We also wish to employ a suitable mechanism for dynamically adapting the filtering threshold. Finally, an interesting avenue for future research would be to devise a strategy which would automatically determine the order of the PPM model that optimizes classification performance.
References Bratko, A. and B. Filipiˇc (2005). Spam filtering using compression models. Technical Report IJS-DP-9227, Department of Intelligent Systems, Joˇzef Stefan Institute, Ljubljana, Slovenia. Cleary, J. G. and I. H. Witten (1984, April). Data compression using adaptive coding and partial string matching. IEEE Transactions on Communications COM32 (4), 396–402. Cormack, G. and T. Lynam (2004). A study of supervised spam detection applied to eight months of personal email. Technical report, School of Computer Science, University of Waterloo. Cormack, G. and T. Lynam (2005). Spam corpus creation for trec. In Proceedings of Second Conference on Email and Anti-Spam CEAS 2005, Stanford University, Palo Alto, CA. Frank, E., C. Chui, and I. H. Witten (2000). Text categorization using compression models. In Proceedings of DCC-00, IEEE Data Compression Conference, Snowbird, US, pp. 200–209. IEEE Computer Society Press, Los Alamitos, US. Howard, P. (1993). The Design and Analysis of Efficient Lossless Data Compression Systems. Ph. D. thesis, Brown University, Providence, Rhode Island. Rigoutsos, I. and T. Huynh (2004, July). Chung-kwei: A pattern-discovery-based system for the automatic identification of unsolicited e-mail messages (spam). In Proceedings of the First Conference on Email and Anti-Spam. Sayood, K. (2000). Introduction to Data Compression, Chapter 6.2.4. Elsevier. Teahan, W. J. (2000). Text classification and segmentation using minimum crossentropy. In Proceeding of RIAO-00, 6th International Conference “Recherche d’Information Assistee par Ordinateur”, Paris, FR. Tjalkens, J., Y. Shtarkov, and F. M. J. Willems (1993). Context tree weighting: Multi-alphabet sources. In Proceedings of the 14th Symp. on Info. Theory, Benelux, pp. 128–135. Willems, F. M. J., Y. M. Shtarkov, and T. J. Tjalkens (1995). The context-tree weighting method: Basic properties. IEEE Trans. Info. Theory 41 (3), 653–664.