fuscation techniques into an image contaning embed- ... to recognize a spam email when an OCR-based mod- .... imageio/metadata/package-summary.html.
Improving Image Spam Filtering Using Image Text Features
Battista Biggio, Giorgio Fumera, Ignazio Pillai, Fabio Roli Electrical and Electronic Eng. Dept., Univ. of Cagliari Piazza d’Armi, 09123 Cagliari, Italy {battista.biggio,fumera,pillai,roli}@diee.unica.it
Abstract In this paper we consider the approach to image spam filtering based on using image classifiers aimed at discriminating between ham and spam images, previously proposed by other authors. In previous works this approach was implemented using “generic” image features. In this paper we show that its effectiveness can be improved by using specific features related to the graphical characteristics of embedded text. The features we consider are derived from measures which were proposed in our previous works with the aim of detecting image obfuscation techniques often used by spammers to make OCR tools ineffective. An experimental investigation is carried out on a set of images taken from two corpora of real ham and spam emails.
1
Introduction
Image-based spam (shortly, image spam) is a trick introduced by spammers few years ago, which consists in embedding all the textual information (i.e., the spam message) into an image, and attaching the obtained text image to the spam e-mail, thus evading any textual analysis performed by the spam filter (usually, a na¨ıve Bayes classifier). OCR-based modules can be used against image spam, to allow the analysis of the semantic content embedded into images. Their potential effectiveness was investigated by the authors in [7]. However, this approach requires high processing time and can only be effective for clean images. For this reason, spammers often obfuscate the text embedded into images. Thus, a spam filter equipped with an OCRbased module as the unique countermeasure against image spam is vulnerable to image spam with obfuscated text. This was proven by the authors [5] for the
popular open source SpamAssassin filter.1 Some authors proposed a different approach against image spam. They faced the problem of recognizing image spam as a two-class classification (discrimination) problem between ham and spam images [11, 1, 6], which are defined as images that are respectively attached to ham or spam e-mails. To this aim, different sets of features were proposed, either visual [11, 1] or mainly derived from image metadata [6]. It is worth pointing out that this approach could be unaffected by the use of text obfuscation techniques and has a lower computational cost than OCR-based techniques. In previous works we proposed a more specific approach, focused on the subclass of image spam characterized by obfuscated text [8, 3, 4]. Our approach was based on the idea of detecting the presence of obfuscation techniques into an image contaning embedded text, which could be considered as an evidence of spamminess of the email to which the image is attached. This approach is complementary to the one based on OCR tools, in the sense that it could allow to recognize a spam email when an OCR-based module is made ineffective by text obfuscation. To evaluate this approach, we developed some measures aimed at detecting and quantifying the amount of image text defects which are typical consequences of known obfuscation techniques used by spammers, like broken characters or background noise interfering with characters. A preliminary experimental evaluation showed that our measures were actually capable of detecting typical obfuscation techniques used by spammers. This suggested that a simple way to exploit them into a modular spam filter (like SpamAssassin) to build an image spam filtering module could be to assign a higher “spamminess degree” to emails with attached images characterized by higher values of our measures. However, the problem of how to integrate effectively such measures in a spam filter architecture including modules based on OCR or on image classification tech1
http://spamassassin.apache.org
niques was left open. A further experimental investigation on a real data set composed by ham and spam images revealed that our measures, due to their “generality”, detect also image defects present in ham images (due for instance to text placed over a photograph, or to complex characaters and backgrounds used in postcards or playbills, which are typical examples of images attached to ham emails), and that many ham images result more noisy than spam ones. Therefore our measures can not be directly used to recognize image spam with obfuscated text using the simple approach described above (namely, the higher the amount of noise, the higher the “spamminess” of the corresponding email). However we also found that the amount of noise evaluated by our measures has rather different ranges for ham and spam images, due to the nature of ham images and of the particular way in which spam images are typically constructed. This suggested that our measures could be effectively exploited as visual features into an image spam filtering module made up of an image classifier, like the ones proposed in [11, 1, 6]. In this work we show how the measures we proposed in previous works can be exploited as explained above. We point out that the main difference with respect to our previous approach [3] is the following: instead of using our measures to detect if the image text was obfuscated in an adversarial way to make it unreadable by an OCR tool, we use them to improve the discriminability between ham and spam images in a space made up of image features. In the next section we give a brief description of the visual features proposed in [1, 6]. The measures proposed in our previous works and the approach experimented in this paper are described in section 3. In section 4 we report experimental results on real data sets of ham and spam images.
2
Previous works
In [1, 6] the task of recognizing image spam was addressed as a two-class classification problem between ham and spam images, in a given feature space. This approach consists in training a classification algorithm (like a decision tree or a support vector machine) on a training set made up of labelled ham and spam images, to find a decision function in the considered feature space. Such decision function is then used at operation phase to label new images. In [1] five visual features were proposed, related to the characteristics of text regions inside an image. The first feature was the relative area of the image occupied by text. It was used with the underlying
idea that spam images contain more text than legitimate ones. The other features used were color heterogeneity and saturation computed separately over text and non-text regions, based on the assumption that images which are synthetic for their main part are more likely to be spam. The two color saturation features are defined as the fraction of pixels (in the corresponding text or non-text region) for which max(R, G, B) − min(R, G, B) is greater than a threshold T (set to 50 in that work). These features rely on the assumption that synthetic regions are more saturated than natural ones. Color heterogeneity features are computed by using minimum variance quantization to convert the original image to an indexed one, with a smaller number of colours. In particular, nontext regions were quantized up to k = 10 colours, while text regions were quantized up to k = 8 colours. The two color heterogeneity features are then computed as RMS errors between the two images, separately for text and non-text regions. Analogously to the color saturation features, also the color heterogeneity features rely on the assumption that synthetic regions contain less colours than natural ones. A support vector classifier was used in that work. In [6] a different kind of features was used. Although some visual features were used as well (like average RGB colours, the relative area occupied by the most common colour, and colour saturation features as in [1]), the most important role was played by metadata extracted from the images. More precisely, all image metadata were used, including file format, file size (expressed in KB), image height and width, information about the presence of comments in the image, number of frames, bits per pixel, logical height and width, components, bands, etc.2 It is worth noting that this can generate thousands of different features, potentially increasing the risk of overfitting as well as leading to a relatively higher computational cost. For these reasons, a feature selection algorithm was used in [6] to select the most discriminant features. The classification algorithm used in that work was a decision tree. Using the features described above and the corresponding classification algorithms, classification accuracies between 0.8 and 0.9 were attained in [1, 6] on real and artificial data sets of ham and spam images. We point out that the visual features used in [6] are not inspired by specific characteristics of ham and spam images. Analogously, alhtough the features used in [1] are focused on a peculiarity of spam images, namely the presence of embedded text, they consider “generic” 2 As reported in [6], for a full listing of the metadata fields in various image formats, see http://java.sun.com/j2se/1.5.0/docs/api/javax/ imageio/metadata/package-summary.html.
characteristics of text areas (related to colour).
3
Recognizing image spam through low-level characteristics of image text
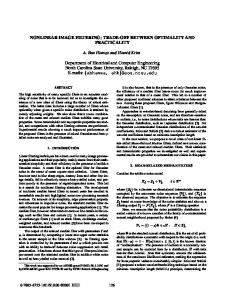
An approach for recognizing image spam different from the ones described in section 2 was proposed by the authors in previous works [8, 4, 3]. As described in the introduction, our approach was based on the idea that image spam with obfuscated text, which can not be recognized by means of an OCR tool, could be recognized by detecting the presence of adversarial obfuscation techniques. In other words, when the “signal” (i.e., the spam text) can not be recognized, the presence of adversarial “noise” (i.e., the consequence of the adversarial action carried out by the spammer to conceal the spam text) could reveal the image “spamminess”. To this aim, the first step was to devise measures capable to detect the presence and to evaluate the amount of obfuscation techniques into a given image. To avoid overfitting, we did not focus on characteristics of specific obfuscation techniques (like small random dots around characters), but on identifying kinds of image text defects common to different techniques. The rationale is that measures which overfit specific techniques could be evaded more easily by spammers (as happens, for instance, for spam filtering techniques based on detecting specific spam words, or on digital signatures). Analyzing obfuscation techniques observed in real image spam emails (see the examples in figure 1), we identified three main kinds of image text defects: • the presence of small (relative to character size) fragments around characters (due for instance to characters broken by random lines of the same colour as the background, to characters filled with different colours, or to small background components, like random dots, around characters); • the presence of large (relative to character size) fragments around characters (due for instance to characters interfering each other, or interfering with noise components like random segments of the same colour as the text); • large background shapes overlapping with characters (due to placing text over non-uniform background). We then developed a measure for each of the three kinds of image text defects described above.
Figure 1: Examples of real spam images with text obfuscation techniques against OCR. The images are taken from the authors’ personal corpus described in section 4. algorithms usually work on binarized images, we chose to compute our measures after binarizing the original image. Two of our measures are based on the perimetric complexity measure (sometimes referred to as the inverse of compactness), which is used in the psychophysics of reading literature [9] to evaluate difficulty for a human in reading a text, and was also used in [2] to assess the legibility of CAPTCHAs. Perimetric complexity is defined for black and white images, as the squared length of the boundary between black and white pixels (the “perimeter”) in the whole image, P , divided by the “ink-area” A (namely, the number of pixels belonging to the foreground components),3 P 2 /A. A notable property is that it is scale invariant. For our task, computing P 2 /A over the whole image was not useful, because it depends on the number of components in the binary image (i.e., the “inkarea”) for each given component, which can be very different in different images. However, we found that by measuring P 2 /A for each individual component of a binary image, it is possible to tell clean characters from noisy ones, or from noise components. In particular, we found that clean characters exhibit values of P 2 /A in a certain range (about (16, 150]), while broken characters or small noise components exhibit lower values of P 2 /A (namely, they are less complex than full characters). Analogously, shapes corresponding to 3
Since we were focusing on image defects whose consequence is to make OCR tools ineffective, and OCR
We computed P as the number of background pixels 4-connected to at least one foreground pixel, and A as the number of foreground pixels.
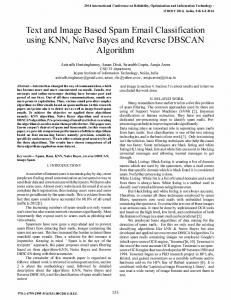
connected characters or to complex noise components are usually characterized by higher values of P 2 /A. Given a binary image, our measures were defined as follows (see [3]). First, all the connected components in the binarized image are identified, and are labelled as character- or noise-like, depending on their P 2 /A value as described above. Then the first two measures, named f1 and f2 , were defined as the fraction of noiselike components, and as the relative area occupied by them with respect to the overall area of all components. They are aimed respectively at detecting the presence of small and of large noise components. To further focus on noise components close to characters (which are more detrimental to OCR performance), we subdivided the image into p × q equally sized cells (we chose p = q = 10), and computed f1 and f2 as the average of the values defined above over all cells. In the case of f1 , we disregarded cells in which no characterlike components were present (if no character-like components were present in the image, f1 was set to 1). The third measure, denoted as f3 , was aimed at detecting large background components overlapping with characters and hiding them, and was defined as the relative number of edge pixels (obtained by applying a Canny edge detector to the original image) which lie inside character-like components of the binary image. All these measures are in the range [0, 1], where higher values indicate more noisy text. As pointed out in the introduction, the problem of how to integrate effectively such measures in a spam filter architecture including modules based on OCR or on image classification techniques was left open. A possible simple solution was suggested, namely to assign a higher “spamminess degree” to emails with attached images characterized by higher values of our measures, based on the rationale that email with attached images containing text which is obfuscated in an adversarial way are likely to be spam. However subsequent experiments carried out on real ham and spam emails with attached images revealed that our measures also detect the kind of artifacts present in many ham images containing text, and that often the amount of noise in ham images (evaluated by our measures) is higher than in spam ones. The noise in ham images can be due for instance to text placed over photographs, or to complex character shapes and backgrounds which can be found in postcards or playbills, which are typical kinds of images attached to ham emails (see the example in figure 2). Therefore the simple approach mentioned above for detecting image spam with obfuscated text would not be effective, since many ham images could be deemed noisy as well, possibly leading to many false positives. Nevertheless, we also found that the amount of noise
Figure 2: Example of a real ham image with embedded text which could be difficult to read by an OCR tool. This image is taken from corpus used in [6], described in section 4.
evaluated by our measures has rather different ranges for spam images (both clean and obfuscated), and spam images. This difference does not consists simply in lower values of our measures for ham images and higher values for spam images, as hypothesized in our previous works, but in a more complex pattern of values. This is due to the nature of ham images (in many cases the embedded text and the background are rather complex for OCR tools, as in the examples reported above), and to the particular way in which spam images are typically constructed (they are usually synthetc images with clean, regular text, possibly obfuscated at a later time with artificial techniques). This suggested that our measures (at least in the way they were defined) could be more effectively exploited as features of an image classification algorithm as in the approach used in [1, 6], letting the learning algorithm automatically find the regions of the feature space corresponding to ham and spam images, on the basis of a training set made up of labelled images. In particular, our measures could be used together with other visual features (like the ones proposed in [1, 6]), to increase their discriminant capability. Indeed, we point out that visual features proposed in other works focus on “generic” characteristics of the whole image ([6]) or of its text areas ([1]), related to colours (see section 2), our features focus instead on more specific characteristics of text areas, related to the shape of the
embedded text characters and to the non-uniformity of background. To test this potential use of our features, we slightly modified the way in which f1 and f2 are computed. We localize first text areas, then binarize separately each text area, and set the colour of the remaining parts of the image as the background colour. This allows to focus only on text areas without the “trick” of subdividing the images into cells. In this way, f1 and f2 are simply computed as the fraction of noise-like components in the whole text areas, and as the relative area occupied by them. Text localization is carried out using an algorithm recently proposed by R. Achanta.4 To improve the reliability of such features we also consider the relative area occupied by text, namely the number of pixels belonging to text areas divided by te image size. An experimental evaluation of the discriminant capability of our features is given in the next section.
4
Experimental results
In this section we present experimental results aimed at evaluating the usefulness of our features in discriminating ham and spam images, when used in an image classification algorithm. In particuar, we test the discriminant capability of our features when used both alone and together with other visual features. 4.1
Esperimental setup
The experiments were carried out on two corpora of images taken from real emails. The first corpora is a collection of personal emails used in [6], and is made up of 2, 006 ham emails and 3, 297 spam emails.5 We point out that, to our knowledge, this is the only publicly available corpus of real ham images. The second corpus was made up by the same ham images of the first one, and of 8, 549 spam images collected by the authors since January 2006. All the images used in our experiments are publicly available.6 For each corpus of images, we evaluated the classification performance attained by the two sets of image features proposed in [1, 6], and by our four features described in section 3, using the same base classifier. We then evaluated two kinds of combination of our features with the other ones. The first combination is at the feature level, and consists simply in concatenat4
http://lcavwww.epfl.ch/~achanta/TextDetection/ TextDetectionResults.html 5 Note that the label ‘ham’ and ‘spam’ refers to the email to which the image was attached. 6 http://prag.diee.unica.it/n3ws1t0/eng/ spamRepository
ing the two feature vectors and in training a classifier on the new feature vectors. The second one is at the score level, and consists in training two different classifiers on each set of features, and then in combining the scores provided by the two classifiers using another classifier. Classification performance was measured with the receiver operating characteristic (ROC) curve, to avoid arbitrary selection of the working point of the cassifier. We used two base classifiers: support vector machines (SVMs) with radial basis function (RBF) kernel for experiments with the features proposed in [1], and decision trees (C4.5 implementation [10]) for experiments with the features proposed in [6]. Note that for both set of features the base classifier is the same used in the corresponding work. When SVMs were used, feature values were normalized to obtain zero mean and unit variance. The ROC curves were computed using a 5-fold cross validation. Classifier parameters (the regularization parameter C and the kernel parameter σ for SVMs, and the pruning factor for decision trees) were chosen by an inner 5-fold cross validation on the training set of each fold. For SVMs, all the possible combinations of γ = 0.01, 0.1, 0.5, 1.0, 10 and C = 0.1, 1.0, 10.0 were evaluated. For decision trees, we considered confidence factor (i.e., the so-called pruning level) values ranging from 0.05 to 0.65 with steps of 0.10 (the standard C4.5 tree generation procedure was used, without the “windowing” technique [10]). The objective function used for parameter selction was defined as the sum of the false positive (FP) rates corresponding to different false negative (FN) rates (from 5% to 30% with steps of 2.5%). The rationale was to prefer classifiers exhibiting low FP rates for reasonably small values of the FN rate, as in spam filtering FP errors are more harmful than FN ones. When different sets of features were combined at the score level, a SVM with RBF kernel was used to combine scores provided by the two base classifiers. Parameter selection for this SVM was carried out on the training set of each crossvalidation fold, using a further 5-fold cross validation and the same parameter values reported above. All the above procedure was repeated five times, and the average ROC curves was finally computerd, together with its standard deviation. 4.2
Results
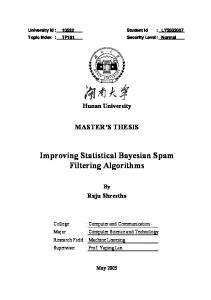
Results are reported in figures 3 (for the corpus used in [6]) and 4 (for the corpus made up of the ham images in [6] and our spam images). In each figure, the upper and lower plot refer to experiments with the features proposed respectively in [1] and [6]. Four ROC curves
are reported in each plot:7 the one obtained by the set of features proposed either [1] or [6], the one obtained by our set of four features, and the ones obtained by combining at feature and score level the two sets of features above. Note that only the most significant part of the ROC for the considered task is reported in these figures, namely the one corresponding to small values of the FN and especially of the FP rate. These results show that the features proposed in [6] have a relatively good discriminant capability: they allow to attain FP rates below 0.06 for FN rates not higher than 0.05. Features proposed in [1] exhibit different performances over the two data sets, in particular FP rates do not exceed 0.04 for FN rates higher than 0.05 over the first data set, while FP rates do not exceed 0.1 for FN rates higher than 0.15 over the second data set. Our features are less effective when used alone, except when compared to the features in [1] on the data set containing our spam images: in this case they allow to attain a lower FP rate for a FN rate higher than 0.15. In any case, the discriminant capability of the features of [1] and [6] is improved when they are combined, either at the feature or at the score level, with our features. It can be seen that the higher improvement is attained with respect to the features of [1]. The improvement over the features in [6] is instead smaller, especially with feature level combination. This is probably due to the fact that the features of [6] are not homogeneous: as explained in section 2, they consists in six visual features (numerical values) and in image meta-data (categorical values). Moreover, their number is much higher than that of our features (in the considered data sets there were thousands of meta data). Indeed, the higher improvement was attained with the score level combination of features. To further check if our features can increase the discriminant capability of other numerical features like the ones in [1], we devised another set of four “generic” visual features which could be used for image spam recognition, mainly inspired by the rationale discussed in [1, 6]: • logarithm of the number of different colours in the image; • logarithm of the number of pixels of the image; • relative area occupied by the most common colour (used also in [6]); • relative area occupied by text (used in [1]). 7
Formally, the ROC curve is defined as the true positive rate versus the false positive rate. We report results in terms of the FP rate versus the FN rate for better legibility.
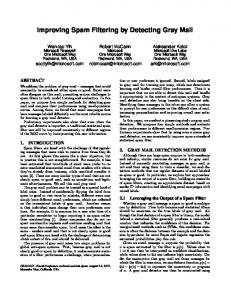
The results are reported in figure 5. A comparison with figures 3 and 4 shows that the above “generic” features have a better discriminant capability than the four features proposed in section 3, and also with respect to the ones in [1] and in [6]. In any case, their discriminant capability is improved when combined with the features proposed in section 3, as for the features in [1]. We point out that an improvement can be observed also on the data set used in [6], despite the performance attained by the “generic” features was very good: the FP rate, which was below 0.01 for values of the FN rate higher than 0.05, is reduced to almost 0 when the features are combined at the feature level. The above result indicate that using visual features tailored to specific characteristics of image spam (in this case, the “shape” of characters of the text embedded into an image) can allow to improve the discriminant capability of “generic” visual features. In particular, a simple feature level combination (i.e., concatenating the feature vectors) could be effective when all the features are homogeneous (as for the ones proposed in [1]). On the other hand, combining them at the score level could be the best choice when they are not homogeneous or if their number is very different, as in the case of image meta-data used in [6]. Higher improvements could be attained by devising features even more tailored to specific characteristics of image spam than the ones considered in this paper, which were originally devised for a slightly different goal as explained in section 3. Finally, we believe that the approach proposed in our previous works against image spam (namely, recognizing it by detecting the presence of embedded text obfuscated in adversarial way, if any) still deserves attention, even because its relevance could go beyond the spam filtering task. This approach could be made effective by a more proper choice of features capable to detect not all kinds of text obfuscation, but just the adversarial obfuscation.
Acknowledgments We would like to thank Mark Dredze (Computer and Information Science Dept., University of Pennsylvania) for making his data set publicly available and sending us his code for performing the feature extraction. We would also like to thank Radhakrishna Achanta and Sabine S¨ usstrunk (Images and Visual Representation Group, IVRG/LCAV/IC/EPFL, http://ivrg. epfl.ch/index.html) for contributing the text detection code for our tests and helping with text detection in about 10, 000 spam images.
References [1] H. Aradhye, G. Myers, and J. A. Herson. Image analysis for efficient categorization of image-based spam e-mail. In Proc. Int. Conf. Document Analysis and Recognition, pages 914–918, 2005. [2] H. S. Baird and M. Chew. Baffletext: a human interactive proof. In Proc. IS&T/SPIE Document Recognition & Retrieval Conf., 2003.
aradhye text fusion (feature level) fusion (score level)
0.18 0.16 0.14 0.12 FP
[3] B. Biggio, G. Fumera, I. Pillai, and F. Roli. Image spam filtering by content obscuring detection. In Fourth Conference on Email and AntiSpam (CEAS), Microsoft Research Silicon Valley, Mountain View, California, 2-3 August 2007.
0.2
[4] B. Biggio, G. Fumera, I. Pillai, and F. Roli. Image spam filtering using visual information. In 14th International Conference on Image Analysis and Processing, pages 105–110, Modena, Italy, 10-14 September 2007. IEEE Computer Society.
0.1 0.08 0.06 0.04 0.02
[5] B. Biggio, G. Fumera, I. Pillai, F. Roli, and R. Satta. Evading spamassassin. Virus Bulletin, November 2007, http://www.virusbtn.com/vb200711/pdf.
0
[8] G. Fumera, I. Pillai, F. Roli, and B. Biggio. Image spam filtering using textual and visual information. In MIT Spam Conference, Cambridge, MA, USA, 30 March 2007. [9] D. G. Pelli, C. W. Burns, B. Farell, and D. C. Moore-Page. Feature detection and letter identification. Vision Research, 46:4646–4674, 2006. [10] J. R. Quinlan. C4.5: programs for machine learning. Morgan Kaufmann Publishers Inc., San Francisco, CA, USA, 1993. [11] C.-T. Wu, K.-T. Cheng, Q. Zhu, and Y.-L. Wu. Using visual features for anti-spam filtering. In Proc. IEEE Int. Conf. on Image Processing, volume III, pages 501–504, 2005.
0.05
0.1 FN
0.15
0.2
0.2 dredze text fusion (feature level) fusion (score level)
0.18
[6] M. Dredze, R. Gevaryahu, and A. Elias-Bachrach. Learning fast classifiers for image spam. In Fourth Conference on Email and Anti-Spam (CEAS), Microsoft Research Silicon Valley, Mountain View, California, 2-3 August 2007.
0.16 0.14 0.12 FP
[7] G. Fumera, I. Pillai, and F. Roli. Spam filtering based on the analysis of text information embedded into images. Journal of Machine Learning Research (special issue on Machine Learning in Computer Security), 7:2699–2720, 2006.
0
0.1 0.08 0.06 0.04 0.02 0
0
0.05
0.1 FN
0.15
0.2
Figure 3: ROC curves (with standard deviation shown as dotted lines) obtained on the image corpus used in [6], with the features proposed either in [1] (top plot) and in [6], (bottom plot), denoted respectively as ‘Aradhye’ and ‘Drezde’, our features (denoted as ‘text’), and their feature and score level combination.
0.2
0.25
generic text fusion (feature level) fusion (score level)
0.18
aradhye text fusion (feature level) fusion (score level)
0.16 0.14
0.2
FP
FP
0.12
0.15
0.1 0.08 0.06
0.1
0.04 0.05
0.02 0
0
0
0.05
0.1
0.15 FN
0.2
0.25
0
0.05
0.1 FN
0.3
0.18 0.16
0.25
0.2
0.14 FP
0.12 FP
0.2
generic text fusion (feature level) fusion (score level)
0.2 dredze text fusion (feature level) fusion (score level)
0.15
0.15
0.1 0.08
0.1
0.06 0.05
0.04 0.02 0
0 0
0.05
0.1 FN
0.15
0.2
Figure 4: ROC curves (with standard deviation shown as dotted lines) obtained on the ham images used in [6] and on our spam images, with the features proposed either in [1] (top plot) and in [6] (bottom plot), our features, and their feature and score level combination. See caption of figure 3 for the notation.
0
0.05
0.1
0.15 FN
0.2
0.25
0.3
Figure 5: ROC curves (with standard deviation shown as dotted lines) obtained on the data set used in [6] (top) and on the data set made up of ham images used in the same work and our spam images (bottom). The features are the “generic” ones described in this section, the ones described in section 3, and their feature and score level combination. See caption of figure 3 for the notation.