The technology described in the present paper is currently being transferred to Qualcomm Inc. The other applications that we would like to mention, namely ...
1
Sparse Sampling of Signal Innovations: Theory, Algorithms and Performance Bounds Thierry Blua , Pier-Luigi Dragottib, Martin Vetterlic , Pina Marzilianod and Lionel Coulotc a c
Chinese University of Hong Kong; b Imperial College, London;
EPFL, Lausanne; d Nanyang Technological University, Singapore.
I NTRODUCTION Signal acquisition and reconstruction is at the heart of signal processing, and sampling theorems provide the bridge between the continuous and the discrete-time worlds. The most celebrated and widely used sampling theorem is often attributed to Shannon1 , and gives a sufficient condition, namely bandlimitedness, for an exact sampling and interpolation formula. The sampling rate, at twice the maximum frequency present in the signal, is usually called the Nyquist rate. Bandlimitedness is however not necessary, as is well known but only rarely taken advantage of [1]. In this broader, non-bandlimited view, the question is: when can we acquire a signal using a sampling kernel followed by uniform sampling and perfectly reconstruct it? The Shannon case is a particular example, where any signal from the subspace of bandlimited signals denoted by BL, can be acquired through sampling and perfectly interpolated from the samples. Using the sinc kernel, or ideal lowpass filter, non-bandlimited signals will be projected onto the subspace BL. The question is: can we beat Shannon at this game, namely, acquire signals from outside of BL and still perfectly reconstruct? An obvious case is bandpass sampling and variations thereof. Less obvious are sampling schemes taking advantage of some sort of sparsity in the signal, and this is the central theme of the present paper. That is, instead of generic bandlimited signals, we consider the sampling of classes of non-bandlimited parametric signals. This allows us to circumvent Nyquist and perfectly sample and reconstruct signals using sparse sampling, at a rate characterized by how sparse they are per unit of time. In some sense, we sample at the rate of innovation of the signal by complying with Occam’s razor2 principle. 1 2
and many others, from Whittaker to Kotel’nikov and Nyquist, to name a few. Known as Lex Parcimoniæ or “Law of Parsimony”: Entia non svnt mvltiplicanda præter necessitatem, or, “Entities
should not be multiplied beyond necessity” (Wikipedia).
2
Besides Shannon’s sampling theorem, a second basic result that permeates signal processing is certainly Heisenberg’s uncertainty principle, which suggests that a singular event in the frequency domain will be necessarily widely spread in the time domain. A superficial interpretation might lead one to believe that a perfect frequency localization requires a very long time observation. That this is not necessary is demonstrated by high resolution spectral analysis methods, which achieve very precise frequency localization using finite observation windows [2], [3]. The way around Heisenberg resides in a parametric approach, where the prior that the signal is a linear combination of sinusoids is put to contribution. If by now you feel uneasy about slaloming around Nyquist, Shannon and Heisenberg, do not worry. Estimation of sparse data is a classic problem in signal processing and communications, from estimating sinusoids in noise, to locating errors in digital transmissions. Thus, there is a wide variety of available techniques and algorithms. Also, the best possible performance is given by the Cram´er-Rao lower bounds for this parametric estimation problem, and one can thus check how close to optimal a solution actually is. We are thus ready to pose the basic questions of this paper. Assume a sparse signal (be it in continuous or discrete time) observed through a sampling device, that is a smoothing kernel followed by regular or uniform sampling. What is the minimum sampling rate (as opposed to Nyquist’s rate, which is often infinite in cases of interest) that allows to recover the signal? What classes of sparse signals are possible? What are good observation kernels, and what are efficient and stable recovery algorithms? How does observation noise influence recovery, and what algorithms will approach optimal performance? How will these new techniques impact practical applications, from inverse problems to wideband communications? And finally, what is the relationship between the presented methods and classic methods as well as the recent advances in compressed sensing and sampling? Signals with Finite Rate of Innovation Using the sinc kernel (defined as sinc t = sin πt/πt), a signal x(t) bandlimited to [−B/2, B/2] can be expressed as x(t) =
X k∈Z
xk sinc(Bt − k),
(1)
where xk = hB sinc(Bt−k), x(t)i = x(k/B), as stated by C. Shannon in his classic 1948 paper [4].
3
Alternatively, we can say that x(t) has B degrees of freedom per second, since x(t) is exactly defined by a sequence of real numbers {xk }k∈Z , spaced T = 1/B seconds apart. It is natural to call this the rate of innovation of the bandlimited process, denoted by ρ, and equal to B. A generalization of the space of bandlimited signals is the space of shift-invariant signals. Given a basis function ϕ(t) that is orthogonal to its shifts by multiples of T , or hϕ(t − kT ), ϕ(t − k′ T )i = δk−k′ , the space of functions obtained by replacing sinc with ϕ in (1) defines a shift-invariant space S. For such functions, the rate of innovation is again equal to ρ = 1/T . Now, let us turn our attention to a generic sparse source, namely a Poisson process, which is a P set of Dirac pulses, k∈Z δ(t − tk ), where tk − tk−1 is exponentially distributed with p.d.f. λe−λt .
Here, the innovations are the set of positions {tk }k∈Z . Thus, the rate of innovation is the average
number of Diracs per unit of time: ρ = limT →∞ CT /T , where CT is the number of Diracs in the interval [−T /2, T /2]. This parallels the notion of information rate of a source based on the average entropy per unit of time introduced by Shannon in the same 1948 paper. In the Poisson case with decay rate λ, the average delay between two Diracs is 1/λ; thus, the rate of innovation ρ is equal to λ. A generalization involves weighted Diracs, or x(t) =
X k∈Z
xk δ(t − tk ).
By similar arguments, ρ = 2λ in this case, since both positions and weights are degrees of freedom. Note that this class of signals is not a subspace, and its estimation is a non-linear problem. Now comes the obvious question: is there a sampling theorem for the type of sparse processes just seen? That is, can we acquire such a process by taking about ρ samples per unit of time, and perfectly reconstruct the original process, just as the Shannon sampling procedure does. The necessary sampling rate is clearly ρ, the rate of innovation. To show that it is sufficient can be done in a number of cases of interest. The archetypal sparse signal is the sum of Diracs, observed through a suitable sampling kernel. In this case, sampling theorems at the rate of innovation can be proven. Beyond the question of a representation theorem, we also derive efficient computational procedures, showing the practicality of the approach. Next comes the question of robustness to noise and optimal estimation procedures under these conditions. We propose algorithms to estimate sparse signals in noise that achieve performance close to optimal. This is done by computing
4
Cram´er-Rao bounds that indicate the best performance of an unbiased estimation of the innovation parameters. Note that, when the Signal-to-Noise ratio is poor, the algorithms are iterative, and thus trade computational complexity for estimation performance. In order for the reader to easily navigate through the paper, we have collected in Table I the most frequent notations that will be used in the sequel.
I. S AMPLING S IGNALS
AT THEIR
R ATE
OF I NNOVATION
We consider a τ -periodic stream of K Diracs with amplitudes xk located at times tk ∈ [0, τ [: x(t) =
K X X
k=1 k ′ ∈Z
xk δ(t − tk − k′ τ ).
(2)
We assume that the signal x(t) is convolved with a sinc-window of bandwidth B, where Bτ is an odd integer3 , and is uniformly sampled with sampling period T = τ /N . We therefore want to retrieve the innovations xk and tk from the n = 1, 2, . . . , N measurements yn = h x(t), sinc(B(nT − t)) i = where
ϕ(t) =
X
k ′ ∈Z
K X k=1
sinc(B(t − k′ τ )) =
xk ϕ(nT − tk ),
sin(πBt) Bτ sin(πt/τ )
(3)
(4)
is the τ -periodic sinc function or Dirichlet kernel. Clearly, x(t) has a rate of innovation ρ = 2K/τ and we aim to devise a sampling scheme that is able to retrieve the innovations of x(t) by operating at a sampling rate that is as close as possible to ρ. Since x(t) is periodic, we can use the Fourier series to represent it. By expressing the Fourier series coefficients of x(t) we thus have x(t) =
X
x ˆm ej2πmt/τ ,
m∈Z
where
x ˆm =
K 1X k /τ xk |e−j2πmt {z } . τ m k=1
(5)
uk
We observe that the signal x(t) is completely determined by the knowledge of the K amplitudes xk and the K locations tk , or equivalently, uk . By considering 2K contiguous values of x ˆm in (5), we can build a system of 2K equations in 2K unknowns that is linear in the weights xk , but is highly 3
We will use this hypothesis throughout the paper in order to simplify the expressions and because it allows convergence
of the τ -periodized sum of sinc-kernels.
5
nonlinear in the locations tk and therefore cannot be solved using classical linear algebra. Such a system, however, admits a unique solution when the Diracs locations are distinct, which is obtained by using a method known in spectral estimation as Prony’s method [5], [6], [2], [3], and which we choose to call the annihilating filter method for the reason clarified below. Call {hk }k=0,1,...,K the filter coefficients with z-transform H(z) =
K X
hk z −k =
k=0
K Y
(1 − uk z −1 ).
(6)
k=1
That is, the roots of H(z) correspond to the locations uk = e−j2πtk /τ . It clearly follows that hm ∗ x ˆm =
K X k=0
hk x ˆm−k =
K K X K K X X xk′ xk′ m X hk uk−k hk um−k = u ′ ′ = 0. ′ k k τ τ k=0 k ′ =1 k=0 k ′ =1 | {z }
(7)
H(uk′ )=0
The filter hm is thus called annihilating filter since it annihilates the discrete signal x ˆm . The zeros of this filter uniquely define the locations tk of the Diracs. Since h0 = 1, the filter coefficients hm are found from (7) by involving at least 2K consecutive values of x ˆm , leading to a linear system of equations; e.g., if we have x ˆm for m = −K, −K + 1, . . . , K − 1, this system can be written in square Toeplitz matrix form as follows ˆ−1 x ˆ−2 · · · x ˆ−K x ˆ0 x ˆ−1 · · · x ˆ−K+1 x . .. .. .. .. . . . x ˆK−2 x ˆK−3 · · · x ˆ−1
h1 ˆ0 x h2 ˆ1 x = − . .. .. . hK x ˆK−1
.
(8)
If the xk ’s do not vanish, this K × K system of equations has a unique solution because any
hm satisfying it is also such that H(uk ) = 0 for k = 1, 2, . . . K. Given the filter coefficients hm , the locations tk are retrieved from the zeros uk of the z-transform in (6). The weights xk are then obtained by considering, for instance, K consecutive Fourier-series coefficients as given in (5). By writing the expression of these K coefficients in vector form, we obtain a Vandermonde system of equations which yields a unique solution for the weights xk since the uk ’s are distinct. Notice that we need in total no more than 2K consecutive coefficients x ˆm to solve both the Toeplitz system (8) and the Vandermonde system. This confirms our original intuition that the knowledge of only 2K Fourier-series coefficients is sufficient to retrieve x(t).
6
We are now close to solve our original sampling question, the only remaining issue is to find a way to relate the Fourier-series coefficients x ˆm to the actual measurements yn . Assume N ≥ Bτ then, for n = 1, 2, ..., N , we have that yn = hx(t), sinc(Bt − n)i =
X
Tx ˆm ej2πmn/N .
(9)
|m|≤⌊Bτ /2⌋
Up to a factor N T = τ , this is simply the inverse Discrete Fourier Transform (DFT) of a discrete signal bandlimited to [−⌊Bτ /2⌋, ⌊Bτ /2⌋] and which coincides with x ˆm in this bandwidth. As a consequence, the discrete Fourier coefficients of yn provide Bτ consecutive coefficients of the Fourier series of x(t) according to yˆm =
N X
yn e−j2πmn/N =
n=1
(
τx ˆm
if |m| ≤ ⌊Bτ /2⌋
0
for other m ∈ [−N/2, N/2].
(10)
Let us now analyse the complete retrieval scheme more precisely and draw some conclusions. First of all, since we need at least 2K consecutive coefficients x ˆm to use the annihilating filter method, this means that Bτ ≥ 2K. Thus, the bandwidth of the sinc-kernel, B, is always larger than 2K/τ = ρ, the rate of innovation. However, since Bτ is odd, the minimum number of samples per period is actually one sample larger: N ≥ Bmin τ = 2K + 1 which is the next best thing to critical sampling. Moreover, the reconstruction algorithm is fast and does not involve any iterative procedures. Typically, the only step that depends on the number of samples, N , is the computation of the DFT coefficients of the samples yn , which can of course be implemented in O(N log2 N ) elementary operations using the FFT algorithm. All the other steps of the algorithm (in particular, polynomial rooting) depend on K only; i.e., on the rate of innovation ρ. More on annihilation: A closer look at (7) indicates that any non-trivial filter {hk }k=0,1,...,L where L ≥ K that has uk = e−j2πtk /τ as zeros will annihilate the Fourier series coefficients of x(t). The converse is true: any filter with transfer function H(z) that annihilates the x ˆm is automatically such that H(uk ) = 0 for k = 1, 2, . . . , K. Taking (10) into account, this means that for such filters L X k=0
hk yˆm−k = 0,
for all |m| ≤ ⌊Bτ /2⌋.
(11)
7
These linear equations can be expressed using a matrix formalism: let A be the Toeplitz matrix L + 1 columns
2M − L + 1 rows
A =
z }| { yˆ yˆ−M +L−1 · · · yˆ−M −M +L yˆ−M +L+1 yˆ−M +L · · · yˆ−M +1 . . .. yˆ−M +L+2 yˆ−M +L+1 . . .. .. .. . . y ˆ . −M +L . . . . . . . . . . . . yˆM yˆM −1 · · · yˆM −L
where M = ⌊Bτ /2⌋,
(12)
and H = [h0 , h1 , . . . , hL ]T the vector containing the coefficients of the annihilating filter, then (11) is equivalent to AH = 0,
(13)
which can be seen as a rectangular extension of (8). Note that, unlike (6), H is not restricted to satisfy h0 = 1. Now, if we choose L > K, there are L − K + 1 independent polynomials of degree L with zeros at {uk }k=1,2,...,K , which means that there are L − K + 1 independent vectors H which satisfy (13). As a consequence, the rank of the matrix A does never exceed K. This provides a simple way to determine K when it is not known a priori: find the smallest L such that the matrix A built according to (12) is singular, then K = L − 1. The annihilation property (11) satisfied by the DFT coefficients yˆm is narrowly linked to the periodized sinc-Dirichlet window used prior to sampling. Importantly, this approach can be generalized to other kernels such as the (non-periodized) sinc, the Gaussian windows [7], and more recently any window that satisfies a Strang-Fix like condition [8]. II. FRI S IGNALS
WITH
N OISE
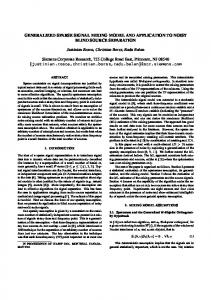
“Noise”, or more generally model mismatch are unfortunately omnipresent in data acquisition, making the solution presented in the previous section only ideal. Schematically, perturbations to the FRI model may arise both in the analog domain during, e.g., a transmission procedure, and in the digital domain after sampling (see Fig. 1)—in this respect, quantization is a source of corruption as well. There is then no other option but to increase the sampling rate in order to achieve robustness against noise.
8
Thus, we consider the signal resulting from the convolution of the τ -periodic FRI signal (2) and a sinc-window of bandwidth B, where Bτ is an odd integer. Due to noise corruption, (3) becomes yn =
K X k=1
xk ϕ(nT − tk ) + εn
for n = 1, 2, . . . , N,
(14)
where T = τ /N and ϕ(t) is the Dirichlet kernel (4). Given that the rate of innovation of the signal is ρ, we will consider N > ρτ samples to fight the perturbation εn , making the data redundant by a factor of N/(ρτ ). At this point, we do not make specific assumptions—in particular, of statistical nature—on εn . What kind of algorithms can be applied to efficiently exploit this extra redundancy and what is their performance? A related problem has already been encountered decades ago by researchers in spectral analysis where the problem of finding sinusoids in noise is classic [9]. Thus we will not try to propose new approaches regarding the algorithms. One of the difficulties is that there is as yet no unanimously agreed optimal algorithm for retrieving sinusoids in noise, although there has been numerous evaluations of the different methods (see e.g. [10]). For this reason, our choice falls on the the simplest approach, the Total Least-Squares approximation (implemented using a Singular Value Decomposition, an approach initiated by Pisarenko in [11]), possibly enhanced by an initial “denoising” (more exactly: “model matching”) step provided by what we call Cadzow’s iterated algorithm [12]. The full algorithm, depicted in Fig. 2, is also detailed in its two main components in Inserts 1 and 2. By computing the theoretical minimal uncertainties known as Cram´er-Rao bounds on the innovation parameters, we will see that these algorithms exhibit a quasi-optimal behavior down to noise levels of the order of 5 dB (depending on the number of samples). In particular, these bounds tell us how to choose the bandwidth of the sampling filter.
A. Total least-squares approach In the presence of noise, the annihilation equation (13) equation is not satisfied exactly, yet it is still reasonable to expect that the minimization of the Euclidian norm kAHk2 under the constraint that kHk2 = 1 may yield an interesting estimate of H. Of particular interest is the solution for L = K—annihilating filter of minimal size—because the K zeros of the resulting filter provide a unique estimation of the K locations tk . It is known that this minimization can be solved by performing a
9
singular value decomposition of A as defined by (12)—more exactly: an eigenvalue decomposition of the matrix ATA—and choosing for H the eigenvector corresponding to the smallest eigenvalue. More specifically, if A = USVT where U is a (Bτ − K) × (K + 1) unitary matrix, S is a (K + 1)× (K + 1) diagonal matrix with decreasing positive elements, and V is a (K + 1)× (K + 1) unitary matrix, then H is the last column of V. Once the tk are retrieved, the xk follow from a least mean square minimization of the difference between the samples yn and the FRI model (14). This approach, summarized in Insert 1, is closely related to Pisarenko’s method [11]. Although its cost is much larger than the simple solution of Section I, it is still essentially linear with N (excluding the cost of the initial DFT)
B. Extra denoising: Cadzow The previous algorithm works quite well for moderate values of the noise—a level that depends on the number of Diracs. However, for small SNR, the results may become unreliable and it is advisable to apply a robust procedure that “projects” the noisy samples onto the sampled FRI model of (14). This iterative procedure was already suggested by Tufts and Kumaresan in [13] and analyzed in [12]. As noticed in Section I, the noiseless matrix A in (12) is of rank K whenever L ≥ K. The idea consists thus in performing the SVD of A, say A = USVT, and forcing to zero the L + 1 − K smallest diagonal coefficients of the matrix S to yield S′ . The resulting matrix A′ = US′ VT is not Toeplitz anymore but its best Toeplitz approximation is obtained by averaging the diagonals of A′ . This leads to a new “denoised” sequence yˆn′ that matches the noiseless FRI sample model better than the original yˆn ’s. A few of these iterations lead to samples that can be expressed almost exactly as bandlimited samples of an FRI signal. Our observation is that this FRI signal is all the closest to the noiseless one as A is closer to a square matrix, i.e., L = ⌊Bτ /2⌋. The computational cost of this algorithm, summarized in Insert 2, is higher than the annihilating filter method since it requires performing the SVD of a square matrix of large size, typically half the number of samples. However, using modern computers we can expect to perform the SVD of a square matrix with a few hundred columns in less than a second. We show in Fig. 3 an example of FRI signal reconstruction having 7 Diracs whose 71 samples are buried in a noise with 5 dB SNR power (redundancy ≈ 5): the total computation time is 0.9 second on a PowerMacintosh G5
10
at 1.8 GHz. Another more striking example is shown in Fig. 4 where we use 1001 noisy (SNR = 20 dB) samples to reconstruct 100 Diracs (redundancy ≈ 5): the total computation time is 61 seconds. Although it is not easy to check on a crowded graph, all the Dirac locations have been retrieved very precisely, while a few amplitudes are wrong. The fact that the Diracs are sufficiently far apart (≥ 2/N ) ensures the stability of the retrieval of the Dirac locations.
C. Cram´er-Rao Bounds The sensitivity of the FRI model to noise can be evaluated theoretically by choosing a statistical model for this perturbation. The result is that any unbiased algorithm able to retrieve the innovations of the FRI signal from its noisy samples exhibits a covariance matrix that is lower bounded by Cram´er-Rao Bounds (see Appendix III-B). As can be seen in Fig. 5, the retrieval of an FRI signal made of two Diracs is almost optimal for SNR levels above 5 dB since the uncertainty on these locations reaches the (unbiased) theoretical minimum given by Cram´er-Rao bounds. Such a property has already been observed for high-resolution spectral algorithms (and notably, those using a maximum likelihood approach) by Tufts and Kumaresan [13]. It is particularly instructive to make the explicit computation for signals that have exactly two innovations per period τ , and where the samples are corrupted with a white Gaussian noise. The results, which involve the same arguments as in [14], are given in Insert 3 and essentially state that √ the uncertainty on the location of the Dirac is proportional to 1/ N Bτ when the sampling noise is dominant (white noise case), and to 1/(Bτ ) when the transmission noise is dominant (ϕ(t)-filtered white noise). In both cases, it appears that it is better to maximize the bandwidth B of the sinc-kernel in order to minimize the uncertainty on the location of the Dirac. A closer inspection of the white noise case shows that the improved time resolution is obtained at the cost of a loss of amplitude √ accuracy by a Bτ factor. When K ≥ 2, the Cram´er-Rao formula for one Dirac still holds approximately when the locations are sufficiently far apart. Empirically, if the minimal difference (modulo τ ) between two of the Dirac locations is larger than, say, 2/N , then the maximal (Cram´er-Rao) uncertainty on the retrieval of these locations is obtained using the formula given in Insert 3.
11
III. D ISCUSSION A. Applications Let us turn to applications of the methods developed so far. The key feature to look for is sparsity, together with a good model of the acquisition process and of the noise present in the system. For a real application, this means a thorough understanding of the set up and of the physics involved (remember that we assume a continuous-time problem, and we do not start from a set of samples or a finite vector). One main application to use the theory presented in this paper is ultra-wide band (UWB) communications. This communication method uses pulse position modulation (PPM) with very wideband pulses (up to several gigahertz of bandwidth). Designing a digital receiver using conventional sampling theory would require analog-to-digital conversion (ADC) running at over 5 GHz, which would be very expensive and power consumption intensive. A simple model of an UWB pulse is a Dirac convolved with a wideband, zero mean pulse. At the receiver, the signal is the convolution of the original pulse with the channel impulse response, which includes many reflections, and all this buried in high levels of noise. Initial work on UWB using an FRI framework was presented in [15]. The technology described in the present paper is currently being transferred to Qualcomm Inc. The other applications that we would like to mention, namely Electro-EncephaloGraphy (EEG) and Optical Coherence Tomography (OCT), use other kernels than the Dirichlet window, and as such, require a slight adaptation to what has been presented here. EEG measurements during neuronal events like epileptic seizures can be modelled reasonably well by a FRI excitation to a Poisson equation and it turns out that these measurements satisfy an annihilation property [16]. Obviously, accurate localization of the activation loci is important for the surgical treatment of such impairment. In OCT, the measured signal can be expressed as a convolution between the (low-)coherence function of the sensing laser beam (typically, a Gabor function which satisfies an annihilation property), and a FRI signal whose innovations are the locations of refractive index changes and their range, within the object imaged [17]. Depending on the noise level and the model adequacy, the annihilation technique allows to reach a resolution that is potentially well-below the “physical”
12
resolution implied by the coherence length of the laser beam.
B. Relation with compressed sensing One may wonder whether the approach described here could be addressed using compressed sensing tools developed in [18], [19]. Obviously, FRI signals can be seen as “sparse” in the time domain. However, differently from the compressed sensing framework, this domain is not discrete: the innovation times may assume arbitrary real values. Yet, assuming that these innovations fall on some discrete grid {θn′ }n′ =0,1,...,(N ′ −1) known a priori, one may try to address our FRI interpolation problem as min
x′0 ,x′1 ,...,x′N ′ −1
′ −1 NX
n′ =0
|x′n′ |
′ −1 N N 2 X X x′n′ ϕ(nT − θn′ ) ≤ N σ 2 , under the constraint yn −
n=1
(15)
n′ =0
where σ 2 is an estimate of the noise power.
In the absence of noise, it has been shown that this minimization provides the parameters of the innovation, with “overwhelming” probability [19] using O(K log N ′ ) measurements. Yet, this method is not as direct as the annihilating filter method which does not require any iteration. Moreover, the compressed-sensing approach does not reach the critical sampling rate, unlike the method proposed here which almost achieves this goal (2K + 1 samples for 2K innovations). On the other hand, compressed sensing is not limited to uniform measurements of the form (14), and could potentially accommodate arbitrary sampling kernels—and not only the few ones that satisfy an annihilation property. This flexibility is certainly an attractive feature of compressed sensing. In the presence of noise, the beneficial contribution of the ℓ1 norm is less obvious since the quadratic program (15) does not provide an exactly K-sparse solution anymore—although ℓ1 /ℓ2 stable recovery of the x′k′ is statistically guaranteed [20]. Moreover, unlike the method we are proposing here which is able to reach the Cram´er-Rao lower bounds (computed in Appendix III-B), there is no evidence that the ℓ1 strategy may share this optimal behavior. In particular, it is of interest to note that, in practice, the compressed sensing strategy involves random measurement selection, whereas arguments obtained from Cram´er-Rao bounds computation—namely, on the optimal bandwidth of the sinc-kernel—indicate that, on the contrary, it might be worth optimizing the sensing matrix.
13
C ONCLUSION Sparse sampling of continuous-time sparse signals has been addressed. In particular, it was shown that sampling at the rate of innovation is possible, in some sense applying Occam’s razor to the sampling of sparse signals. The noisy case has been analyzed and solved, proposing methods reaching the optimal performance given by the Cram´er-Rao bounds. Finally, a number of applications have been discussed where sparsity can be taken advantage of. The comprehensive coverage given in this paper should lead to further research in sparse sampling, as well as new applications. A PPENDIX : C RAM E´ R -R AO L OWER B OUNDS We are considering noisy real measurements Y = [y1 , y2 , . . . yN ] of the form yn =
K X k=1
xk ϕ(nT − tk ) + εn
where εn is a zero-mean Gaussian noise of covariance R; usually the noise is assumed to be stationary: [R]n,n′ = rn−n′ where rn = E {εn′ +n εn′ }. Then any unbiased estimate Θ(Y) of the unknown parameters [x1 , x2 , . . . , xK ]T and [t1 , t2 , . . . tK ]T has a covariance matrix that is lower-bounded by the inverse of the Fisher information matrix (adaptation of [21, eqn. (6)]) � �−1 cov{Θ} ≥ ΦTR−1 Φ ,
where
−x1 ϕ′ (T − t1 ) · · · −xK ϕ′ (T − tK ) ϕ(T − t1 ) · · · ϕ(T − tK ) ϕ(2T − t1 ) · · · ϕ(2T − tK ) −x1 ϕ′ (2T − t1 ) · · · −xK ϕ′ (2T − tK ) Φ= .. .. .. .. . . . . ϕ(N T − t1 ) · · · ϕ(N T − tK ) −x1 ϕ′ (N T − t1 ) · · · −xK ϕ′ (N T − tK )
Note that this expression holds quite in general: it does not require that ϕ(t) be periodic or bandlimited, and the noise does not need to be stationary. One-Dirac periodized sinc case—If we make the hypothesis that εn is N -periodic and ϕ(t) is the Dirichlet kernel (4), then the 2 × 2 Fisher matrix becomes diagonal. The minimal uncertainties on the location of one Dirac, ∆t1 , and on its amplitude, ∆x1 , are then given by: !−1/2 !−1/2 X X ∆t1 m2 1 Bτ Bτ √ ≥ and ∆x1 ≥ √ . τ N |m|≤⌊Bτ /2⌋ rˆm 2π|x1 | N |m|≤⌊Bτ /2⌋ rˆm
.
14
Insert 1—Annihilating filter: total least-squares method An algorithm for retrieving the innovations xk and tk from the noisy samples of (14). XN 1) Compute the N -DFT coefficients of the samples yˆm = yn e−j2πnm/N ; n=1
2) Choose L = K and build the rectangular Toeplitz matrix A according to (12);
3) Perform the singular value decomposition of A and choose the eigenvector [h0 , h1 , . . . , hK ]T corresponding to the smallest eigenvalue—i.e., the annihilating filter coefficients; P −k and deduce {t } 4) Compute the roots e−j2πtk /τ of the z-transform H(z) = K k k=1,...,K ; k=0 hk z P 5) Compute the least mean square solution xk of the N equations {yn − k xk ϕ(nT −tk )}n=1,2,...N .
When the measures yn are very noisy, it is necessary to first denoise them by performing a few iterations of Cadzow’s algorithm (see Insert 2), before applying the above procedure. Insert 2—Cadzow’s iterative denoising Algorithm for “denoising” the samples yn of Insert 1. 1) Compute the N -DFT coefficients of the samples yˆm =
XN
n=1
yn e−j2πnm/N ;
2) Choose an integer L in [K, Bτ /2] and build the rectangular Toeplitz matrix A according to (12); 3) Perform the singular value decomposition of A = USVT where U is a (2M −L+1)×(L+1) unitary matrix, S is a diagonal (L + 1) × (L + 1) matrix, and V is a (L + 1) × (L + 1) unitary matrix; 4) Build the diagonal matrix S′ from S by keeping only the K most significant diagonal elements, and deduce the total least-squares approximation of A by A′ = US′ VT; 5) Build a denoised approximation yˆn′ of yˆn by averaging the diagonals of the matrix A′ ; 6) Iterate step 2 until, e.g., the (K + 1)th largest diagonal element of S is smaller than the K th largest diagonal element by some pre-requisite factor; The number of iterations needed is usually small (less than 10). Note that, experimentally, the best choice for L in step 2 is L = M . Insert 3—Uncertainty relation for the one-Dirac case We consider the FRI problem of finding [x1 , t1 ] from the N noisy measurements [y1 , y2 , . . . , yN ] yn = µn + εn
with
µn = x1 ϕ(nτ /N − t1 )
15
where ϕ(t) is the τ -periodic, B-bandlimited Dirichlet kernel and εn is a stationary Gaussian noise. Any unbiased algorithm that estimates t1 and x1 will do so up to an error quantified by their standard deviation ∆t1 and ∆x1 , lower bounded by Cram´er-Rao formulæ (see Appendix III-B). Denoting the noise power by σ 2 and the Peak Signal-to-Noise Ratio by PSNR = |x1 |2 /σ 2 , two cases are especially interesting: •
The noise is white, i.e., its power spectrum density is constant and equals σ 2 . Then we find s r ∆t1 1 ∆x1 3Bτ Bτ −1/2 ≥ · PSNR and ≥ · PSNR−1/2 . 2 2 τ π N (B τ − 1) |x1 | N
•
The noise is a white noise filtered by ϕ(t), then we find ∆t1 1 ≥ τ π
r
3 B 2τ 2
−1
· PSNR−1/2
and
∆x1 ≥ PSNR−1/2 . |x1 |
In both configurations, we conclude that, in order to minimize the uncertainty on t1 , it is better to maximize the bandwidth of the Dirichlet kernel, i.e., choose B such that Bτ = N if N is odd, or such that Bτ = N − 1 if N is even. Since Bτ ≤ N we always have the following uncertainty relation 1/2
N · PSNR
√ ∆t1 3 · ≥ , τ π
involving the number of measurements, N , the end noise level and the uncertainty on the position.
R EFERENCES [1] M. Unser, “Sampling—50 Years after Shannon,” Proc. IEEE, vol. 88, pp. 569–587, Apr. 2000. [2] S. M. Kay, Modern Spectral Estimation—Theory and Application. Englewood Cliffs, NJ: Prentice Hall, 1988. [3] P. Stoica and R. L. Moses, Introduction to Spectral Analysis. Upper Saddle River, NJ: Prentice Hall, 1997. [4] C. E. Shannon, “A mathematical theory of communication,” Bell Sys. Tech. J., vol. 27, pp. 379–423 and 623–656, Jul. and Oct. 1948. ´ [5] R. Prony, “Essai exp´erimental et analytique,” Ann. Ecole Polytechnique, vol. 1, no. 2, p. 24, 1795. [6] S. M. Kay and S. L. Marple, “Spectrum analysis—a modern perspective,” Proc. IEEE, vol. 69, pp. 1380– 1419, Nov. 1981.
16
[7] M. Vetterli, P. Marziliano, and T. Blu, “Sampling signals with finite rate of innovation,” IEEE Trans. Sig. Proc., vol. 50, pp. 1417–1428, June 2002. [8] P.-L. Dragotti, M. Vetterli, and T. Blu, “Sampling moments and reconstructing signals of finite rate of innovation: Shannon meets Strang-Fix,” IEEE Trans. Sig. Proc., vol. 55, pp. 1741–1757, May 2007. [9] Special Issue on Spectral Estimation, Proc. IEEE, vol. 70, Sept. 1982. [10] H. Clergeot, S. Tressens, and A. Ouamri, “Performance of high resolution frequencies estimation methods compared to the Cram´er-Rao bounds,” IEEE Trans. ASSP, vol. 37, pp. 1703–1720, Nov. 1989. [11] V. F. Pisarenko, “The retrieval of harmonics from a covariance function,” Geophys. J., vol. 33, pp. 347– 366, Sept. 1973. [12] J. A. Cadzow, “Signal enhancement—A composite property mapping algorithm,” IEEE Trans. ASSP, vol. 36, pp. 49–62, Jan. 1988. [13] D. W. Tufts and R. Kumaresan, “Estimation of frequencies of multiple sinusoids: Making linear prediction perform like maximum likelihood,” Proc. IEEE, vol. 70, pp. 975–989, Sept. 1982. [14] P. Stoica and A. Nehorai, “MUSIC, maximum likelihood, and Cram´er-Rao bound,” IEEE Trans. ASSP, vol. 37, pp. 720–741, May 1989. [15] I. Maravi´c, J. Kusuma, and M. Vetterli, “Low-sampling rate UWB channel characterization and synchronization,” J. of Comm. and Netw., vol. 5, no. 4, pp. 319–327, 2003. [16] D. Kandaswamy, T. Blu, and D. Van De Ville, “Analytic sensing: reconstructing pointwise sources from boundary Laplace measurements,” in Proc. SPIE—Wavelet XII, (San Diego CA, USA), Aug. 26-Aug. 30, 2007. To appear. [17] T. Blu, H. Bay, and M. Unser, “A new high-resolution processing method for the deconvolution of optical coherence tomography signals,” in Proc. ISBI’02, vol. III, (Washington DC, USA), pp. 777– 780, Jul. 7-10, 2002. [18] D. L. Donoho, “Compressed sensing,” IEEE Trans. Inf. Th., vol. 52, pp. 1289–1306, April 2006. [19] E. J. Cand`es, J. K. Romberg, and T. Tao, “Robust uncertainty principles: exact signal reconstruction from highly incomplete frequency information,” IEEE Trans. Inf. Th., vol. 52, pp. 489–509, Feb. 2006. [20] E. J. Cand`es, J. K. Romberg, and T. Tao, “Stable signal recovery from incomplete and inaccurate measurements,” Comm. Pure Appl. Math., vol. 59, pp. 1207–1223, Mar. 2006. [21] B. Porat and B. Friedlander, “Computation of the exact information matrix of Gaussian time series with stationary random components,” IEEE Trans. ASSP, vol. 34, pp. 118–130, Feb. 1986.
17
TABLE I F REQUENTLY USED NOTATIONS
Symbol
Meaning
x(t), τ , x ˆm
τ -periodic Finite Rate of Innovation signal and its Fourier coefficients XK Innovation parameters: x(t) = xk δ(t − tk ), for t ∈ [0, τ [ k=1
K, tk , xk and ρ
and rate of innovation of the signal: ρ = 2K/τ
“Anti-aliasing” filter, prior to sampling: typically, ϕ(t) = sinc Bt
ϕ(t), B
Note: B × τ is restricted to be an odd integer (noisy) samples {yn }n=1,2,...,N of (ϕ ∗ x)(t)
yn , yˆm , N , T
at multiples of T = τ /N (see eqn. 14) and its DFT coefficients yˆm A, L
rectangular annihilation matrix with L + 1 columns (see eqn. 12)
H(z), hk and H
Annihilating filter: z-transform, impulse response and vector representation
analog noise
X
k
digital noise
sampling kernel T L y(t) �� ? W -
xk δ(t − tk ) -L ? - ϕ(t)
yn -
Fig. 1. Block diagram representation of the sampling of an FRI signal, with indications of potential noise perturbations in the analog, and in the digital part.
yn FFT
yˆn
yes � H �too H no ?-� H H noisy? � HH��
-
Annihilating Filter method
tk-
Fig. 2.
linear system
Cadzow �
- tk - xk
Schematical view of the FRI retrieval algorithm. The data are considered “too noisy” until they satisfy (11)
almost exactly.
18
Original and estimated signal innovations : SNR = 5 dB 1.6
Noiseless samples
original Diracs estimated Diracs
1.4
1 0.5
1.2
0 1
−0.5 0
0.8
0.2
0.4
0.6
0.8
1
0.8
1
Noisy samples : SNR = 5 dB
0.6 1
0.4
0.5
0.2
0 0 0
0.2
0.4
0.6
0.8
−0.5 0
1
0.2
0.4
0.6
Fig. 3. Retrieval of an FRI signal with 7 Diracs (left) from 71 noisy (SNR = 5 dB) samples (right). Original and estimated signal innovations : SNR = 20 dB
1001 samples : SNR = 20 dB
1.6
signal noise
1.4
1.4
1.2
1.2
1
1
0.8
0.8
0.6
0.6
0.4
0.4
0.2
0.2
0 0 −0.2
original 100 Diracs estimated Diracs
0
0.2
0.4
−0.2 0.6
0.8
−0.4 0
1
0.2
0.4
0.6
0.8
1
Fig. 4. Retrieval of an FRI signal with 100 Diracs (left) from 1001 noisy (SNR = 20 dB) samples (right). 2 Diracs / 21 noisy samples 1
10
−1
Positions
0.8
Positions
First Dirac
0
retrieved locations Cramér−Rao bounds
10
observed standard deviation Cramér−Rao bound
−3
10
−5
0.6
10 −10
0
10
30
40
50
20 30 input SNR (dB)
40
50
Second Dirac
0
0.4
20
10 Positions
−1
0.2
0 −10
10
−3
10
−5
0
10
20 30 input SNR (dB)
40
50
10 −10
0
10
Fig. 5. Retrieval of the locations of a FRI signal. Left: scatterplot of the locations; right: standard deviation (averages over 10000 realizations) compared to Cram´er-Rao lower bounds.