Spatial and Temporal Dynamics of Dengue Haemorrhagic Fever Epidemics, Nakhon Pathom Province, Thailand, 1997-2001 Wutjanun Muttitanon*, Pongpan Kongthong**, Chusak Kongkanon**, Sutee Yoksan***, Narong Nitatpattana***, Jean Paul Gonzalez‡ and Philippe Barbazan †# *Asian Journal of Geoinformatics; Space Technology Application and Research Program, Asian Institute of Technology. P.O. Box 4, Klong Luang, Pathumthani, Thailand **Department of Geography, Faculty of Education, Ramkhamhaeng University, Bangkok 10110, Thailand ***Center for Vaccine Development (CVD), Institute of Science and Technology for Research and Development, Mahidol University, Nakhon Pathom 73170, Thailand † Research Center for Emerging Viral Diseases (RCEVD) – IRD – Center for Vaccine Development, Institute of Science and Technology for Research and Development, Mahidol University, Nakhon Pathom 73170, Thailand ‡ Institut de Recherche pour le Développement (IRD) Ur034, 213 rue La Fayette, 75480, Paris cedex 10, France
Abstract Several environmental factors modulate the distribution of dengue fever (DF), such as climate, density of vector and human populations in urban areas and distribution of herd immunity. In order to identify geographical variables involved in the spread of a DHF process, a Geographic Information System (GIS) has been built to create links between geo-referenced data including medical records and socioeconomic and environmental data. Applied to a retrospective analytical study of DHF epidemics in Nakhon Pathom province 1 ( 997-2001), the GIS allowed a mapping of spatial variations of DHF incidence, the recognition of different temporal incidence patterns and the quantification of the dispersal of outbreaks among defined spatial units. The analysis showed that the diffusion process of these epidemics was of a contagious type as the distance between epidemic areas (sub-districts) was significantly lower than the average distance between every sub-district. This result indicates that these epidemics were likely to be due to the spread of a new or rare virus serotype, from its emergence location in the province to areas with a sufficient density of vectors and a similar limited immune protection against this serotype. Keywords: Dengue haemorrhagic fever, dengue virus, transmission, Geographic Information System, spatial analysis.
#
E-mail:
[email protected]; Tel./Fax: (66) 2 441 01 89
Dengue Bulletin – Vol 28, 2004
35
Spatial and Temporal Dynamics of DHF Epidemics in Thailand
Introduction Dengue fever (DF) is a viral disease with a worldwide distribution in all tropical areas. It is caused by the dengue virus (genus Flavivirus, family Flaviviridae) which presents four antigenic forms or serotypes: DEN -1, DEN-2, DEN -3 and DEN-4. In Thailand, Dengue haemorrhagic fever (DHF) a severe form of dengue fever has been endemic since 1958, with a cumulative total of 1,369,542 cases till date[1] . Epidemics occur with a periodicity of between two and four years; these epidemics are of significant concern for the public health authorities. In most of the areas where serotype identifications were performed, two or three serotypes were found to be co-circulating[2] . The dengue virus is an arbovirus (arthropod-borne virus) transmitted by the mosquito Aedes aegypti (L.). Control of the spread of the disease focuses on vector control strategies based mainly on the elimination of potential breeding sites[3] . A major attribute of the virus transmission is its anthropophilic behaviour, as females mainly bite humans and lay eggs in man-made containers near houses (for example, water jars, cans, used tyres). The short flight range of the vector, less than 1 km, contributes to the limited spread of the disease by an infected female. Most of the infections by dengue viruses are not severe and present asymptomatically, allowing infected patients to maintain normal activities. Two types of viral spread can be described: (i) the diffusion of human infections as a function of the spatial distribution of houses and the limited flight range of infectious or infected Aedes aegypti females (intra-communal, contagious/ continuous); and (ii) inter-communal
36
dispersion, largely a function of the stochastic movement of incubating/infectious humans and the transport via vehicles of virus-positive females[4]. The understanding of the mechanism of the inter-community spread of DHF during epidemic periods is a primary factor likely to lead to an evaluation of the risk of virus transmission and disease dispersal[5] . Moreover, it would provide some guidance on the distance from the spatial origin of an epidemic at which preventive control measures should be applied. At a monthly time-scale, the main geographical factors involved in dengue transmission (urbanization, demography, cultural and social characteristics) are stable[6] . A change in the pattern of monthly DHF transmission, such as the emergence of epidemics in an endemic area, should then rather be related to factors evolving with time: climate, density of vectors, emergence of a new or rare virus serotype, each type of factor inducing a specific pattern of diffusion of the disease[7,8] . The emergence of a new serotype in a given population is likely to exhibit particular spatial characteristics. The outbreak would begin where the serotype first arrived and then move to places where a low specific herd immunity (towards this serotype) and a sufficient density of mosquito allow a high level of transmission. The spread of a new serotype is then likely to follow the main model of contagious diffusion described for the spread of other types of moving phenomena[9] . Applied to the diffusion of an infectious disease, it means that the probability for an area to be reached by a contagious disease will be inversely correlated to the distance to the formerly contaminated areas, leading to clusters of epidemic areas.
Dengue Bulletin – Vol 28, 2004
Spatial and Temporal Dynamics of DHF Epidemics in Thailand
In order to test the validity of this model in the frame of dengue dispersal, a study was conducted to describe the spread of significantly higher levels of incidence rate (of epidemic significance) among subdistricts. The study, done in a province of Thailand, covering the period 1997-2001, included two DHF epidemics.
Materials and methods Data collection Data on clinically diagnosed DHF cases were recorded at the Ministry of Public Health, the demographic data were provided by the Administrative Department of the Ministry of Interior, and the geographical maps by the Royal Thai Survey
Department. DHF cases were according to WHO criteria[10] .
defined
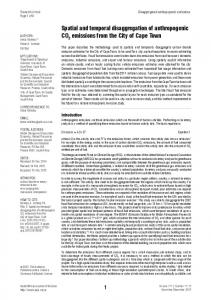
Population and study area Nakhon Pathom province is a part of the central plain region in Thailand encompassing the latitude of 13° 38’45.6” N to 14° 10’37.2” N and the longitude of 99° 51’10.8” E to 100° 17’6” E. It covers 2,164 sq km, has a population of 774,276 inhabitants and includes 7 districts and 106 sub-districts (Figure 1a). The population density ranges from 153 to 623 inhabitants/sq km. The average surface area of sub-districts is 20.4 sq. km. The provincial health department reported 14,079 DHF cases during 1983-2001; two DHF epidemics occurred in 1997-1998 and 2000-2001 (Figure 2).
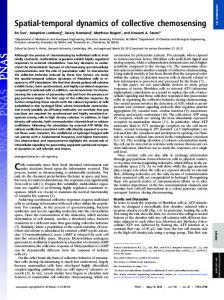
Figure 1. District scale approach: (i) Administrative limits of districts and sub-districts; density of population; main roads; (ii) Average incidence observed before the epidemics (cases/100,000 people), January 1992 – June 1997; (iii) Ratio of the incidence during the first three months of the DHF epidemic compared to the average incidence from January 1992 – June 1997
5
0
10
20 km
a) Density of population (inhabitants / ha)
Main roads
b) Average Incidence 01/1992 - 06/1997 (cases /100,000)
c) Ratio of Incidence 07 – 09 1997 vs aver. 01/1992 - 06/1997
> 600
22 - 46
1.6 – 2.8
Districts
350 - 450
8 - 10
1.3 – 1.4
Sub-districts
150 - 350
3-7
0.3 – 0.7
Dengue Bulletin – Vol 28, 2004
37
Spatial and Temporal Dynamics of DHF Epidemics in Thailand
Figure 2. Monthly DHF incidence in Nakhon Pathom province, Thailand, from January 1992 to August 2001 300
cases
200
100
0 1-92 7-92
1-93 7-93
1-94
7-94 1-95
7-95 1-96 7-96 1-97 7-97
1-98 7-98
1-99
7-99 1-00
7-00 1-01 7-01
month
Method of analysis The study aimed to describe the spatialtemporal dynamics at a monthly time-scale of a DHF epidemic among Nakhon Pathom’s 106 sub-districts considered as the spatial units. As a first step, epidemics were defined at the province level as periods of time (at least two consecutive months) when the incidence is higher than the average, plus one standard deviation of the monthly incidence of each month (i.e. January, February, etc.). The average was calculated over the entire 1983-2001 period[11] . During these epidemic months (EMs), epidemic sub-districts (ESDs) were those where the monthly incidence was significantly higher than in other sub-districts. The threshold for a significantly higher incidence was leveled at the average monthly incidence (per 100,000 inhabitants) plus one standard deviation, observed among every sub-district during that EM. 38
In a contagious model for an infectious disease, the spatial entities close to an infected one were assumed to be more at risk to become infected than the distant ones. Applied to the diffusion of an epidemic phenomenon, it meant that the distance between the new epidemic subdistricts and the former ones (observed distance) should be shorter than the average (expected) distance between all the subdistricts. The distance between sub-districts was defined as the Euclidian distance between their centroids. The expected distance was the average distance between each ESD and every other sub-district. The observed distance was the average distance between each ESD and every other ESD, during the same month (cluster study), or from one month to the next (spread study). H0 (null hypothesis) = the average observed distance (between ESD) was not different from the average expected distances. H1 = average observed