RESEARCH ARTICLE
Temporal Dynamics and Spatial Patterns of Aedes aegypti Breeding Sites, in the Context of a Dengue Control Program in Tartagal (Salta Province, Argentina) Manuel Espinosa1, Diego Weinberg1, Camilo H. Rotela2, Francisco Polop1, Marcelo Abril1, Carlos Marcelo Scavuzzo2*
a11111
1 Fundación Mundo Sano, Buenos Aires, Argentina, 2 Comisión Nacional de Actividades Espaciales, Falda del Carmen, Córdoba, Argentina *
[email protected]
Abstract OPEN ACCESS Citation: Espinosa M, Weinberg D, Rotela CH, Polop F, Abril M, Scavuzzo CM (2016) Temporal Dynamics and Spatial Patterns of Aedes aegypti Breeding Sites, in the Context of a Dengue Control Program in Tartagal (Salta Province, Argentina). PLoS Negl Trop Dis 10(5): e0004621. doi:10.1371/journal. pntd.0004621 Editor: Roberto Barrera, Centers for Disease Control and Prevention, Puerto Rico, UNITED STATES Received: December 22, 2015 Accepted: March 19, 2016 Published: May 25, 2016 Copyright: © 2016 Espinosa et al. This is an open access article distributed under the terms of the Creative Commons Attribution License, which permits unrestricted use, distribution, and reproduction in any medium, provided the original author and source are credited. Data Availability Statement: All relevant data are within the paper and its Supporting Information files. Funding: Funding of field work in Tartagal city, including Aedes aegypti larval sampling, was provided by Pan American Energy Company. The funders had no role in study design, data collection and analysis, decision to publish, or preparation of the manuscript. Competing Interests: Although funding for Ae. aegypti monitoring, necessary for the development of
Background Since 2009, Fundación Mundo Sano has implemented an Aedes aegypti Surveillance and Control Program in Tartagal city (Salta Province, Argentina). The purpose of this study was to analyze temporal dynamics of Ae. aegypti breeding sites spatial distribution, during five years of samplings, and the effect of control actions over vector population dynamics.
Methodology/Principal Findings Seasonal entomological (larval) samplings were conducted in 17,815 fixed sites in Tartagal urban area between 2009 and 2014. Based on information of breeding sites abundance, from satellite remote sensing data (RS), and by the use of Geographic Information Systems (GIS), spatial analysis (hotspots and cluster analysis) and predictive model (MaxEnt) were performed. Spatial analysis showed a distribution pattern with the highest breeding densities registered in city outskirts. The model indicated that 75% of Ae. aegypti distribution is explained by 3 variables: bare soil coverage percentage (44.9%), urbanization coverage percentage(13.5%) and water distribution (11.6%).
Conclusions/Significance This results have called attention to the way entomological field data and information from geospatial origin (RS/GIS) are used to infer scenarios which could then be applied in epidemiological surveillance programs and in the determination of dengue control strategies. Predictive maps development constructed with Ae. aegypti systematic spatiotemporal data, in Tartagal city, would allow public health workers to identify and target high-risk areas with appropriate and timely control measures. These tools could help decision-makers to improve health system responses and preventive measures related to vector control.
PLOS Neglected Tropical Diseases | DOI:10.1371/journal.pntd.0004621
May 25, 2016
1 / 21
Temporal Dynamics and Spatial Patterns of Aedes aegypti Breeding Sites in Tartagal (Argentina)
this publication, was provided by Pan American Energy Company, this does not alter our adherence to all PLOS Pathogens policies on sharing data and materials.
Author Summary As reported in Porcasi et al., in Argentina we are working on an integrated risk stratification system based in geospatial technologies that have moderately consolidated national scale, but need more understanding of its urban scale mechanisms. In this work, relevant results are shown on how Ae. aegypti breeding sites are distributed in dynamic spatial patterns in a small city on northern Argentina. 5 years of entomologic data were obtained by Mundo Sano Foundation, which is implementing an Aedes aegypti Surveillance and Control Program in Tartagal City (Salta Province, Argentina). The focus of this contribution is based on the difference that can found between one year data typical analysis and long term temporal evolution of spatial patterns. Although environmental sanitation activities and chemical control of breeding sites with larvicide were performed after each entomological surveillance all around Tartagal, sectors with higher densities of breeding sites remained present throughout study period. Nonetheless, the distribution of breeding sites showed a spatial dynamic with high density clusters in city outskirts.
Introduction Mosquitoes of Aedes genus are the principal vectors of Dengue, Yellow Fever, Chinkungunya and Zika viruses in the Americas [1,2]. Aedes aegypti (Diptera: Culicidae) transmits Dengue virus in the tropical and subtropical South America regions, and its transmission is influenced by various factors, including vector mosquito density, circulating virus serotypes, and human populations susceptibility [3]. In Argentina, Ae. aegypti is the most relevant mosquito from epidemiologic point of view. This specie is characterized by its adaptation to the urban environment, its capacity and preference of breeding in artificial containers [4], the resistance of its eggs to desiccation and the feeding behavior of the female which bites in multiple occasions during each gonadotrophic cycle [5]. These characteristics, together with this vector wide distribution in Northern Argentina, constitute fundamental factors that influence circulation and transmission of Dengue and other related viruses in the region [6]. After a successful vector eradication campaign, at national level, in the 70´s [7], the first outbreak of dengue in Argentina was documented in 1998. Since then, intermittent outbreaks of the disease, with variable incidence rates, were registered in an almost continuous manner in the center and northern regions of the country [8]. A major dengue outbreak reached subtropical regions of Argentina in 2009, affecting more than 25,900 people including localities such as Buenos Aires and Córdoba [9,10]; although the largest percentage (over 90%) corresponded to case reports from Chaco, Catamarca and Salta provinces [8]. In this last province, in Tartagal city, around 665 dengue cases were confirmed including the first fatal case of this disease to be ever registered in Argentina [8]. From 2010 to 2014, a total of 338 suspected cases were registered in this city, from which 56 cases were confirmed (Hospital Provincial J.D. Perón, Tartagal, personal communication). Taking into account 2009 epidemiological situation, in October of that year, Mundo Sano initiated an Ae. aegypti surveillance and control program with the objective of reducing the risk of dengue transmission in the city of Tartagal, Since then, a permanent surveillance system of breeding sites and key infestation determinant factors involved in was implemented to generate a systematic information record of high epidemiological value. Considering Dengue native transmission, cases introduction from Paraguay, Bolivia and Brazil, and the absence of an effective vaccine [11], the north region of Argentine needs continuous vector control programs applications. Traditional Ae. aegypti control measures include
PLOS Neglected Tropical Diseases | DOI:10.1371/journal.pntd.0004621
May 25, 2016
2 / 21
Temporal Dynamics and Spatial Patterns of Aedes aegypti Breeding Sites in Tartagal (Argentina)
elimination (breeding sources reduction) or larval habitats chemical treatment to prevent adults production, and space spray insecticides application to reduce adult population densities [12]. In this sense, current control methods require a clear identification of the areas and the periods of mayor entomologic risk, as well as the identification of the viral propagation flow in a community [13]. Multiple environmental factors, including biophysical and social ones, constitute a complex web that determines the spread of vector-borne diseases [14]. In this sense, Ostfeld and collaborators [15] indicated that despite the complexity, an analysis of the variables linked to vectors distribution and the identification of dengue cases can be a useful tool to generate future spatial and temporal scenarios for dengue. Spatial analysis of health events contribute to early detect situations involving diseases transmission [15], while the detection of disease clusters allows the identification of nonrandom events and the possibility of inferring their epidemiological determinants [16]. Surveillance tools, such as incidence maps, have been used to enhance public health preparedness for dengue outbreaks by providing a visual aid for decision-making [17,18]. On the other hand, the use of satellite images in epidemiological analyses allows the identification of key environmental factors (temperature, rainfall and humidity) that influence the dynamic of the vectors, as well as their interactions [19,20]. Since the beginning of remote sensing (RS) technology, studies on vector-borne diseases have focused on identifying and mapping vector habitats [21], assessing environmental factors related to vector biology [22–24] and studying disease epidemiology [25,26]. Recent studies investigated the application of RS and spatial analysis techniques to identify and map landscape elements, that collectively define vector and human population dynamics related to disease transmission risk [27,28]. In addition, the development of increasingly sophisticated Geographic Information Systems (GIS) and RS has provided a new set of tools for public health professionals to monitor and respond to health challenges [29,30]. In this frame, Louis and collaborators [12] have detected a great diversity of both predictors and modeling approaches employed to create dengue risk maps through a systematic review and determined that the field of predictive dengue risk mapping is young and still evolving. In addition, different studies propose measures of prevention and control of Ae. aegypti for the elaboration of maps based on the results obtained from a bounded availability (space-time) of recorded data from both, field data and satellite imagery [31–33]. In this sense, an increase in the quality (amount and accuracy) of the field data used for the development of predictive maps will allow public health workers to identify areas of high risk for adequate control of the disease [19,34,35]. Despite the knowledge of Ae. aegypti biology and the use of monitoring tools, the precise detection of high density spots of vector breeding sites, as places of occurrence of the disease, remains poorly understood. Therefore, the purpose of this study was to analyze 5 years space-time dynamics of Ae. aegypti breeding sites and control actions effect on its populations, in Tartagal City (Prov. of Salta, Argentina). We discuss the predictive capacity of Ae. aegypti spatial distribution models, generated through environmental variables and minimal field data. This models constructed for dengue surveillance based on entomological risk maps, are considered a step in the generation for vector control strategies.
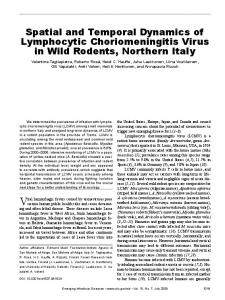
Materials and Methods Study area Tartagal city is located at the base of the Argentinean sub-Andean hills (22°32’ S, 63°49’ W; 450 m above sea level) in Salta Province (Fig 1). As the third largest urban center of the province,
PLOS Neglected Tropical Diseases | DOI:10.1371/journal.pntd.0004621
May 25, 2016
3 / 21
Temporal Dynamics and Spatial Patterns of Aedes aegypti Breeding Sites in Tartagal (Argentina)
Fig 1. Study area. Left top, worldwide location. Left bottom, location of Salta province in Argentina. Right top, Salta-Bolivia border. Bottom right, detail of Tartagal city and neighborhoods included in the study, neighborhoods (a) Northeastern added in 2013 and (b) Southwest added in 2011. doi:10.1371/journal.pntd.0004621.g001
with 79,900 inhabitants, it includes several ethnic groups such as native Amerindians. The city is located 100 km northern of Capricorn Tropic and to 55 km Southern of Argentinean-Bolivian border (Fig 1). The city is surrounded by subtropical native forests and crops such as beans, cotton, soybean, maize, grapefruit and tomato. The climate is subtropical, with an average annual temperature about 23°C; and an average maximum of 39°C (in summer) and average minimum of 9°C a(in winter) respectively. Annual cumulative precipitation is about 1,100 mm, with a dry season from June to October with a monthly average rainfall of 30 mm, that sharply contrasts with the wet season from November to May with a monthly average rainfall reaching 160 mm. Tartagal is characterized by a cultural diversity based on the presence of several autochthonous ethnic groups and emigrant population and continued migration from the bordering country of Bolivia. This feature produces an important effect on the cultural, social and economic profile of this community. The urban area of Tartagal city covers approximately 15 km2, and is composed by 1,027 blocks and 17,911 housing units. Each of the housing units was georeferenced by the use of GPS receiver. In Fig 1, sectors (a) and (b) refer to new neighborhoods that were incorporated in data collection and entomological control actions performed in 2011 and 2013, respectively.
Ae. aegypti data collection Presence and abundance data of Ae. aegypti larval stages breeding sites were registered from 2009 to 2014 in Tartagal city, using a methodology called Focal Cycle (FC). This method consists in the entomological surveillance and chemical treatment of 100% of the housing units in the study area. A total of 10 FCs were performed; the first 8 were performed in a continuous manner between the years 2009 and 2012 (Table 1). The analysis of the data showed that
PLOS Neglected Tropical Diseases | DOI:10.1371/journal.pntd.0004621
May 25, 2016
4 / 21
Temporal Dynamics and Spatial Patterns of Aedes aegypti Breeding Sites in Tartagal (Argentina)
Table 1. Temporal sequence of entomological data collection during 2009–2014 period for Tartagal city. Focal Cycle
Start
End
Year
FC1
12/05/2009
03/05/2010
2010*
FC2
03/08/2010
06/02/2010
2010*
FC3
06/02/2010
09/07/2010
2010
FC4
09/07/2010
12/21/2010
2010
FC5
01/03/2011
05/19/2011
2011*
FC6
05/18/2011
08/19/2011
2011
FC7
08/23/2011
12/16/2011
2011
FC8
12/19/2011
05/31/2012
2012*
FC9
10/05/2012
05/31/2013
2013*
FC10
11/22/2013
08/15/2014
2014*
FC (Focal Cycle); *Focal Cycle performed during the summer-autumn period of each year and included in the data analysis. doi:10.1371/journal.pntd.0004621.t001
during each year winter and spring, the presence of breeding sites and larval stages remained low. In order to optimize resources without losing any information, since 2012, during the winter-spring periods, random larval samplings were performed in 20% of the blocks of the city, alternating with FCs in the summer-autumn periods (Table 1). A total of 5 random larval samplings (denominated M1 to M5) were performed during the study period. During winter-spring period, chemical treatment was substituted by physical management and/or removal of containers that could serve as breeding sites. For each period, entomological field records consisted in the complete inspection of the housing units, within each block, registering information on the type and number of containers, grouped by the following categories: tires, tanks, drums, barrels, vases, pots, building materials, auto parts, bottles, cans, plastic, wells, cisterns, natural receptacles, and others (washing machines, refrigerators, toilets, etc.). Total number of containers was counted, such as the number of containers with water, and with larval stages. Larval stages were collected in individual tubes by container, labeled and transported to Mundo Sano entomological laboratory, in Tartagal city, for taxonomic determination using a specific morphological key [36]. Housing units were considered positive when they presented at least one container, with one or more larvae or pupae of Ae. aegypti. Additionally, a series of places were inspected and identified as critical breeding sites, since they presented an elevated number of containers in comparison to those registered in the housing units. The cemetery, municipal garbage dump, tire repair shops, small garbage accumulation sites and other similar places were included in this category. In each FC, the entomological indexes at the housing unit level were calculated using the House Index (HI) = number of positive homes/number of houses inspected) x 100 and Breteau Index (BI) = total number of breeding sites/number of houses inspected) x 100 [37,38]. These indexes are generally accepted for operational use [39,40].
Entomological control actions (chemical and environmental) After the entomological data collection, focal control actions were performed in each housing unit which entailed, for each FC round, mechanical treatment (modification, elimination or destruction) together with the application of the larvicide in a 1 mg/L dose, following the guidelines elaborated by TDR/WHO and the Argentinian Ministry of Health [41,42]. These actions
PLOS Neglected Tropical Diseases | DOI:10.1371/journal.pntd.0004621
May 25, 2016
5 / 21
Temporal Dynamics and Spatial Patterns of Aedes aegypti Breeding Sites in Tartagal (Argentina)
were accompanied by a communication campaign through the use of printed pamphlets destined to inform the general population about the disease and its risks. Moreover, with the objective of reducing the environmental burden of active and potential breeding sites generally accumulated in the peridomicile, neighborhood rallies were organized in collaboration with the local municipality and the participation of local public and private entities, to get rid of containers that favor the accumulation of water during the weeks prior to the start of the rainy season and during the summer months.
Distribution and density of breeding sites of Ae. aegypti in Tartagal In order to analyze the spatial and temporal distribution of the positive breeding sites, GIS vector layers were created including FCs data that were performed during summer and autumn of each year (Table 1). In this sense, and in order to comply with what was previously detailed, FC1 and 2 were combined since the interval of time between these FCs is equivalent to the time registered for the other FCs analyzed: FC5, FC8, FC9 and FC10 (Table 1). In order to avoid confusion, the unit of time of years will be used during the analysis to reference the FCs that correspond to the summer and autumn season of each year. Vector layers were generated using the free-access software Quantum GIS Desktop v2.6.1. Brighton (QGIS).
Hot spots Density breeding site maps were elaborated using discreet information (sites of individual sampling) through QGIS tool “heatmap”, in order to analyze the manner in which Ae. aegypti breeding sites were distributed in the city. Annual density breeding site maps (summer-autumn) were generated using the Kern density algorithm that calculates the density of positive points (grouping of the points) for a determined area. Using this methodology, the heat map allows for a visual identification of the hot spots for a particular time and place.
Cluster analysis (SatScan) The methodology of statistical spatial analysis exploration, developed by Kulldorf [43] was used to identify spatial clusters with Ae. aegypti larval stages presence, with greater density than those expected by a random distribution. The analysis would then indicate some areas with a greater presence of breeding sites than others. Sites with the presence of larval stages were indicated as positive cases (1) and those without any presence were indicated as negative controls (0). The analysis consisted of a spatial scan through the superposition of exploratory circles, over sites with a record of larval presence. Each circle is a possible cluster and, taking into account the number of events inside and outside an expected number of events, each probability is calculated. The circle that presents the maximum probability, and an excess in the number of events observed versus expected, is defined as the most probable cluster [43]. In this case, the maximum size of the cluster was assigned as 30% of the total population under study. In our analysis, for each place and window size (circle), the null hypothesis assumes that sites with the presence of larval stages are randomly distributed, while the alternative hypothesis indicates that there is a greater risk inside the window in comparison to the outside. A maximum of 999 Monte Carlo replications were performed in other to search for statistically significant composites. Only the composites that achieved statistical significance (p