Remote Sens. 2015, 7, 13233-13250; doi:10.3390/rs71013233 OPEN ACCESS
remote sensing ISSN 2072-4292 www.mdpi.com/journal/remotesensing Article
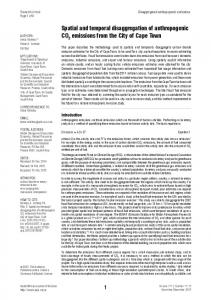
Spatial and Temporal Patterns of Global NDVI Trends: Correlations with Climate and Human Factors Ya Liu 1,2, Yan Li 1,2, Shuangcheng Li 1,2,* and Safa Motesharrei 3,4,5 1
2
3
4 5
College of Urban and Environmental Sciences, Peking University, Beijing 100871, China; E-Mails:
[email protected] (Y.L.);
[email protected] (Y.L.) Key Laboratory for Earth Surface Processes of Ministry of Education, Peking University, Beijing 100871, China The Institute for Physical Science Technology, University of Maryland, College Park, MD 20742, USA; E-Mail:
[email protected] Department of Physics, University of Maryland, College Park, MD 20742, USA National Socio-Environmental Synthesis Center (SESYNC), Annapolis, MD 21401, USA
* Authors to whom correspondence should be addressed; E-Mail:
[email protected]; Tel.: +86-10-6276-7428. Academic Editors: Chyi-Tyi Lee, Alfredo R. Huete, Parth Sarathi Roy and Prasad S. Thenkabail Received: 27 March 2015 / Accepted: 26 September 2015 / Published: 6 October 2015
Abstract: Changes in vegetation activity are driven by multiple natural and anthropogenic factors, which can be reflected by Normalized Difference Vegetation Index (NDVI) derived from satellites. In this paper, NDVI trends from 1982 to 2012 are first estimated by the Theil–Sen median slope method to explore their spatial and temporal patterns. Then, the impact of climate variables and human activity on the observed NDVI trends is analyzed. Our results show that on average, NDVI increased by 0.46 × 10⁻³ per year from 1982 to 2012 globally with decadal variations. For most regions of the world, a greening (increasing) – browning (decreasing)–greening (G-B-G) trend is observed over the periods 1982–2004, 1995–2004, and 2005–2012, respectively. A positive partial correlation of NDVI and temperature is observed in the first period but it decreases and occasionally becomes negative in the following periods, especially in the Humid Temperate and Dry Domain Regions. This suggests a weakened effect of temperature on vegetation growth. Precipitation, on the other hand, is found to have a positive impact on the NDVI trend. This effect becomes stronger in the third period of 1995–2004, especially in the Dry Domain Region. Anthropogenic effects and human activities, derived here from the
Remote Sens. 2015, 7
13234
Human Footprint Dataset and the associated Human Influence Index (HII), have varied impacts on the magnitude (absolute value) of the NDVI trends across continents. Significant positive effects are found in Asia, Africa, and Europe, suggesting that intensive human activity could accelerate the change in NDVI and vegetation. A more accurate attribution of vegetation change to specific climatic and anthropogenic factors is instrumental to understand vegetation dynamics and requires further research. Keywords: NDVI; vegetation; spatio-temporal pattern; temperature and precipitation; human footprint
1. Introduction Vegetation is an essential element of the land surface system that links soil, air, water, and other environmental components [1,2]. Vegetation dynamics can provide valuable information about global warming [3], phenological change [4], crop status [5], land degradation, [6] and desertification [7]. Normalized Difference Vegetation Index (NDVI), derived from measurements of the optical reflectance of sunlight in the red and near-infrared wavelengths [8], is highly sensitive to ecosystem conditions [9,10]. Therefore, it can serve as a proxy for detecting changes in vegetation activity, e.g., greening (NDVI increase) and browning (NDVI decrease) trends [11]. Several studies have reported greening trends in the northern high latitudes [12–15], the Sahel region, and parts of Australia [16–19] over the past three decades. However, many forested biomes have exhibited a declining NDVI trend [20], especially in the boreal forests [21]. Due to large interannual variability, spatial patterns of NDVI trends and their drivers may vary substantially in different areas when different study periods are selected. Therefore, NDVI time-series are needed over long time spans to properly analyze such spatio-temporal patterns. Vegetation dynamics are influenced by both environmental (e.g., climate) and anthropogenic factors (e.g., management practices) with spatially-varying effects [22–24]. This makes attribution difficult due to many confounding variables. The relationship between climate change and NDVI trends has been extensively explored in the literature. For instance, temperature is considered to be the leading cause of the high-latitude greening trend, while precipitation has played only a minor role [12,14]. Such greening is mainly a consequence of warming that allows prolonged growing seasons due to early spring and delayed autumn. Lucht et al. [25] found that temperature increase alone can largely explain the vegetation greening trend in the boreal regions. However, increased vegetation productivity in China and the United States is probably linked to increased precipitation [26]. Besides climate change, human activities such as land conversion [27], fertilization, irrigation, etc. could also significantly impact NDVI trends [28,29]. Nevertheless, we see less emphasis on the human dimension in the literature, especially on a global scale. It is still unclear how natural and human factors together affect NDVI trends and how their effects evolve over time. In this study, we analyze the spatio-temporal patterns of vegetation activity over the past three decades and explore their relationships with climate and human variables. Three questions are addressed here: (1) what is the geographical distribution of greening and browning trends and how do they vary as a function of analysis period? (2) What are the relationships between climate variables and
Remote Sens. 2015, 7
13235
NDVI trends and their temporal variations? (3) How do the human factors relate to vegetation dynamics at the continental scale? 2. Data and Methods 2.1. GIMMS NDVI3g Dataset The NDVI dataset used in this analysis is GIMMS NDVI version 3 (referred to as NDVI3g), derived from NOAA AVHRR data (National Oceanic and Atmospheric Administration Advanced Very High Resolution Radiometer) [30]. The dataset has a length of 31 years, covering July 1981 to December 2012, with a fortnightly temporal and 8 km spatial resolution. The NDVI3g archive has certain areas masked off over non-vegetated lands, or when measurements are ambiguous due to surface conditions [31]. These include oceans, major lakes, the Greenland icecap, and many parts of the Arctic and Antarctic. This dataset is considered to be the most accurate long-term AVHRR data record [32], which makes it appropriate for long-term studies of land surface trends in vegetation, seasonality, and coupling between climate variability and vegetation. We extracted NDVI values from January 1982 to December 2012 and applied the maximum-value-composite (MVC) technique to obtain monthly time-series to further remove the bias caused by atmospheric conditions [33]. The annual NDVI time-series were calculated by averaging the monthly data. 2.2. Climate Dataset The climate data are obtained from the latest version of the high-resolution Climatic Research Unit time-series (CRU-TS) 3.22 dataset, provided by the University of East Anglia [34–36]. The gridded time-series dataset covers the period 1901–2013, at 0.5 degree resolution. The monthly data are calculated from daily or sub-daily data provided by more than 4000 weather stations distributed around the world and aggregated into annual time-series for trend estimation. Only temperature and precipitation data from 1982 to 2012 are used in the analysis in accordance with the NDVI data. 2.3. Global Human Footprint Dataset (from 1995 to 2004) The Global Human Footprint Dataset (LWP-2)—a proxy for anthropogenic effects—is the normalized Human Influence Index (HII), created from nine global data layers including human population pressure (population density), human land use and infrastructure (built areas, nighttime lights, land use, land cover), and human access (coastlines, roads, railroads, navigable rivers). It is a comprehensive index representing human effects on the environment with a spatial resolution of 1-km. It ranges from 0 to 100, with higher values indicating a stronger anthropogenic impact. The dataset was produced by the Wildlife Conservation Society (WCS) and the Columbia University Center for International Earth Science Information Network (CIESIN) [37].
Remote Sens. 2015, 7
13236
2.4. Bailey’s Ecoregions Map Ecoregions are large areas of similar climate where ecosystems recur in predictable patterns. Bailey’s Ecoregions Map characterizes the patterns of global climate and potential natural vegetation [38,39]. That enables us to explore the relationships between NDVI trends and climatic factors on a regional basis, covering different climate regimes. The map consists of four first-level categories or Domain regions—Dry, Humid Temperate, Humid Tropical, and Polar—each containing several sub-categories. The data can be obtained from the U.S. Forest Service, Inventory and Monitoring Institute, Ecoregions Center. 2.5. Methods We estimated linear trends of NDVI and climate variables from their annual time-series for each pixel using the Theil–Sen (TS) median slope. The Theil–Sen procedure is a rank-based test that calculates the non-parametric slope and intercept of the time-series by determining the median of all estimates of the slopes derived from all pairs of observations [40]. The outputs of the TS procedure provide an annual rate of change of NDVI and a measure of significance. The TS procedure is commonly used in estimating NDVI trends [11,41] because it is resistant to outliers and is accurate even for skewed and heteroscedastic data [42]. In order to better capture temporal changes of NDVI, trends were estimated for three distinct periods: 1982–1994, 1995–2004 and 2005–2012. This division is not determined by the breakpoint detection (e.g., Rogier et al. [43]) because breakpoints and their frequency could vary greatly across the world [44]. Usually, breakpoint detection approach is applied to a certain region rather than the whole world [45,46]. In fact, the two breakpoints adopted here, 1995 and 2004, aimed to define a period during which both NDVI and Global Human Footprint data overlap. Therefore, they offer a unique time window for analyzing interconnections of human activity and NDVI trends. In addition, the breakpoints chosen here approximately match the breakpoints detected in the previous studies of Piao et al. [47] and Zhang et al. [45]. The TS procedure is also applied to the climate variables, including temperature and precipitation, for trend estimation. After estimating trends in NDVI, temperature, and precipitation by the TS procedure, we analyzed correlations between NDVI change and climate variables and also human footprint data across different ecoregions and geographical regions. 3. Results and Discussions 3.1. Annual Change of NDVI The estimated annual rate of change of NDVI from 1982 to 2012 is shown in Figure 1, with a positive average of 0.46 × 10⁻³ per year. Most of the greening areas are in the Northern Hemisphere (NH), consistent with the previous studies [12,13,18,48]. The most evident greening trend can be found in Western Europe, followed by the Southeastern United States, Amazonia, Sahel, India, and the southeastern parts of China. Browning trends are mainly found in parts of the boreal region of North America, as well as Argentina and Southern Africa.
Remote Sens. 2015, 7
13237
Figure 1. Annual rate of change of NDVI of 1982–2012. Pixels with insignificant trends (P ≥ 0.05) are masked out. NDVI trends for three separate periods are presented in Figure 2. The period 1982–1994 is characterized by widespread greening trends in the NH, especially over Europe, parts of the United States, India, and China. In contrast, the majority of the Southern Hemisphere (SH) shows insignificant NDVI trends, with some noticeable browning. This is in agreement with the study of Xiao and Moody [48]. During the period 1995–2004, areas with significant NDVI change were dominated by browning trends all over the world, while greening only took place in the high latitudes of North America and Asia. The increase in vegetation growth that took place prior to 1995 over broad areas in the NH became insignificant or even reversed during this period. This is also supported by other studies [47,49–51]. For example, Piao et al. [47] found that the growing season NDVI significantly increased from 1982 to 1997 and then decreased from 1997 to 2006 in the temperate and boreal Eurasia. In the latest period, 2005–2012, while NDVI changes in most parts of the world remained insignificant, significant greening trends appeared in Northern Russia and Eastern Australia. Moreover, browning trends appeared mainly in the Western United States, northern parts of South America and Central Africa. These results clearly indicate that spatial patterns of NDVI change vary greatly over different periods. We observe an overall greening, browning, and greening for the three periods 1982–1994, 1995–2004, and 2005–2012, respectively, at annual rate of change of 0.65 × 10⁻³, −0.55 × 10⁻³ and 0.97 × 10⁻³.
Remote Sens. 2015, 7
13238
Figure 2. Annual rate of change of NDVI over the three periods of 1982–1994, 1995–2004 and 2005–2012. Pixels with insignificant trends (P ≥ 0.05) are masked out.
Remote Sens. 2015, 7
13239
Table 1. Annual change of NDVI in different ecoregions for the three periods. Slope values are multiplied by 1000. 1st Level Category 12 13 14 17 21 22 23 24 5 6 7 8 9 10 11 15 16 18 19 20 25 26 27 28 1 2 3 4
Dry Domain
Humid Temperate Domain
Humid Tropical Domain
Polar Domain
2nd Level Category Temperate Steppe Division Temperate Steppe Regime Mountains Temperate Desert Division Temperate Desert Regime Mountains Tropical/Subtropical Steppe Division Tropical/Subtropical Desert Division Tropical/Subtropical Desert Regime Mountains Tropical/Subtropical Steppe Regime Mountains Marine Division Marine Regime Mountains Warm Continental Division Warm Continental Regime Mountains Prairie Division Hot Continental Division Prairie Regime Mountains Mediterranean Regime Mountains Mediterranean Division Hot Continental Regime Mountains Subtropical Division Subtropical Regime Mountains Savanna Regime Division Rainforest Regime Mountains Savanna Division Rainforest Division Tundra Regime Mountains Tundra Division Subarctic Regime Mountains Subarctic Division Globally mean value
1982–1994 2.069 1.246 1.107 1.867 0.563 0.045 0.734 0.890 2.324 1.795 2.077 0.671 1.394 1.805 2.253 1.790 1.875 0.804 −0.028 0.155 −0.439 0.209 −0.131 −0.377 0.486 0.394 0.831 1.082 0.649
1995–2004 −0.704 −0.362 0.256 −0.271 −0.720 −0.388 −0.019 −0.868 −0.496 −1.001 −0.392 −1.361 −1.547 −1.807 −1.882 −1.182 0.478 −1.919 −1.363 −1.239 −2.042 −1.069 −1.240 −1.149 1.562 0.665 −0.464 −0.843 −0.552
2005–2012 0.767 −2.913 −0.444 1.093 3.389 1.832 0.918 −0.143 −1.958 −1.157 1.352 −1.507 1.792 0.282 1.399 4.006 2.565 0.652 1.831 −0.551 −0.514 −1.723 1.239 −2.159 1.532 2.119 1.968 1.117 0.974
Trend Type G-B-G G-B-B G-G-B G-B-G G-B-G G-B-G G-B-G G-B-B G-B-B G-B-B G-B-G G-B-B G-B-G G-B-G G-B-G G-B-G G-G-G G-B-G B-B-G G-B-B B-B-B G-B-B B-B-G B-B-B G-G-G G-G-G G-B-G G-B-G
Remote Sens. 2015, 7
13240
Figure 3. Categories of Bailey’s Ecoregions as defined in Table 1 (top) and temporal patterns of NDVI trends in Bailey’s Ecoregions (bottom). Table 1 shows the spatio-temporal patterns of NDVI trends aggregated by Bailey’s Ecoregions Map. Letter G represents a greening trend (positive NDVI change rate), while letter B represents a browning trend (negative NDVI change rate). Figure 3 shows the spatial distribution of Bailey’s Ecoregions and the corresponding temporal patterns of NDVI change according to Table 1. It is observed that the G-B-G trend is the dominant pattern in the world, covering large parts of Asia and Europe, middle-eastern North America, North Africa, and much of Australia. These regions experienced a greening trend interrupted
Remote Sens. 2015, 7
13241
by browning in the period 1995–2004, consistent with the conclusions of previous studies [20,43]. The B-B-B trend only exists in the Rainforest Division of both South America and Africa, indicating that the rainforest regions underwent continuous browning throughout the 31 years. The G-G-G trend, indicating continuous greening, is observed in high latitude regions of the NH, namely, Tundra Regime Mountains and Tundra Division. The B-B-G trend is observed in the Savanna Division and Subtropical Division regions, indicating that a browning trend had turned into greening over the latest period of 2005–2012. The G-G-B trend, showing a greening trend that turned into browning after 2005, is only observed in the Temperate Desert Division region. The G-B-B trend is observed in regions such as the Marine Division and Marine Regime Mountains. 3.2. Relationship between NDVI Trends and Temperature/Precipitation Trends Climate variability is one of the main drivers of vegetation dynamics [13,43,52]. The spatial relationships between NDVI change and the changes in climate variables (i.e., temperature and precipitation) are analyzed for each domain of the Bailey’s Ecoregions (Table 2). The results show that the strengths of relationships vary among ecoregions over different periods. We only include pixels with significant NDVI trend in the analysis to better reflect vegetation change, whereas those with insignificant trend are excluded. Significant NDVI trends account for about 10% to 18% of all samples in each period among four ecoregions and are able to well represent the regional trends compared to all samples (Table S3). In most cases, the influence of temperature and precipitation changes on NDVI trends are positive, suggesting that the increase in both temperature and precipitation could promote vegetation growth. However, some exceptions exist in the Dry Domain Region and the Polar Domain Region, where the partial correlation is negative over certain periods. The relationship between the NDVI trend and temperature trend becomes weaker as the partial correlation decreases over time, especially in the Humid Temperate and Humid Tropical Domain Regions. On the other hand, the relationship between NDVI trends and precipitation trends becomes stronger after 2005, especially in the Humid Temperate Domain Region. The results of multiple regression analysis (Table S1) show similar spatial patterns for the relationship between NDVI trend and climate variables (i.e., temperature and precipitation). In the Dry Domain Region, both mean temperature and precipitation increase over each period. The positive partial correlation between NDVI and temperature trends decreases over time and becomes even negative (−0.415) in the last period. In contrast, the correlation between NDVI and precipitation trends stays positive throughout all three periods. These results suggest that in the Dry Domain Region, the effect of temperature change on NDVI trends is more variable. The relative strength of the impact of temperature and precipitation on NDVI changes also varies with time. For example, temperature trends had stronger correlation with NDVI trends than precipitation during the period 1982–1994. Nevertheless, precipitation played a more significant role over the last two periods, as can be seen from the high correlation coefficient of 0.452 for the period 2005–2012. In the Humid Temperate Domain Region, effects of both temperature change and precipitation change on NDVI trends are consistently positive during each period, although their strengths vary. While the partial correlation of NDVI trends and precipitation change increased, the partial correlation of NDVI trends and temperature change decreased. This weakened spatial relationship between NDVI
Remote Sens. 2015, 7
13242
trends and temperature change is partly supported by Piao et al. [53]. They show that the relationship between the interannual temperature variability and NDVI has weakened substantially in the northern mid and high latitudes over the past three decades, possibly due to extreme climate events. Table 2. Partial correlations between changes in NDVI and climate variables. T (temperature) and P (precipitation). The value of NDVI in each period is the averaged value of the significant trends over different ecoregions. Region
Dry Domain Region Partial Correlation
Annual Change Rate (×10 ) NDVI 1982–1994
0.652
Humid Temperate Domain Region
−3
T
P
NDVI
NDVI
°C/yr
mm/yr
vs. T
vs. P
0.730
−0.057
0.414***
0.340***
***
***
1995–2004
−0.413
1.408
0.168
0.147
2005–2012
1.007
1.510
0.493
−0.415***
Region
0.181
0.452***
Annual Change Rate (×10−3) NDVI 1.621
T
P
NDVI
NDVI
°C/yr
mm/yr
vs. T
vs. P
1.159
1.891
0.318***
0.036(ns)
***
0.079*** 0.230***
−0.717
1.964
2.461
0.100
2.347
2.329
6.390
0.071**
Humid Tropical Domain Region Annual Change Rate (×10−3) NDVI
Partial Correlation
Polar Domain Region
Partial Correlation
T
P
NDVI vs.
NDVI
°C/yr
mm/yr
T
vs. P
Annual Change Rate (×10−3) NDVI
T
P
°C/yr
mm/yr
Partial Correlation NDVI vs. T
NDVI vs. P
1982–1994
−0.197
0.035
−1.612
0.208***
0.286***
0.841
1.955
0.979
0.149***
0.107***
1995–2004
−1.189
0.131
−0.087
0.147***
0.149***
−0.028
2.641
2.498
−0.217***
−0.040*
2005–2012
−0.337
−0.116
−2.742
0.134***
0.248***
1.550
4.046
2.697
0.240***
−0.089***
* Significant at the 0.10 level (2-tailed), ** significant at the 0.01 level (2-tailed), *** significant at the 0.001 level (2-tailed), ns stands for not significant.
In the Humid Tropical Domain Region, both NDVI and precipitation decrease in all three periods. The decline in vegetation activity might be due to the drying climate, as indicated by the previous studies [49–51]. Still, both temperature change and precipitation change have a positive effect on NDVI change in each period, although the partial correlation with temperature change decreases as in the Humid Temperature Domain Region. The close values of correlations of NDVI trends with temperature and precipitation in each period indicate that both climate variables are of similar significance in determining vegetation growth change. In the Polar Domain Region, temperature and precipitation increased significantly over all three periods. Nevertheless, there is no clear correlation between NDVI change and climate variables because the sign of the correlation coefficient, R, changes over time. Temperature has a higher partial correlation with NDVI than precipitation, indicating that heat might play a more important role in vegetation growth over this region. In addition, the very low vegetation cover and unfavorable atmospheric conditions [43] in this region could influence the quality of the data. The changes in vegetation growth are dependent upon the collective changes of temperature and precipitation. The positive relationship found between NDVI and precipitation trends in most cases demonstrates that an adequate increase in precipitation is a prerequisite for realizing the positive effect from the rising temperature; otherwise, warming can even reduce the vegetation growth as observed recently [49]. This can happen because moisture deficit due to increased evapotranspiration in a warmer world may offset the positive effect of temperature on vegetation growth (extended length of the
Remote Sens. 2015, 7
13243
growing season) [53]. For example, in the Dry Domain Region, although both temperature and precipitation increased, temperature increase had a negative effect on NDVI trend while the effect of increasing precipitation was positive. The greening/browning trends in many areas are only partially explained by temperature and precipitation. In large regions, other factors—such as CO2 fertilization, reforestation, forest regrowth, woody plant proliferation, and agricultural management practices—may drive these trends. The increase in atmospheric CO2 concentration is likely to cause an increase in vegetation productivity, supported by modeling studies [54], experimental studies [55], and studies based on remote sensing data [56]. 3.3. Relationship between NDVI Trends and Human Footprint Changes in vegetation activity can also be influenced by human activities (e.g., land use). Anthropogenic effects on vegetation change could either be positive or negative, depending on the specific human actions (e.g., positive effects from fertilization and irrigation on crop lands and negative effects from deforestation or urbanization). Global Human Footprint (GHF) is used as a proxy to represent the extent of anthropogenic effects as a whole, since it cannot distinguish between actions with positive or negative effects on vegetation. Therefore, here we test the hypothesis that more intensive human activities could lead to greater changes in vegetation activity as reflected by NDVI regardless of the sign of the change. For this purpose, the relationship between the magnitude of the NDVI trend (trend in absolute value) and human footprint is examined at the country level across different continents. We conduct the analysis at the country level because human influence is closely linked to its political, economic, and social status. Since the GHF dataset only covers the time period 1995–2004, NDVI trends for the same period (1995–2004) as well as for the whole time span of 1982–2012 are analyzed. The results for the two time periods are generally consistent and only differ in their statistical significance (Table S2), suggesting that this analysis is not sensitive to the choice of period. Figure 4 shows the relationship between NDVI trends and human footprint for the period 1982–2012. Clearly, there are strong positive correlations in Africa, Asia, and Europe (p < 0.01), weak positive correlations in Oceania (p > 0.1), and weak negative correlations in both North and South America (p > 0.1). The positive correlation shows that intensive human footprint is indeed associated with a larger NDVI change in terms of the magnitude. On the other hand, human influence can enhance the vegetation growth. This positive effect could result from development activities such as land transformation, intensive agriculture (irrigation, fertilization), plantations, and nitrogen deposition [27]. For example, evidence from China suggests that greening in croplands and forested lands are mainly caused by agricultural practices as well as afforestation and reforestation [18]. Fertilization and irrigation probably resulted in greening in India from 1982 to 2003 [57]. Greening in the Sahelian region of Africa is partially explained by the land use changes [58]. On the other hand, human influence can also negatively impact the NDVI trends and cause browning (e.g., deforestation). For instance, it is suggested that the majority of the browning from 1982 to 2003 in Central Asia was caused by the abandonment of agricultural lands [59]. However, the weak relationships observed in Oceania, South America, and North America demonstrate that the relationship between human influence and magnitude of NDVI trends is not straightforward, probably because the negative
Remote Sens. 2015, 7
13244
(positive) effects of human activity could be counteracted by the positive (negative) effects of climate change, leading to a weak correlation between NDVI change and GHF.
Figure 4. Relationship between the magnitude of NDVI rate of change and human footprint (log10) in each continent over the period 1982–2012. NDVI trends displayed on the y-axis are absolute values multiplied by 1000. Points represent countries. Black dots indicate positive NDVI trends, while asterisks indicate negative trends. Red line is the fitted line based on the generalized least squares model. R is the correlation coefficient and P is its significance level.
Remote Sens. 2015, 7
13245
Preliminary results of the statistical analysis cannot specify which human factors may be responsible for NDVI increase or decrease, because human activities are diverse and have substantial regional differences. More importantly, climate variables also contribute greatly to NDVI change, which can modify the impact of human activities to some extent. In fact, multiple mechanisms drive vegetation dynamic changes, including climate factors (temperature, precipitation), climate change induced disturbance (fire, plant, diseases, and insect pests), and human activity induced environmental changes (land use/cover change, forest regrowth, nitrogen deposition, CO2 fertilization, aerosols, etc.). Therefore, further research is needed to better understand the mechanisms of human activities on vegetation changes, especially studies with process-based ecosystem models capable of separating climate and human factors (e.g., Mao et al. [60]). 4. Conclusions In this study, we investigate the spatio-temporal changes in vegetation activity as given by the global NDVI trends. We also explore the effects of climate variables and human activities on the observed patterns. The main findings are as follows. (1). NDVI change has considerable spatial variability with both greening and browning during 1982–2012. Most parts of the Northern Hemisphere have exhibited significant greening trend over this 31-year period, while greening is observed less frequently in the Southern Hemisphere. In addition, NDVI trends have multi-year variations, showing an overall greening, browning, and greening for the periods 1982–2004, 1995–2004, and 2005– 2012, respectively. The G-B-G pattern (greening–browning–greening) is the most prevalent type of temporal variability observed over the study period. (2). For the full period 1982–2012, there are positive correlations of NDVI trends with both temperature and precipitation across most regions (except for the Polar Domain Region). Such correlation with temperature trends became weaker over time, especially in the Humid Temperate and Humid Tropical Domain Region. The correlation with precipitation trends is stronger in the latest period (2005–2012) in the Dry Domain Region. (3). Significant positive correlation between human footprint and the magnitude of the NDVI trend in Asia, Africa, and Europe suggests that human activity actually accelerated NDVI changes in these continents. Overall, we show that the greening and browning trends in NDVI from 1982 to 2012 in many regions of the world have significant spatial and temporal variations. It is difficult to attribute the observed spatial and temporal patterns in NDVI change to specific factors because of the mixed effects from climate change and human influence. Nevertheless, we still show that human activity can amplify NDVI changes. More investigation is needed to accurately clarify and quantify the impacts of various natural and anthropogenic factors on vegetation changes.
Remote Sens. 2015, 7
13246
Acknowledgments This work was supported by the National Natural Science Foundation of China (Grant No. 41371096) and the National Basic Research Program of China (Grant No. 2015CB4527022). The authors thank Jorge Pinzon and Jim Tucker for providing the GIMMS NDVI3g dataset used in the analysis. The authors are grateful to the University of East Anglia for providing the climatic dataset, and to the Wildlife Conservation Society (WCS) and the Columbia University Center for International Earth Science Information Network (CIESIN) for providing the Global Human Footprint dataset. Finally, the authors would like to thank the anonymous referees for their detailed, constructive comments that considerably improved the manuscript. Author Contributions Shuangcheng Li, Yan Li and Safa Motesharrei conceptualized the study; Ya Liu and Shuangcheng Li analyzed the data; Ya Liu, Yan Li and Safa Motesharrei drafted the manuscript. All authors contributed in the discussion of the results and in writing the paper. Conflicts of Interest The authors declare no conflict of interest. References 1. 2. 3.
4.
5.
6. 7. 8.
Foley, J.A.; Levis, S.; Costa, M.H.; Cramer, W.; Pollard, D. Incorporating dynamic vegetation cover within global climate models. Ecol. Appl. 2000, 10, 1620−1632. Linli, C.; Jun, S.; Yinming, Y.; Wenyi, F. Ten-day response of vegetation NDVI to the variation of temperature and precipitation in eastern China. Acta Geogr. Sin. 2009, 64, 850−860. Pettorelli, N.; Vik, J.O.; Mysterud, A.; Gaillard, J.M.; Tucker, C.J.; Stenseth, N.C. Using the satellite-derived NDVI to assess ecological responses to environmental change. Trends Ecol. Evol. 2005, 20, 503−510. White, M.A.; de Beurs, K.M.; Didan, K.; Inouye, D.W.; Richardson, A.D.; Jensen, O.P.; O’Keefe, J.; Zhang, G.; Nemani, R.R.; van Leeuwen, W.J.D.; et al. Intercomparison, interpretation, and assessment of spring phenology in North America estimated from remote sensing for 1982–2006. Global Change Biol. 2009, 15, 2335−2359. Tottrup, C.; Rasmussen, M.S. Mapping long-term changes in savannah crop productivity in Senegal through trend analysis of time series of remote sensing data. Agric. Ecosyst. Environ. 2004, 103, 545−560. Metternicht, G.; Zinck, J.A.; Blanco, P.D.; Del Valle, H.F. Remote sensing of land degradation: Experiences from Latin America and the Caribbean. J. Environ. Qual. 2010, 39, 42−61. Symeonakis, E.; Drake, N. Monitoring desertification and land degradation over Sub-Saharan Africa. Int. J. Remote Sens. 2004, 25, 573−592. Tucker, C.J. Red and photographic infrared linear combinations for monitoring vegetation. Remote Sens. Environ. 1979, 8, 127–150.
Remote Sens. 2015, 7 9. 10. 11.
12.
13.
14.
15. 16.
17.
18. 19.
20.
21.
22. 23. 24.
13247
Myneni, R.B.; Hall, F.G.; Sellers, P.J.; Marshak, A.L. The interpretation of spectral vegetation indexes. IEEE Trans. Geosci. Remote Sens. 1995, 33, 481–486. Ollinger, S. Sources of variability in canopy reflectance and the convergent properties of plants. New Phytol. 2011, 189, 375–394. Alcaraz-Segura, D.; Chuvieco, E.; Epstein, H.E.; Kasischke, E.S.; Trishchenko, A. Debating the greening vs. browning of the North American boreal forest: Differences between satellite datasets. Global Change Biol. 2009, 16, 760−770. Tucker, C.J.; Slayback, D.A.; Pinzon, J.E.; Los, S.O.; Myneni, R.B.; Taylor, M.G. Higher northern latitude normalized difference vegetation index and growing season trends from 1982 to 1999. Int. J. Biometeorol. 2001, 45, 184–190. Zhou, L.; Tucker, C.J.; Kaufmann, R.K.; Slayback, D., Shabanov, N.V.; Myneni, R.B. Variations in northern vegetation activity inferred from satellite data of vegetation index during 1981 to 1999. J. Geophys. Res. 2001, 106, 20069–20083. Bogaert, J.; Zhou, L.; Tucker, C.J.; Myneni, R.B.; Ceulemans, R. Evidence fora persistent and extensive greening trend in Eurasia inferred from satellite vegetation index data. J. Geophys. Res: Atmos. (1984–2012). 2002, 107, 1–14. Slayback, D.A.; Pinzon, J.E.; Los, S.O.; Tucker, C.J. Northern hemisphere photosynthetic trends 1982–1999. Global Change Biol. 2003, 9, 1–15. Kawabata, A.; Ichii, K.; Yamaguchi, Y. Global monitoring of interannual changes in vegetation activities using NDVI and its relationships to temperature and precipitation. Int. J. Remote Sens. 2001, 22, 1377–1382. Nemani, R.R.; Keeling, C.D.; Hashimoto, H.; Jolly, W.M.; Piper, S.C.; Tucker, C.J.; Myneni, R.B.; Running, S.W. Climate-driven increases in global terrestrial net primary production from 1982 to 1999. Science 2003, 300, 1560–1563. Xiao, J.; Moody, A. Trends in vegetation activity and their climatic correlates: China 1982 to 1998. Int. J. Remote Sens. 2004, 25, 5669–5689. Fensholt, R.; Rasmussen, K.; Nielsen, T.T.; Mbow, C. Evaluation of earth observation based long term vegetation trends—Intercomparing NDVI time series trend analysis consistency of Sahel from AVHRR GIMMS, Terra MODIS and SPOT VGT data. Remote Sens. Environ. 2009, 113, 1242–1255. De Jong, R.; de Bruin, S.; de Wit, A.; Schaepman, M.E.; Dent, D.L. Analysis of monotonic greening and browning trends from global NDVI time-series. Remote Sens. Environ. 2011, 115, 692–702. Goetz, S.J.; Bunn, A.G.; Fiske, G.J.; Houghton, R.A. Satellite-observed photosynthetic trends across boreal North America associated with climate and fire disturbance. Proc. Natl. Acad. Sci. USA 2005, 102, 13521–13525. Lupo, F.; Reginster, I.; Lambin, E.F. Monitoring land-cover changes in West Africa with SPOT Vegetation: Impact of natural disasters in 1998–1999. Int. J. Remote Sens. 2001, 22, 2633−2639. Evans, J.; Geerken, R. Discrimination between climate and human-induced dryland degradation. J. Arid Environ. 2004, 57, 535−554. Wessels, K.J.; Prince, S.D.; Malherbe, J.; Small, J.; Frost, P.E.; Van Zyl, D. Can human-induced land degradation be distinguished from the effects of rainfall variability? A case study in South Africa. J. Arid Environ. 2007, 68, 271−297.
Remote Sens. 2015, 7
13248
25. Lucht, W.; Prentice, C.; Myneni, R.B.; Sitch, S.; Friedlingstein, P.; Cramer, W.; Bousquet, P.; Buermann, W.; Smith, B. Climatic control of the high-latitude vegetation greening trend and Pinatubo effect. Science 2002, 296, 1687–1689. 26. Piao, S.L.; Fang, J.Y.; Zhou, L.; Zhu, B.; Tan, K.; Tao, S. Changes in vegetation net primary productivity from 1982 to 1999 in China. Global Biogeochem. Cy. 2005, 19, GB2027. 27. Mueller, T.; Dressler, G.; Tucker, C.J.; Pinzon, J.E.; Leimgruber, P.; Dubayah, R.O.; Hurtt, G.C.; Bohning-Gaese, K.; Fagan, W.F. Human land-use practices lead to global long-term increases in photosynthetic capacity. Remote Sens. 2014, 6, 5717–5731. 28. Baldi, G.; Nosetto, M.D.; Aragon, R.; Aversa, F.; Paruelo, J.M.; Jobbagy, E.G. Long-term satellite NDVI data sets: Evaluating their ability to detect ecosystem functional changes in South America. Sensors 2008, 8, 5397–5425. 29. Neigh, C.S.R.; Tucker, C.J.; Townshend, J.R.G. North American vegetation dynamics observed with multi-resolution satellite data. Remote Sens. Environ. 2008, 112, 1749–1772. 30. Pinzon, J.; Tucker, C. A non-stationary 1981–2012 AVHRR NDVI3g time series. Remote Sens. 2014, 6, 6929–6960. 31. Tucker, C.J.; Goff, T.; Townshend, J. African land-cover classification using satellite data. Science 1985, 227, 369–375. 32. Eastman, J.R.; Sangermano, F.; Machado, E.A.; Rogan, J.; Anyamba, A. Global trends in seasonality of normalized difference vegetation index (NDVI), 1982–2011. Remote Sens. 2013, 5, 4799–4818. 33. Holben, B.N. Characteristics of maximum-value composite images from temporal AVHRR data. Int. J. Remote Sens. 1986, 7, 1417–1434. 34. Mitchell, T.D.; Jones, P.D. An improved method of constructing a database of monthly climate observations and associated high-resolution grids. Int. J. Climatol. 2005, 25, 693–712. 35. Yang, X.C.; Zhang, Y.L.; Liu, L.S.; Zhang, W.; Ding, M.J.; Wang, Z.F. Sensitivity of surface air temperature change to land use/cover types in China. Sci. China Series D: Earth Sci. 2009, 52, 1207–1215. 36. University of East Anglia Climatic Research Unit; Jones, P.D.; Harris, I. CRU TS3.22: Climatic Research Unit (CRU) Time-Series (TS) Version 3.22 of High Resolution Gridded Data of Month-by-Month Variation in Climate (Jan. 1901–Dec. 2013); NCAS British Atmospheric Data Centre: Didcot, UK, 2014. Available online: http://www.cru.uea.ac.uk/data (accessed on 17 September 2014). 37. Wildlife Conservation Society (WCS); Center for International Earth Science Information Network (CIESIN), Columbia University. Last of the Wild Project, Version 2, 2005 (LWP-2): Global Human Footprint Dataset (Geographic); NASA Socioeconomic Data and Applications Center (SEDAC): Palisades, NY, USA, 2005. Available online: http://sedac.ciesin.columbia.edu/wildareas/ (accessed on 11 November 2013). 38. Bailey, R.G.; Hogg, H.C. A world ecoregions map for resource reporting. Environ. Conserv. 1986, 13, 195–202. 39. Bailey, R.G. Explanatory supplement to ecoregions map of the continents. Environ. Conserv. 1989, 16, 307–309.
Remote Sens. 2015, 7
13249
40. Hoaglin, D.C.; Mosteller, F.; Tukey, J.W. Understanding Robust and Exploratory Data Analysis; Wiley: New York, NY, USA, 2000; Volume 3. 41. Fensholt, R.; Proud, S.R. Evaluation of earth observation based global long term vegetation trends—Comparing GIMMS and MODIS global NDVI time series. Remote Sens. Environ. 2012, 119, 131–147. 42. Eastman, J. R.; Sangermano, F.; Ghimire, B.; Honglei, Z.; Hao, C.; Neeti, N.; Yongming, C.; Machado, E.A.; Crema, S.C. Seasonal trend analysis of image time series. Int. J. Remote Sens. 2009, 115, 692–702. 43. De Jong, R.; Verbesselt, J.; Zeileis, A.; Schaepman, M. Shifts in global vegetation activity trends. Remote Sens. 2013, 5, 1117–1133. 44. De Jong, R.; Verbesselt, J.; Schaepman, M.E.; de Bruin, S. Trend changes in global greening and browning contribution of short-term trends to long-term change. Global Change Biol. 2012, 18, 642–655. 45. Zhang, Y.L.; Gao, J.G.; Liu, L.S.; Wang, Z.F.; Ding, M.J.; Yang, X.C. NDVI-based vegetation changes and their responses to climate change from 1982 to 2011: A case study in the Koshi River Basin in the middle Himalayas. Global Planet. Change 2013, 108, 139–148. 46. Chen, B.Z.; Xu, G.; Coops, N.C.; Ciais, P.; Innes, J.L.; Wang, G.Y.; Myneni, R.B.; Wang, T.L.; Krzyzanowski, J.; Li, Q.L.; et al. Changes in vegetation photosynthetic activity trends across the Asia-Pacific region over the last three decades. Remote Sens. Environ. 2014, 144, 28–41. 47. Piao, S.L.; Wang, X.; Ciais, P.; Zhu, B.; Wang, T.; Liu, J. Changes in satellite-derived vegetation growth trend in temperate and boreal Eurasia from 1982 to 2006. Global Change Biol. 2011, 17, 3228–3239. 48. Xiao, J.; Moody, A. Geographical distribution of global greening trends and their climatic correlates: 1982–1998. Int. J. Remote Sens. 2005, 26, 2371–2390. 49. Angert, A.; Biraud, S.; Bonfils, C.; Henning, C.C.; Buermann, W.; Pinzon, J.; Tucker, C.J.; Fung, I. Drier summers cancel out the CO2 uptake enhancement induced by warmer springs. Proc. Natl. Acad. Sci. USA 2005, 102, 10823–10827. 50. Lotsch, A.; Friedl, M.A.; Anderson, B.T.; Tucker, C.J. Response of terrestrial ecosystems to recent Northern Hemispheric drought. Geophys. Res. Lett. 2005, 32, L06705. 51. Park, H.S.; Sohn, B.J. Recent trends in changes of vegetation over East Asia coupled with temperature and rainfall variations. J. Geophys. Res. 2010, 115, D14101. 52. Piao, S.L.; Friedlingstein, P.; Ciais, P.; Zhou, L.; Chen, A. Effect of climate and CO2 changes on the greening of the Northern Hemisphere over the past two decades. Geophys. Res. Lett. 2006, 33, L23402, doi: 10.1029/2006GL028205. 53. Piao, S.L.; Nan, H.J.; Huntingford, C.; Ciais, P.; Friedlingstein, P.; Sitch, S.; Peng, S.S.; Ahlström, A.; Canadell, J.G.; Cong, N.; et al. Evidence for a weakening relationship between interannual temperature variability and northern vegetation activity. Nature Commun. 2014, 5, doi: 10.1038/ncomms6018. 54. Bounoua, L.; Hall, F.G.; Sellers, P.J.; Kumar, A.; Collatz, G.J.; Tucker, C.J.; Imhoff, M.L. Quantifying the negative feedback of vegetation to greenhouse warming: A modeling approach. Geophys. Res. Lett. 2010, 37, L23701.
Remote Sens. 2015, 7
13250
55. Polley, H.W.; Johnson, H.B.; Fay, P.A.; Sanabria, J. Initial response of evapotranspiration from tall grass prairie vegetation to CO2 at subambient to elevated concentrations. Funct. Ecol. 2008, 22, 163–171. 56. Donohue, R.J., McVicar, T.R.; Roderick, M.L. Climate-related trends in Australian vegetation cover as inferred from satellite observations, 1981–2006. Global Change Biol. 2009, 15, 1025–1039. 57. Jeyaseelan, T.; Roy, P.S.; Young, S.S. Persistent changes in NDVI between 1982 and 2003 over India using AVHRR GIMMS (Global Inventory Modeling and Mapping Studies) data. Int. J. Remote Sens. 2007, 28, 4927–4946. 58. Begue, A.; Vintrou, E.; Ruelland, D.; Claden, M.; Dessay, N. Can a 25-year trend in Soudano-Sahelian vegetation dynamics be interpreted in terms of land use change? A remote sensing approach. Global Environ. Change 2011, 21, 413–420. 59. Propastin, P.A.; Kappas, M.; Muratova, N.R. Inter-annual changes in vegetation activities and their relationship to temperature and precipitation in central Asia from 1982 to 2003. J. Environ. Inform. 2008, 12, 75–87. 60. Mao, J.F.; Shi, X.Y.; Thornton, P.E.; Hoffman, F.M.; Zhu, Z.; Myneni, R.B. Global latitudinal-asymmetric vegetation growth trends and their driving mechanisms: 1982–2009. Remote Sens. 2013, 5, 1484–1497. © 2015 by the authors; licensee MDPI, Basel, Switzerland. This article is an open access article distributed under the terms and conditions of the Creative Commons Attribution license (http://creativecommons.org/licenses/by/4.0/).