Available online at www.sciencedirect.com
Journal of Marine Systems 68 (2007) 457 – 472 www.elsevier.com/locate/jmarsys
Spatial and temporal variability in oceanographic and meteorologic forcing along Central California and its implications on nearshore processes Dana K. Wingfield a,b,⁎, Curt D. Storlazzi b a
University of California at Santa Cruz, Ocean Sciences Department, 1156 High Street, Santa Cruz, CA 95060, United States b US Geological Survey, Pacific Science Center, 400 Natural Bridges Drive, Santa Cruz, CA, United States Received 26 July 2005; received in revised form 20 January 2007; accepted 7 February 2007 Available online 12 February 2007
Abstract In the past two decades, the understanding of the important large-scale phenomena (El Niño, upwelling, California current, etc) that drive physical, chemical, and biological processes along the US West Coast has greatly improved. However, the ability to predict the influence of annual and inter-annual events on a regional scale still remains limited. High-resolution hourly data from 6 National Oceanographic and Atmospheric Administration (NOAA) buoys deployed since the early 1980's off Central California were analyzed to improve our understanding of spatial and temporal variability of oceanographic and meteorologic forcing along the coastline. Seasonal to inter-annual trends in wave height, wave period, sea level barometric pressure, sea-surface temperature, and wind direction were identified, as were significant departures in these trends during El Niño and La Niña periods. The results suggest there are increasing wave heights and wave periods, decreasing sea level barometric pressures and variability in sea-surface temperatures, and increasingly variable winds off Central California between 1980 and 2002. The impact of these climatic trends on coastal physical, geological and biologic processes will also be addressed. © 2007 Published by Elsevier B.V. Keywords: Waves; Storms; Sea-surface temperatures; Winds; El Niño; La Niña
1. Introduction The El Niño events between 1982–2002 (most notably in 1982–83 and 1997–98) have adversely affected the entire North American/Pacific coast (Komar, 1998). Studies by Seymour (1983) and Inman (1991) suggest that winter storm intensity and the
⁎ Corresponding author. Tel.: +1 831 459 2403. E-mail addresses:
[email protected] (D.K. Wingfield),
[email protected] (C.D. Storlazzi). 0924-7963/$ - see front matter © 2007 Published by Elsevier B.V. doi:10.1016/j.jmarsys.2007.02.008
resulting wave climate off Southern California have been increasing during the latter half of the 20th century. Allan and Komar (2000) and Bromirski et al. (2005) also note considerable inter-annual variability in stormgenerated wave heights, as well as a general trend in increasing wave heights in the eastern North Pacific. Central California thought to be a “transition zone” between high energy in the Pacific Northwest and milder wave conditions off Southern California. This increased storminess, as well as storms propagating at lower latitudes across the northeastern Pacific (Brewer and Jackson, 2000) lead to greater coastal erosion, with
458
D.K. Wingfield, C.D. Storlazzi / Journal of Marine Systems 68 (2007) 457–472
especially severe shoreline damage during El Niño years (Seymour et al., 1984; Komar, 1998; Storlazzi and Griggs, 2000). Schwing et al. (2002) observed the evolution of oceanic and atmospheric anomalies (i.e., sea-surface temperature [SST], sea level barometric pressure, wind, and wave activity) associated with El Niño/La Niña events in both the northeastern Pacific, as well as the California Current System (CCS). While some studies have focused on the large-scale biological–physical coupling in the CCS during El Niño years (Chelton et al., 1982; Lynn et al., 1998), other studies concentrate on the smaller, more localized impacts such as El Niño's effects on processes in Monterey Bay (Griggs and Johnson, 1983; Kudela and Chavez, 2000). Although our understanding of the important physical forcing that drive physical, chemical and biologic processes has improved over the past decade, our ability to predict the oceanographic and meteorologic forcing that drive these processes over large spatial and temporal scales in the “transition zone” off the U.S. West Coast remains limited. The deployment and continued maintenance of robust operational oceanographic deep water buoys by the National Oceanic and Atmospheric Administration (NOAA) since the 1980s provides large quantities of high-resolution, hourly data such as wave height, wave period, wind speed, wind direction, sea level barometric pressure, air temperature and sea-surface temperature. The data sets produced by these systems are now long enough in duration to clearly identify long-term trends and compute statistically significant probability estimates of the behavior of the measured parameters. Here we discuss the spatial and temporal variability in these parameters for 6 stations that center on the Central California transition zone (between Cape Mendocino and Point Conception) over seasonal to inter-annual (i.e., El Niño and La Niña) climatic cycles. This oceanographic and meteorologic forcing affects various aspects of nearshore physical and ecosystem dynamics along the continental shelf and shoreline of Central California. While a number of works have discussed the influence of spatial or temporal variability in a given forcing on a specific coastal process (e.g. Kudela and Chavez, 2000, winds on productivity; or Bromirski et al., 2005, storminess and wave climate), there have been limited investigations into the variability of the full suite of meteorologic and oceanographic processes that influence physical, chemical and/or biological processes in the nearshore over such a large spatial scale. Our goal here is not to detail the discovery of a specific new phenomena, but rather to highlight not only how meteorologic and oceanographic forcing varies in space and time along the
coastline of Central California, but also how the combination of these different mechanisms result in spatially and temporally varying contributions to nearshore geologic and biologic processes. 1.1. Overview of El Niño Southern Oscillation events The El Niño-Southern Oscillation (ENSO) cycle is an inter-annual phenomenon comprised of episodic El Niño and La Niña climatic events and is defined, in part, by the Southern Oscillation, which is a measure of the variation in sea level pressure changes across the tropical Pacific (Glantz, 2001). The average ENSO cycle has a period of about four years, although historical records have varied between two to seven years (Kousky and Bell, 2000). El Niño and La Niña events promote abnormally mild or severe seasonal conditions, and depending on the location, often cause floods, landslides, droughts, and severe beach and bluff erosion along the west coast of the United States (Komar, 1998). For decades, many scientists have noted the profound effect of the ENSO cycle on oceanographic and atmospheric processes off the West Coast of North America (Griggs and Johnson, 1983; Seymour, 1998; Brewer and Jackson, 2000; Allan and Komar, 2006), but only recently have we now begun to understand these events in greater detail with respect to the effects of ENSO on the U.S. West Coast's continental shelf. The Southern Oscillation Index (SOI) is a proxy used to determine the presence and strength of an ENSO event. A negative phase of the SOI represents an El Niño event, while a positive phase represents La Niña and the reverse air pressure gradients exist (Glantz, 2001). While the SOI is derived specifically from air pressure anomalies between Darwin, Australia and Tahiti, the Multivariate ENSO Index (MEI), devised by Wolter and Timlin (1998), incorporates multiple factors in order to give a weighted average of the main oceanic–atmospheric ENSO-related features. In addition to sea level pressure, other variables include seasurface temperature and surface air temperature, total cloudiness, and zonal (north-south) and meriodonal (east-west) components of surface winds. The MEI is read inversely of the SOI, with negative values representing cold ENSO phases (La Niña), while positive values represent warm ENSO phases (El Niño). 2. Study area This study focuses on 640 km of the Central California coastline from Eel River in the north to Point Conception in the south (Fig. 1). Central California has a rugged coastline characterized by coastal
D.K. Wingfield, C.D. Storlazzi / Journal of Marine Systems 68 (2007) 457–472
459
Fig. 1. Map of California displaying the location of the six NOAA deepwater buoys discussed in this study and the general morphology of California's continental shelf. Symbols correspond to the buoys used off the northern (square), central (circle), and southern (triangle) portions of the study area.
mountains cut by high sea cliffs, narrow river valleys and a narrow continental shelf. The distribution of sediment varies across the shelf, with the coarsest sediment found in both shallow depressions in the surf zone and at the shelf break (Anima et al., 2002; Edwards, 2002). Medium to fine-grained sediment is present offshore to depths of about 20 m, where large volumes of sand generally do not move in response to surface waves during most of the year (Dingler and Reiss, 2002). The offshore wave climate of California can be generally characterized by three regimes: the Northern Hemisphere swell, the Southern swell, and local wind-
driven seas. The Northern Hemisphere swell is typically generated by extra-tropical cyclones in the North Pacific. These swells generally occur during the winter months of November to March, in which deep water wave heights can exceed 8 m (National Marine Consultants, 1970). Southern swell is generated by winter storms in the Southern Ocean during the Northern Hemisphere's summer months or by hurricanes and tropical depressions off Central America during the Northern Hemisphere's summer and early fall. Although the southern swells produce very long periods (N 20 s), these waves tend to be much smaller
460
D.K. Wingfield, C.D. Storlazzi / Journal of Marine Systems 68 (2007) 457–472
Table 1 NDBC buoy station data Buoy name Station Latitude Longitude Water Data identification depth (m) types⁎ number EelRiver
46022
Pt. Arena
46014
San Francisco Half Moon Bay Cape San Martin Pt. Arguello
46026 46012 46028 46023
40°43′ 12″ N 39°13′ 00″ N 37°45′ 32″ N 37°21′ 28″ N 35°44′ 08″ N 34°42′ 50″ N
124°31′ 12″ W 123°57′ 57″ W 122°50′ 00″ W 122°52′ 53″ W 121°53′ 24″ W 120°58′ 00″ W
329.2 264.9 52.1 87.8 1111.9 384.1
a,c,d, e,f,g a,c,d, e,f,g a,c,d, e,f,g a,c,d, e,f,g a,c,d, e,f,g a,c,d, e,f,g
⁎Data types: a. Significant wave height (Hsig). b. Wave direction (WAVdir). c. Dominant wave period (Tdom). d. Sea-level barometric pressure (SLBpress). e. Water temperature (Wtemp). f. Wind speed (WNDspd). g. Wind direction (WNDdir).
than those produced by the Northern Hemisphere swell. Local, wind-driven swells develop rapidly in the winter when low-pressure systems track near Central California or in spring and summer when strong sea breezes are generated (Griggs and Johnson, 1979). 3. Methods Since the early 1980s, NOAA's National Data Buoy Center (NDBC) has deployed several buoys off the U.S. coast in order to monitor a variety of oceanographic and atmospheric parameters. This study focuses on 6 offshore buoys along the Central California coast. Online data sets are available from the NDBC (2006) website. These buoys record hourly data for various oceano-
graphic and meteorologic parameters, including: significant wave height (Hsig), dominant wave period (Tdom), sea level barometric pressures (SLBpres), sea-surface water temperature (Wtemp), and wind speed (Wspd) and direction (WNDdir). Table 1 gives the station location and data types for each buoy. Buoy locations are shown in Fig. 1. Other recorded parameters measured at the buoys but not discussed here include air temperature, dewpoint temperature, wind gust speed, average wave period, station visibility and pressure tendency. After two decades of data acquisition, these records are now long enough to determine significant patterns and long-term (decadal) trends in these parameters in the study area. In order to de-sample and increase the statistical significance of the data, we computed monthly means, minimums, maximums, and standard deviations for each parameter during each month of the entire data record. However, due to varying buoy deployment dates, buoy failure, and maintenance operations, there are some data gaps throughout the study period (Fig. 2). Gaps in the data due to buoy failure and/or maintenance range from several weeks to entire seasons. Initial deployment dates range from 1980 (Half Moon Bay #46012) to 1982 (Point Arguello #46023). When computing monthly statistics, it was important to have sufficient data by which to compare various buoys. In order to obtain equally weighted calculations, months with less than 480 h (20 days) worth of data were excluded from the analyses. The percentage of time the parameter was observed to exceed a given value over the course of the month was termed as its “monthly mean exceedence value”. These exceedence values were determined in order to identify periods of sustained extreme conditions in which cumulative effects were important for certain physical processes that might not be adequately described by the mean and standard deviation. These values were calculated by dividing the number of hours a given value of wave height and/or sea level pressure
Fig. 2. NDBC buoy data coverage throughout the entire study period (1980–2002). Data gaps are due to varying deployment dates, maintenance operations, and instrument failures. The colors correspond to the individual buoys’ data plots shown in part “a” of Figs. 4–12.
D.K. Wingfield, C.D. Storlazzi / Journal of Marine Systems 68 (2007) 457–472
Fig. 3. The CDC's (2004) Multivariate ENSO Index (MEI). The MEI shows negative values representing cold ENSO phases (La Niña conditions), Positive values represent warm ENSO phases (El Niño conditions).
were exceeded during the month by the total recorded hours of observation during each month. Monthly exceedence values for Hsig were computed for wave heights greater than 4 m, 6 m, and 8 m, and for SLBpres lower than 1000 mb, 990 mb, and 980 mb for each buoy. In this way, it was possible to determine the frequency and magnitude of monthly Hsig and SLBpres throughout El Niño events, La Niña events, and months of neither event (“normal” months). Wind directions along Central California are typically from the west-northwest at 270–359° (Inman and Jenkins, 1997), and are driven by the “North Pacific High”, a high pressure system that generally resides off Northern California during the spring and summer months. Observations of wind directions between 70 and 250° (WNDwsw) were of particular interest, as these would be counter to the normal, northwesterly wind direction. Winds from the southwest, in combination with Ekman steering, drive surface water onshore. This forces warm surface water to be forced onshore and downward, causing “downwelling” at the coastline. This has been shown to be significant to a number of physical processes (Inman and Jenkins, 1997; Storlazzi and Griggs, 2000; Storlazzi et al., 2002, 2004). Once computed, monthly statistics were separated into three regions of the study area: northern (Eel River #46022 and Point Arena #46014), central (San Francisco #46026 and Half Moon Bay #46012), and southern (Cape San Martin #46028 and Point Arguello #46023). The data from each region's buoys were equally weighted and averaged together to calculate regional values for all oceanographic and atmospheric parameters. These values included minimum, maximum, mean, standard deviation, observed exceedences, and long-term trends. While
461
averaging two buoys together to create northern, central, and southern regions might cause potential statistical errors by masking some important individual buoy variation in wave and wind parameters, smoothing the data gaps that range from weeks to months in one buoy record resulted in inaccurate analyses of both monthly and long-term trends. In order to understand how these oceanographic and meteorologic parameters were influenced by ENSO, monthly statistics were divided into categories based on the corresponding MEI values for each month. These categories included: all months of the study period, El Niño months, and La Niña months. MEI monthly values before 1993 were normalized in order to have an average of zero and a standard deviation of 1.0 (NOAA, Climate Diagnostics Center, 2004). MEI cutoff values were used to separate index values of El Niño, La Niña and “normal” months, months when neither El Niño nor La Niña conditions were observed. Any month when the MEI value was greater than 1.0 was defined as an El Niño month, any month when the MEI value was lower than − 0.5 was defined a La Niña month. Months when the MEI was less than 1.0 but greater than − 0.5 were defined as a normal month (Fig. 3). The monthly mean, standard deviation of the mean, and mean of the standard deviation of all parameters were matched with the corresponding MEI values for that month. In this way, it was possible to assign monthly numeric MEI intensities with concurrent buoy data in order to categorize the
Fig. 4. Monthly mean variability in Hsig. (a) All months of the study period. (b) The deviation from the mean during El Niño months. (c) The deviation from the mean during La Niña months. El Niño winter months typically have the greatest Hsig throughout the entire study period. Dashed lines represent one standard deviation.
462
D.K. Wingfield, C.D. Storlazzi / Journal of Marine Systems 68 (2007) 457–472
Fig. 5. Monthly mean variability in occurrence Hsig greater than 4 m. (a) All months of the study period. (b) The deviation from the mean during El Niño months. (c) The deviation from the mean during La Niña months. Note the greatest occurrences of Hsig greater than 4 m are in the late winter months of El Niño. Dashed lines represent one standard deviation.
oceanic and atmospheric parameters into El Niño months, La Niña months, or normal months.
the southern portion in February. In contrast, monthly mean Hsig during El Niño summer months are both smaller than normal summer months, and less variable than winter months with the lowest values for all regions in May (0.4 m lower than average). La Niña winters also have greater than normal monthly mean Hsig; however values are not as large as those found during El Niño winters (Fig. 4c). During La Niña winters, monthly mean Hsig range from 0.04 m to 0.4 m greater than normal winters. Peak swell occurs in the La Niña month of November for all regions of the study area. During this month, the southern region has the greatest monthly mean Hsig values, followed by the central and northern regions, respectively. Monthly mean Hsig during La Niña spring and summer months are typically smaller than normal spring and summer months (0.3 m smaller than average). Monthly Hsig values greater than 4 m are most frequent in the northern portion of the study area in December (Fig. 5a). At this time, observations of Hsig greater than 4 m represent 21.6% of the total monthly Hsig observations. Monthly Hsig values greater than 4 m in the southern portion are also most frequent in December, when they make up as much as 12.7% of the total monthly Hsig observations. Summer months had so few monthly observations of mean Hsig greater than 4 m that the percentages are not statistically significant.
4. Results 4.1. Wave height Spatially, monthly mean Hsig are greatest in the northern part of the study area. Seasonally, monthly mean Hsig are greatest in the winter months from November through February (Fig. 4a). Peak swell occurs in December, when values reach 3.0 m in the northern region and 2.6 m in the southern region. There is strong spatial variability in the winter months, as northern region mean Hsig values can be up to 0.4 m greater than southern region values. In contrast, mean Hsig are generally smaller in the summer months, with peak swell in June. At this time, monthly mean values reach 2.0 m in the northern portion of the study area, and 2.1 m in the southern portion of the study area. Throughout the study period, monthly mean Hsig are greatest during El Niño winters. During this time, monthly mean Hsig range from 0.3 m to 1.2 m greater than normal winters (Fig. 4b). Peak swell occurs in the El Niño month of February for all regions of the study area, yet monthly mean Hsig are spatially variable during this month. Monthly mean Hsig is almost half a meter higher in the northern portion of the study area than in
Fig. 6. Monthly mean variability in occurrence Hsig greater than 6 m. (a) All months of the study period. (b) The deviation from the mean during El Niño months. (c) The deviation from the mean during La Niña months. Note that the northern portion of the study area consistently has the greatest occurrences of Hsig greater than 6 m. Dashed lines represent one standard deviation.
D.K. Wingfield, C.D. Storlazzi / Journal of Marine Systems 68 (2007) 457–472
463
Table 2 Long-term trends in parameters: 1980–2002 Parameter Hsig
Tdom
SLBpres
Wtemp
WNDwsw
Region North Central South North Central South North Central South North Central South North Central South
Mean
Minimum
Maximum
Std. dev.
+2.0 cm/yr +2.1 cm/yr +1.9 cm/yr +0.039 s/yr +0.025 s/yr +0.045 s/yr −0.04 mb/yr −0.05 mb/yr N.S. +0.03 °C/yr N.S. −0.03 °C/yr +0.34%/yr N.S. +0.23%/yr
+0.9 cm/yr ⁎ +1.1 cm/yr N.S. +0.001 s/yr N.S. +0.03 s/yr − 0.14 mb/yr N.S. − 0.06 mb/yr +0.03 °C/yr N.S. − 0.02 °C/yr – – –
+5.7 cm/yr ⁎ +6.8 cm/yr +7.7 cm/yr +0.061 s/yr +0.037 s/yr +0.035 s/yr N.S. N.S. N.S. +0.02 °C/yr N.S. − 0.04 °C/yr – – –
+0.6 cm/yr ⁎ +0.8 cm/yr ⁎ +1.0 cm/yr ⁎ +0.006 s/yr ⁎ N.S. N.S. N.S. N.S. N.S. N.S. −0.01 °C/yr −0.01 °C/yr – – –
Significance exceeds 1% unless otherwise noted. N.S. — no significant trend (significance does not exceed 10% level). ⁎ Significance exceeds 5% level.
Throughout the study period, El Niño winter months have the most frequent observations of Hsig greater than 4 m (Fig. 5b). During February, Hsig observations greater than 4 m are 32.1% more frequent than average in the northern region and 14.6% more frequent than average in the southern region. Observations of Hsig greater than 4 m during La Niña months are less frequent and less variable than El Niño winter months (Fig. 5c). Like El Niño winters, monthly Hsig greater than 4 m are most frequent in February, ranging from 4.5% more frequent in the southern area to 9.7% more frequent in the northern portion of the study area. Monthly Hsig values greater than 6 m during normal months are most frequent in the early winter month of December, when they constitute 2.3% of total monthly observations in northern portion of the study area (Fig. 6a). During El Niño winter months, monthly Hsig greater than 6 m are most frequent in February, ranging from 1.2% more frequent than average in the southern portion of the study area to 4.0% more frequent in the northern part (Fig. 6b).In contrast to El Niño winter months, La Niña monthly Hsig greater than 6 m are most frequent in December (Fig. 6c). At this time, monthly Hsig greater than 6 m are 0.6% more frequent in the southern portion of the study area and 1.3% more frequent than average in the northern part. Long-term trends of mean Hsig values have increased 2.0 cm/yr on average for all regions (Table 2). Minimum, maximum, and standard deviation values of H sig also show statistically significant increases throughout the study period.
4.2. Wave period During normal winter months, mean Tdom values range from 12.1 s to 13.7 s, and 8.8 s to 10.9 s in the summer months (Fig. 7a). Peak values of mean Tdom occur in February for all regions of the study area.
Fig. 7. Monthly mean variability in Tdom. (a) All months of the study period. (b) The deviation from the mean during El Niño months. (c) The deviation from the mean during La Niña months. During El Niño months, mean Tdom is most variable in the late winter, while mean Tdom is most variable during La Niña months in the early winter. Dashed lines represent one standard deviation.
464
D.K. Wingfield, C.D. Storlazzi / Journal of Marine Systems 68 (2007) 457–472
portion of the study area has the greatest variability for monthly mean Tdom throughout the year for both El Niño and La Niña months. Long-term trends indicate a significant increase in mean Tdom for all regions of the study area (Table 2). Trends also show significant increases in minimum and maximum Tdom values for the northern and southern portions of the study area. 4.3. Sea-level barometric pressure
Fig. 8. Monthly mean variability in SLBpress. (a) All months of the study period. (b) The deviation from the mean during El Niño months. (c) The deviation from the mean during La Niña months. El Niño winter months exhibit lower SLBpress as well as greater variability than during La Niña winter months. Dashed lines represent one standard deviation.
During normal, non-ENSO years, mean SLBpres are highest in the winter (1017.52 mb to 1019.55 mb) and lowest in the summer (1014.26 mb to 1017.31 mb) (Fig. 8a). Mean SLBpres values during El Niño winters are typically lower than normal winters (Fig. 8b). Spatially, mean SLBpres are most variable in the El Niño month of February when values range between 1.81 mb lower than average in the southern part of the study area to 7.44 mb lower than average in the northern part. In contrast to the lower than average monthly mean SLBpres found during El Niño winters, La Niña winters have slightly higher than average monthly mean SLBpres. These values are greatest
Seasonally, mean Tdom values are shortest in July and August and longest in December and February. Spatially, annual mean Tdom values for non-ENSO years are 0.6 s longer in the southern portion than in the northern portion of the study area. Monthly mean Tdom during El Niño winters are typically 1.8 s longer than normal winter months (Fig. 7b). In addition, El Niño Tdom peak one month earlier, in January. Mean Tdom values for the southern part are generally the longest throughout the El Niño winter months until February. During this month the northern portion of the study area is the only region that has a significant deviation from normal February months (1.0 s longer than normal). The central and southern portions show almost no deviation from normal February months. Mean Tdom during El Niño summers are more variable, with values ranging from 0.5 s shorter than average to 0.4 s longer than average. During La Niña winters, peak Tdom occur in November, as values range from 1.1 s longer in the northern part to 1.3 s longer than normal in the southern part of the study area (Fig. 7c). Mean Tdom during La Niña months are shortest during February, ranging from 0.4 s to 0.6 s shorter than average throughout the study area. During La Niña summer months, monthly mean Tdom in the southern and central portions remain at or above average. The northern study area Tdom values remain slightly below average. In general, the southern
Fig. 9. Monthly mean variability in occurrence SLBpress below 1000 mb. (a) All months of the study period. (b) The deviation from the mean during El Niño months. (c) The deviation from the mean during La Niña months. While observations of mean SLBpress below 1000 mb are common during normal winter months, the frequency of observation is greatest during El Niño winter months, particularly January through March when storms are most common. Dashed lines represent one standard deviation.
D.K. Wingfield, C.D. Storlazzi / Journal of Marine Systems 68 (2007) 457–472
Fig. 10. Monthly mean variability in occurrence SLBpress below 990 mb. (a) All months of the study period. (b) The deviation from the mean during El Niño months. (c) The deviation from the mean during La Niña months. Note occurrences of mean SLBpress below 990 mb are observed more frequently in the northern portion of the study area during normal and El Niño winter months. Dashed lines represent one standard deviation.
during La Niña December, when mean SLBpress are 1.45 mb higher than average in the southern part and 2.48 mb higher than average in the northern part of the study area (Fig. 8c). In general, mean SLBpress tends to be less variable during El Niño and La Niña summers (Fig. 8b and c). The one exception is the central portion of the study area during the El Niño summers, in which monthly mean SLBpres values range from 1.27 mb below average in June to 4.06 mb above average in August. Throughout the study period, SLBpres less than 1000 mb are most frequent between November and March (Fig. 9a). There are almost no observed SLBpres less than 1000 mb during the remainder of the year. In the northern portion of the study area, mean SLBpres observations less than 100 mb are most frequent in December (3.27% of the month). In the southern region, observations of SLBpres below 1000 are most frequent in February (1.17% of the month). Monthly SLBpres values lower than 1000 mb can be as much as 7.42% more frequent during El Niño winter months than during normal winter months (Fig. 9b). The northern portion of the study area has the most frequent observations of SLBpres values lower than 1000 mb in February (7.42), while the central portion has the most frequent occurrences of SLBpres below 1000 mb in March (4.0%). In contrast, observations of SLBpres less
465
than 1000 mb occur less frequently during La Niña winters than normal winters (Fig. 9c). Throughout the study period, observations of SLBpres below 990 mb are infrequent (Fig. 10a). During normal months, SLBpres below 990 mb are most frequently observed in the northern part of the study area, but are so infrequent in the southern region that they are not statistically significant. The month of March typically has the most observations of SLBpres below 990 mb (0.3%). As with normal months, El Niño monthly SLBpres observations below 990 mb are most frequent in the northern part of the study area (Fig. 10b). These observations are up to 1.54% more frequent in February during El Niño winters than in normal winters. Conversely, La Niña winter months have even less frequent occurrences of monthly SLBpres than normal winter months (Fig. 10c). Although inter-annual events have varying affects on SLBpres, long-term trends show show a decrease in monthly mean SLBpres over the study period (Table 2). Monthly mean SLBpres decreased in the central and northern parts of the study area (0.05 mb/yr and 0.04 mb/yr, respectively), while in the southern region monthly mean SLBpres decreased at a slower rate of 0.01 mb/yr on average. The northern portion of the study area has the greatest SLBpres long-term variability (0.02 mb annual deviation from the mean) while the
Fig. 11. Monthly mean variability in Wtemp. (a) All months of the study period. (b) The deviation from the mean during El Niño months. (c) The deviation from the mean during La Niña months. Note warmer than normal mean Wtemp year-round during El Niño months and cooler than normal mean Wtemp during the La Niña winter months. Dashed lines represent one standard deviation.
466
D.K. Wingfield, C.D. Storlazzi / Journal of Marine Systems 68 (2007) 457–472
Fig. 12. Monthly mean variability in WNDwsw. (a) All months of the study period. (b) The deviation from the mean during El Niño months. (c) The deviation from the mean during La Niña months. El Niño months show greater than normal occurrences of WNDwsw than normal months, while La Niña months show a less than normal occurrences of WNDwsw. Dashed lines represent one standard deviation.
The coldest Wtemp for all study area regions are in the northern part of the study area. Between the spring and early summers, Wtemp in this area cools down to 10.7 °C (April). The warmest monthly mean Wtemp occur in August and September, as temperatures range from 13.1 °C in the northern part of the study area to 15.5 °C in the southern part. Monthly mean Wtemp from November to February typically vary between 12.1 °C in the northern region and 13.8 °C in the southern region. This results in a spatial gradient of almost 2 °C between northern (colder) and southern (warmer) parts of the study area. Monthly mean Wtemp during El Niño months are warmer than normal months throughout the entire year (Fig. 11b). In the winter, monthly mean Wtemp are up to 1.5 °C and 1.8 °C warmer than average in the spring and summer. All three regions have their greatest deviations from the mean in May, as the northern part of the study area is 1.7 °C warmer than average, the central part is
southern and central portions of the study area have became less variable. Monthly maximum SLBpres decreased by 0.04 mb/yr on average in the central region, and in the southern region (0.02 mb/yr on average). Monthly minimum SLBpres decreased in all regions of the study area; the northern part of the study area, however, decreased almost twice as fast as the southern part of the study area (0.14 mb/yr and 0.06 mb/ yr, respectively). In addition to decreasing monthly mean, maximum and minimum SLBpres and increasing monthly mean SLBpres variability, the results suggest that observations of SLBpres less than 1000 mb and 990 mb increased throughout the study period. Observations of SLBpres below both 1000 mb and 990 mb increased 0.030% per year in the northern part of the study period, while observations in the central part decreased slightly. Rates for SLBpres below 1000 mb and 990 mb n the southern portion of the study area were not significant. 4.4. Sea-surface water temperature The distribution of monthly mean Wtemp in the study area are shown in Fig. 11a. The coolest monthly mean Wtemp tend to be during the spring and early summers, with Wtemp values of 11.2 °C in the northern part of the study area, and 13.1 °C in the southern part.
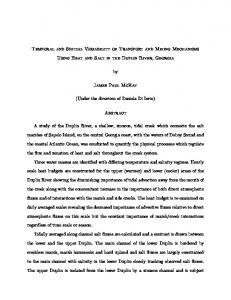
Fig. 13. Long-term monthly mean Hsig values for all 6 offshore buoys from 1982–2002. Data gaps represent varying buoy deployment dates, buoy failure, and maintenance operations throughout the study period.
D.K. Wingfield, C.D. Storlazzi / Journal of Marine Systems 68 (2007) 457–472
1.8 °C warmer than average, and the southern part is 1.1 °C warmer than average. In contrast, La Niña winters exhibit cooler than average monthly mean Wtemp. In the northern part of the study area, monthly mean Wtemp is 0.6 °C cooler than average, and the central and southern parts are 1.0 °C and 1.0 °C cooler than average (Fig. 11c). In addition, monthly mean Wtemp are coolest during the La Niña month of March, when monthly mean Wtemp are up to 1.3 °C below average. Long-term trends suggest monthly mean Wtemp have become increasingly warmer in the northern part of the study area, while monthly mean Wtemp have become increasingly cooler in both central and southern parts (Table 2). Overall, the variability in monthly mean Wtemp, has decreased over the study period. Long-term monthly maximum Wtemp are less spatially variable throughout the study area, with monthly maximum Wtemp increasing in the northern part of the study area while monthly maximum Wtemp in the central and southern parts decreased. In addition, monthly minimum Wtemp increased in both the northern and central parts of the study area, while the southern region decreased.
467
In contrast, La Niña winter months typically have less than average observations of WNDwsw (Fig. 12c). During La Niña events, the southern part of the study area has 3.8% fewer than average occurrences of WNDwsw in November while the northern part has 17.6% more frequent occurrences of WNDwsw than average. From January through March, the northern and southern regions have between 4.8% and 15.9% less than average monthly occurrences of WNDwsw. During the same months, the central portion of the study area has up to 12.8% more monthly occurrences of WNDwsw. Long-term trends show that the monthly occurrences of WNDwsw have increased over the study period (Table 2). The highest rates were in the northern part of the study area, where the percentages of WNDwsw increased 0.3%/yr on average. Occurrences in the southern and central parts of the study area increased 0.2%/yr and 0.1%/yr on average, respectively. As these trends continued over the study period, the spatial gradient of WNDwsw between northern and central parts of the study area increased. 5. Discussion
4.5. Winds from the southwest 5.1. Spatial and temporal trends Throughout the year, WNDwsw are observed most frequently in the winter months (Fig. 12a). The percentage of WNDwsw is greatest between November and February as WNDwsw are observed up to 68.1% of the month in the northern part of the study area, and up to 45.9% of the month in the southern part of the study area. During these winter months, the north-to-south spatial gradient is largest in December, as the northern part of the study area has 29.5% more occurrences of WNDwsw than the southern part. By April, the spatial gradient decreases to only 4.9% more occurrences in the northern part of the study area than the southern part. In addition, there are much fewer percentages of WNDwsw during the spring and summer months. The occurrences of WNDwsw are greatest during El Niño winters, however the month with the greatest observations of WNDwsw varies by region (Fig. 12b). The southern part of the study area has the greatest percentage of WNDwsw earlier in the winter (December). At this time, WNDwsw observations are up to 21.1% more frequent than average. In the late El Niño winter (February), the central part of the study area has the greatest percentage of WNDwsw, with observations 20.7% more frequent than average. WNDwsw in the northern part of the study period is greatest during April, with WNDwsw observations 26.5% more frequent than average.
The results of this study indicate significant statistical trends throughout the study period for the following parameters: significant wave height (Hsig), dominant wave period (Tdom), sea level barometric pressure (SLBpres), water temperature (Wtemp), and winds from the southwest (WNDwsw). Storms during normal winter months typically track across the northeast Pacific, with peak storminess during December and January. In general, there are greater monthly mean Hsig and shorter monthly mean Tdom in the northern part of the study area and smaller monthly mean Hsig, and longer monthly mean Tdom waves in the southern part of the study area. Winds tend to be more variable (more WNDwsw) in the northern portion of the study area, as westerly and southwesterly winds are associated with both winter storm activity (Bixby, 1962) and the relative latitude of the North Pacific High during the summer. The development of the North Pacific High in normal summers results in lower monthly mean Hsig and Tdom throughout the study area, as wave conditions are milder during the summers. Pronounced spatial variation in monthly mean SLBpres between the northern portion and the southern of the study area is due to the location of the North Pacific High. The lower SLBpres values in the southern portion are due to not only tropical cyclone activity off Mexico and Central America during normal summer months, but also the Mexican
468
D.K. Wingfield, C.D. Storlazzi / Journal of Marine Systems 68 (2007) 457–472
monsoon, a seasonal reversal of atmospheric circulation that transports moisture from the Gulf of California to the southwestern U.S. As expected, the spatial variation in monthly mean Wtemp shows cooler temperatures in the northern portion of the study area and warmer temperatures in the southern portion of the study area year-round. During El Niño events, significant changes in wind and wave behavior are observed throughout the “transition zone” between the northern and southern portion of Central California. Winter El Niño storms tend to track further to the south, striking California more directly and resulting in larger monthly mean Hsig and longer monthly mean Tdom throughout Central California. In addition the lower, more variable monthly mean SLBpres and greater frequency of WNDwsw also suggest more frequent and bigger storms tracking through the study area during El Niño events. Because the largest, most intense storms during El Niño winters strike the coastline later in the winter season (February), when beaches are already denuded of much of their sediment by earlier storms as well as the significant increase in Hsig greater than 4 m and 6 m, these storms result in disproportionately heavier beach erosion and damage to infrastructure along the coast than during normal or La Niña winters, as discussed by Seymour et al. (1984), Flick (1998), the USGS/UCSC/NASA/NOAA Collaborative Research Group (1998), and Storlazzi and Griggs (1998, 2000). La Niña events tend to have a less direct impact in the “transition zone”, as storm tracks are further north and result in smaller monthly mean Hsig than during El Niño winters (yet sometimes still larger than normal winter months) and less variable SLBpres and WNDwsw. Consequently, during La Niña the strongest storms and largest waves strike earlier in the winter (November) when the beaches are larger and can therefore better buffer the coastal cliffs and infrastructure than later in the winter. For this reason, La Niña winters bring less frequent and earlier storminess than either El Niño or normal months and thus generally result in less coastal erosion (Storlazzi and Griggs, 2000). Long-term trends suggest monthly mean Hsig increased on average 2.0 cm/year throughout Central California over the study period. These results differ from previous observations by Allan and Komar (2000), which stated that there was no significant long-term increase in Hsig off the coast of Central California. Lower monthly mean SLBpres, longer monthly mean Tdom, as well as increasing WNDwsw suggest increased storminess and storm intensity over the study period. Monthly mean Wtemp have become less variable, resulting a more homogenous Wtemp distribution along Central California.
The Pacific Decadal Oscillation (PDO), a term coined by S. Hare (as noted in Mantua, 1997), has been described as an inter-decadal change in climate that results in large-scale ocean-atmosphere variability (see Latif and Barnett, 1994; Francis et al., 1998; Miller and Schneider, 2000; Hare and Mantua, 2000; Mantua and Hare, 2002; Mestas-Nunez and Miller, 2006). Because phases tend to last between 20–30 years, with the last warm phase starting in 1977, some believe that a phase shift occurred with the demise of the 1997/98 El Niño and the subsequent inception of the 1998/99 La Niña event (Hare and Mantua, 2000; Schwing and Moore, 2000). The warm phase of the PDO is marked by unusually warm SST along the west coast of the United States and low SLBpres over the North Pacific, a result of a deepened Aleutian Low, which enhance counterclockwise winds (Mantua et al., 1997). A cold phase PDO exhibits high SLBpres over the North Pacific and cooler Wtemp along the northeastern and tropical Pacific. Whereas a warm PDO phase is considered to represent “El Niño-like” periods, a shift to a cool phase PDO would result in more frequent, stronger, and longer La Niña events with shorter, weaker El Niño events (Mantua and Hare, 2002). Our data extends from 1980 to 2002, essentially one warm phase of the PDO. Statistically significant longterm trends of the wave and wind parameters along Central California indicate increased and more direct storminess due to a deepened Aleutian Low. Although this may represent a potential bias as almost all observations were taken during a warm PDO phase, results from this work include data past the 1998 regime shift and show continued signs of increased storminess, and long-term trends show decreasing monthly mean SLBpres and increasing frequency WNDwsw. Graham and Diaz (2001) observed a 50-year trend in the intensification of winter cyclones in the North Pacific since 1948. They attributed the more cyclone-favorable environment to increasing upper-tropospheric midlatitude winds and wind stress, a result of changes in tropical SSTs over inter-annual to inter-decadal time scales. It is generally believed that there is less storminess along the US West Coast during cold PDO cycles. Our results include the inception of the shift from a warm to cool PDO, but as we continue into a cold phase of the PDO cycle we could begin to see a reversal of the trends that may coincide with La Niña-like conditions. An example is Fig. 13, which shows long-term monthly mean Hsig values for each offshore buoy over the entire study period. We would expect that with the onset of a cold PDO phase in 1999, such parameters as Hsig should
D.K. Wingfield, C.D. Storlazzi / Journal of Marine Systems 68 (2007) 457–472
begin to decrease. However, monthly mean Hsig values from 1999–2002 are of the same order of magnitude as Hsig values during the warm PDO phase, suggesting that Hsig did not decrease in within the study area. Several studies have questioned the role of anthropogenic effects on increased storm activity. Simulations by Hall et al. (1994) showed increased eddy activity near the downstream of storm tracks under increased levels of carbon dioxide concentrations (Graham and Diaz, 1998). Zhang et al. (1997) suggested little or changing activity due to the reduction of equator to pole temperature gradient associated with global warming. Although our results indicate increased storminess throughout the last warm PDO and into the latest cold PDO phase, these data alone are not sufficient to characterize the future state of the US West Coast climate regime. It is currently unknown what direct or indirect anthropogenical effects might have on natural decadal oscillations. Given the variation between models and results, and the short time scale of our long-term trends compared to other data sets, it is not possible at this time to relate our results to influences in global warming. 5.2. Physical and biological implications During the normal and La Niña spring and early summer months, persistent northwesterly winds cause cold, nutrient-rich water to upwell along the coastline of Central California, promoting a decrease in Wtemp. The small Hsig during these periods do not vigorously mix the water column, allowing for strong thermal stratification to develop. As shown by Storlazzi et al. (2002), this vertical stratification allows for more high-frequency internal waves to propagate inshore, potentially transporting biologically important material (nutrients, plankton, etc.) onshore via the mechanisms described by Pineda (1994a,b) and McManus et al. (2005). However, during El Niño spring and early summer months, increased WNDwsw cause a relaxation of northwesterly winds, allowing warm surface water to propagate onshore and cause upwelling to shut down. This “downwelling” along the coast causes the entire water column to warm and results in a reduction in vertical stratification. During El Niño winter months, the combination of increased WNDwsw Coriolis forcing drive surface water onshore, causing higher than-normal seasurface heights at the shoreline (Flick, 1998) and driving downwelling coastal flows. The larger than normal Hsig and longer than normal Tdom force even more water up onto the shoreline, further intensifying downwelling along the shoreface (Saur, 1962). Besides causing offshore-directed near-bed coastal flows, this wave- and
469
wind-induced setup at the shoreline increases beach pore fluid pressures and thus the mobilization of beach sediment. These larger than normal Hsig, and longer than normal Tdom increase the wave-induced shear stresses and thus the suspension of seafloor sediment, which is carried offshore by the downwelling near-bed offshore currents driven by the increased WNDwsw, similar to that observed by Wright (1987) off the U.S. East Coast. Allan and Komar (2006) noted the decadal increase in wave heights and swash run up levels along the Pacific Northest during El Niño. Their results indicated these decadal increases in monthly water levels, coupled with elevated tides were strong are only enhancing beach erosion during El Niño winter months. Climatic changes such as El Niño and La Niña events have significant impacts on population dynamics and community structure, ranging from temperature effects on metabolic rates, to movements of planktonic larvae by local currents, to changes in nutrient cycline and water column stratification (McGowawn et al., 1998). Often, El Niño events signify a decrease in the abundance of zooplankton, invertebrates, and many fish species. For example, the lack of strong thermal and density stratification during El Niño months does not allow for the propagation of high-frequency internal waves into the nearshore, which can affect zooplankton distribution (Storlazzi et al., 2002). Interestingly, El Niño events can also promote biological activity. McManus et al. (2003) and Storlazzi et al. (2004) show that certain species of nearshore rockfish preferentially recruit during these “downwelling” events, possibly being advected onshore as the WNDwsw transports higher Wtemp laden with the juvenile rockfish onshore due to Coriolis forcing. The long-term trends of WNDwsw and Wtemp are of great significance to the biologic community. Increasing WNDwsw frequency implies that these “downwelling” events would be more common, altering both the supply of and the mechanisms transporting biologically important material to the nearshore. The trend towards greater alongshore homogeneity of Wtemp will likely result in changes in the spatial distribution of many nearshore species, many of which are spatially defined by Wtemp. For example, Lonhart and Tupen (2001), and Schiel et al. (2004) observed significant communitywide changes in more than 150 benthic species as a direct effect of local ocean warming off Central California. These papers showed not only a northern migration of warmer-water species, but also a significant alteration in community structure. Interdecadal oscillations also have an impact on biological communities, as discussed in Mantua et al.
470
D.K. Wingfield, C.D. Storlazzi / Journal of Marine Systems 68 (2007) 457–472
(1997), Francis et al. (1998), Latif et al. (1998), Miller and Schneider (2000), Hare and Mantua (2000), and with many others. For example, Mantua et al. (1997) examined the dramatic changes in salmon production with climate regime shifts, with warm PDO phases favoring some fish species (e.g. pink and sockeye salmon) but causing declines in others (e.g. Coho and Chinook salmon). As we begin to know more about the roles of inter-annual and inter-decadal physical forcing on marine ecosystems, we can use the knowledge of such data to advise fisheries management in safe and optimal catch levels. 6. Conclusions Over 20 years of hourly deepwater buoy data from off Central California were analyzed to investigate long-term trends and compute statistically significant probability estimates of the behavior of the measured oceanographic and meteorologic data during different climatic regimes. Significantly different trends were observed in the data during El Niño and La Niña months, reinforcing the longheld but relatively unsupported theories on the differencing in oceanographic and meteorologic forcing along Central California during different phases of the Southern Oscillation. Because storms track directly across California during El Niño months, Hsig are greater, with up to 150% more frequent observations of Hsig greater than 4 m. In addition, Tdom are shorter, SLBpress are lower, and Wwsw are more frequent, suggesting greater storminess and storm proximity. These intense conditions impact the Central California “transition zone” most significantly during El Niño winter months. The combination of greater Hsig and Wwsw results in a breakdown of the thermal stratification leading to a more well-mixed water column. Wwsw also drive water onshore, in conjunction with the larger than normal Hsig, and cause increased offshore transport of beach sediment. Because storminess is greater in the late winter months of El Niño, beaches are already denuded from winter storms and thus greater storm damage occurs than during average winters. In addition, the breakdown of the thermal stratification along the coastline during El Niño spring and summer months correlates with warmer than average sea-surface temperatures (+Wtemp). This, in combination with greater than normal Wwsw, shuts down upwelling and promotes downwelling, resulting in potentially greater onshore transport of biologically important material and less high-frequency internal waves and thin layers along the Central California coast. In contrast, La Niña winter months have less of a direct impact on the Central California “transition
zone” as Hsig are smaller than during El Niños and storminess tends to be earlier and more often impact the U.S. West Coast in the Pacific Northwest. Mean Wtemp are cooler than average during the spring and summer months during La Niña as northwesterly winds predominate (− Wwsw), causing increased upwelling, but more high-frequency internal waves and thin biological layers. Significant long-term trends from our study suggest that Hsig and WNDwsw increased, Tdom and SLBpres decreased and Wtemp became less spatially variable along the study area. These results show that the “transition zone” off Central California, from the more energetic waves to the north and milder wave conditions to the south, is actually more energetic than once thought. With seasonal, interannual and long-term data, this work has opened up the possibility to better predict the spatial and temporal variability in oceanographic and meteorologic forcing and the resulting influence on physical, geological and biological processes along the Central California coast. Acknowledgements This work was carried out as part of the USGS's Central California Regional Synthesis Project and Benthic Habitats Project as part of an effort to better understand the impact of geologic and oceanographic processes on Central California's shoreline. We would like to thank Jane Reid (USGS), who overextended herself in helping us with geospatial data analysis. We would also like to thank Gary Griggs (UCSC), Bruce Richmond (USGS), and Guy Cochrane (USGS), who contributed numerous excellent suggestions and a timely review of our work and the comments from 3 anonymous reviewers whose comments and suggestions greatly improved earlier drafts of this work. References Allan, J., Komar, P.D., 2000. Are ocean wave heights increasing in the eastern North Pacific? EOS, Transactions of the American Geophysicalfs Union 81, 561–567. Allan, J., Komar, P., 2006. Climate controls on US west coast erosion processes. Journal of Coastal Research 22 (3), 511–529. Anima, R.J., Eittreim, S.L., Edwards, B.D., Stevenson, A.J., 2002. Nearshore morphology and late Quarternary geologic framework of the northern Monterey Bay Marine Sanctuary California. Marine Geology 181, 35–54. Bixby, H.C., 1962. Storms causing harbor and shoreline damage through wind and waves, Monterey California. Masters thesis, Naval Postgraduate School, Monterey, California, 145 pp. Brewer, I., Jackson, P.J., 2000. A spatial and temporal analysis of Pacific Northwest storms 1973–1998: a characterization of El Niño's variable magnitude and spatial impacts on coastal erosion processes. Journal of Climatology 1–26.
D.K. Wingfield, C.D. Storlazzi / Journal of Marine Systems 68 (2007) 457–472 Bromirski, P.D., Cayan, D.R., Flick, R.E., 2005. Wave spectral energy variability in the Northeast Pacific. Journal of Geophysical Research-Oceans. Chelton, D.B., Bernal, P.A., McGowan, J.A., 1982. Large-scale interannual physical and biological interaction in the California Current. Journal of Marine Research 40, 1095–1125. Climate Diagnostics Center, National Oceanographic and Atmospheric Administration 2004. Electronic Data, http://www.cdc.noaa.gov/. Dingler, J.R., Reiss, T.E., 2002. Changes to Monterey Bay beaches from the end of the 1982–1983 El Niño. Marine Geology 181, 249–263. Edwards, B.D., 2002. Variations in sediment texture on the northern Monterey Bay National Marine Sanctuary shelf. Marine Geology 181, 83–100. Flick, R.E., 1998. Comparison of California tides, storm surges, and mean sea level during the El Niño winters of 1982–83 and 1997–98. Shore and Beach 66 (3), 7–11. Francis, R.C., Hare, S.R., Hollowed, A.B., Wooster, W.S., 1998. Effects of inter-decadal climate variability on the oceanic ecosystems of the NE Pacific. Fisheries Oceanography 7 (1), 1–21. Graham, N.E., Diaz, H.F., 2001. Evidence for intensification of North Pacific winter cyclones since 1948. Bulletin of the American Meteorological Society 82, 1869–1893. Griggs, G.B., Johnson, R.E., 1979. Coastal erosion, Santa Cruz County. California Geology 32, 67–76. Griggs, G.B., Johnson, R.E., 1983. Impact of 1983 storms on the coastline of Northern Monterey Bay, Santa Cruz County. California Geology 36, 163–174. Glantz, M.H., 2001. Currents of Change: Impacts of El Niño and La Niña on Climate and Society. Cambridge University Press. 252 pp. Hall, N.M.J., Hoskins, B.J., Valdes, P.J., Senior, C.A., 1994. Storm tracks in a high-resolution GCM with doubled carbon dioxide. Quarterly Journal of the Royal Meteorological Society 120, 1209–1230. Hare, S.R., Mantua, N.J., 2000. Empirical evidence for North Pacific regime shifts in 1977 and 1989. Progress in Oceanography 24, 6–14. Inman, D.L., 1991. Budget of sediment and prediction of the future state of the coast. State of the Coast Report, San Diego Region, Coast of California Storm and Tidal Waves Study, vol. 1. US Army Corps of Engineers, Los Angeles District. Chap. 9. Inman, D.L., Jenkins, S.A., 1997. Changing Wave Climate and Littoral Drift. California and World Ocean,'97, Conference Proceedings, Chap. 73, pp. 539–549. Komar, P.D., 1998. El Niño and coastal erosion in the Pacific Northwest. Oregon Geology 60 (3), 57–64. Kousky, V.E., Bell, G.D., 2000. Causes, predictions, and outcome of El Niño 1997–1998. In: Chagnon, S.A. (Ed.), El Niño 1997–1998. Oxford Press, New York, pp. 28–48. Kudela, R.M., Chavez, F.P., 2000. Modeling the impact of the 1992 El Niño on new production in Monterey Bay, California. Deep-Sea Research. Part 2. Tropical Studies in Oceanography 47, 1055–1076. Latif, M., Barnett, T.P., 1994. Causes of decadal climate variability over the North Pacific and North America. Science 266 (5185), 634–637. Lonhart, S.I., Tupen, J.W., 2001. New range records of 12 marine invertebrates: the role of El Niño and other mechanisms in southern and Central California. Bulletin of the Southern California Academy of Sciences 100 (3), 238–248. Lynn, R.J., Baumgartner, T., Collins, C.A., Garcia, J., Hayward, T.L., Hyrenbach, K.D., Mantyla, A.W., Murphree, T., Shankle, A., Schwing, F.B., Sakuma, K.M., Tegner, M., 1998. The state of the California Current, 1997–1998: transition to El Niño conditions.
471
California Cooperative Oceanic Fisheries Investigations. Data Report 39, 25–49. Mantua, N.J., Hare, S.R., Zhang, Y., Wallace, J.M., Francis, R.C., 1997. A Pacific inter-decadal climate oscillation with impacts on salmon production. Bulletin of the American Meteorological Society 78 (6), 1069–1079. Mantua, N.J., Hare, S.R., 2002. The Pacific Decadal Oscillation. Journal of Oceanography 59, 35–44. McGowawn, J.A., Cayan, D.R., Dorman, L.M., 1998. Climate-ocean variability and ecosystem response in the northeast Pacific. Science 281, 210–217. McManus, M.A., Storlazzi, C.D., Carr, M.H., Raimondi, P.T., Amman, A., 2003. Linking the recruitment dynamics of temperate reef fish populations to coastal physical processes. Opening the Black Box: Understanding Ecosystem Dynamics in Coastal Oceans, American Academy for the Advancement of Science Symposium, February 2003, Denver, Colorado. McManus, M.A., Cheriton, O.M., Drake, P.J., Holliday, D.V., Storlazzi, C.D., Greenlaw, C.E., Donaghay, P.L., 2005. Thin layers and the transport and retention of marine plankton in coastal systems. Marine Ecology. Progress Series. Mestas-Nunez, A.M., Miller, A.J., 2006. Interdecadal variability and climate change in the eastern torpical Pacific: a review. Progress in Oceanography 69, 267–284. Miller, A.J., Schneider, N., 2000. Interdecadal climate regime dynamics in the North Pacific Ocean: theories, observations, and ecosystem impacts. Progress in Oceanography 47, 355–379. National Data Buoy Center, 2004, Historical Data, Northwest USA: http://www.ndbc.noaa.gov/maps/northwest_hist.shtml. National Marine Consultants, 1970. Wave statistics for seven deep water stations along the California coast. Report prepared for the U.S. Army Corps of Engineers, Los Angeles and San Francisco Districts, 20 pp. National Oceanic and Atmospheric Administration, 2004. EL Niño/La Niña pages: http://www.elNiño.noaa.gov and http://www.pmel. noaa.gov/tao/elNiño-homt.html. Pineda, J., 1994a. Internal tidal bores in the nearshore: warm fronts, seaward gravity currents and the onshore transport of neustonic larvae. Journal of Marine Research 52, 427–458. Pineda, J., 1994b. Circulation and larval distribution in internal tidal bore warm fronts. Limnology and Oceanography 44 (6), 1400–1414. Saur, J.F.T., 1962. The variability of monthly mean sea level at six stations in the eastern North Pacific. Journal of Geophysical Research 67, 2781–2790. Schiel, D.R., Steinbeck, J.R., Foster, M.S., 2004. Ten years of induced ocean warming causes comprehensive changes in benthic marine communities. Ecology 85 (7), 1833–1839. Schwing, F.B., Moore, C., 2000. A year without a summer for California, or a harbinger of a climate shift? EOS Transactions of the American Geophysical Union 81 (301), 304–305. Schwing, F.B., Murphee, T., deWitt, L., Green, P.M., 2002. The evolution of oceanographic and atmospheric anomalies in the northeastern Pacific during the El Niño and La Niña events of 1995–2001. Progress in Oceanography 54, 459–491. Seymour, R.J., 1983. Extreme waves in California during winter, 1983. State of California, Department of Boating and Waterways Report. 6+ pp. Seymour, R.J., Strange, R.R., Cayan, D.R., Nathan, R.A., 1984. Influence of El Niños on California's wave climate. Proceedings of the 19th Coastal Engineering Conference: American Society of Civil Engineers vol. 1, 577–592.
472
D.K. Wingfield, C.D. Storlazzi / Journal of Marine Systems 68 (2007) 457–472
Storlazzi, C.D., Griggs, G.B., 1998. The 1997–98 El Niño and erosion processes along the central coast of California. Shore and Beach 66 (3), 12–17. Storlazzi, C.D., Griggs, G.B., 2000. Influence of El Niño-Southern Oscillation(ENSO) events on the evolution of Central California's shoreline. GSA Bulletin 112 (2), 236–249. Storlazzi, Curt D., Dekshenieks, Margaret M., Carr, Mark H., Raimondi, Pete T., Figurski, Jared D., 2002. Temporal and spatial variations in the thermal and current structure on the inner shelf of the Monterey Bay National Marine Sanctuary. Monterey Bay National Marine Sanctuary Symposium, 2002. Storlazzi, C.D., Wingfield, D.K., McManus, M.A., Carr, M.H., 2004. Variability in oceanographic and meteorologic forcing along
Central California and its implications on nearshore physical and biological processes. 21st PACLIM Proceedings, p. 36. USGS/UCSC/NASA/NOAA Collaborative Research Group, 1998. A collaborative program to investigate the impacts of the 1997–98 El Niño winter along the California coast. Shore and Beach 66 (3), 24–32. Wolter, K., Timlin, M., 1998. Measuring the strength of ENSO-how does 1997/98 rank? Weather 53, 315–324. Wright, L.D., 1987. Shelf-surfzone coupling: diabathic shoreface transport. Coastal Sediments’ 87, American Society of Civil Engineers 1, 25–40. Zhang, Y., Wallace, J.M., Battisti, D.S., 1997. ENSO-like decadal variability: 1900–1993. Journal of Climate 10, 1004–1020.