Nov 4, 2003 - that has recorded the historical weather conditions that affect agriculture and ... term precipitation around Beijing, north China and the long-term ...
Theor. Appl. Climatol. 76, 13–29 (2003) DOI 10.1007/s00704-003-0009-4
1
Monsoon & Environment Research Group, Department of Atmospheric Sciences, Peking University, Beijing, China Earth Sciences Centre, Gothenburg University, Department of Earth Sciences, University of Gothenburg, Sweden 3 Bureau of Hydrology, Changjing Water Resources Commission, Wuhan, China 4 National Climate Center, China Meteorological Administration, Beijing, China 2
Temporal and spatial variability of dryness=wetness in China during the last 530 years W.-H. Qian1 , D. Chen2;4 , Y. Zhu1 , and H.-Y. Shen3 With 15 Figures Received April 22, 2002; revised March 24, 2003; accepted May 6, 2003 Published online November 4, 2003 # Springer-Verlag 2003
Summary The main characteristics of spatial and temporal variability of dryness and wetness during the last 530 years (1470– 1999) are classified over five centuries. They have been investigated by using 100-site dryness=wetness index data that has recorded the historical weather conditions that affect agriculture and living conditions in eastern China. A set of principal modes of spatial variability and time coefficient series describing the dominant temporal variability are extracted by a diagnostic method, the rotated empirical orthogonal function (REOF) analysis. The longterm precipitation around Beijing, north China and the long-term runoffs in the middle Yangtze River are used to confirm the dry=wet variability in north China and the midlow Yangtze River over the last two centuries. When considering the data from the last 530 years as a whole, the first two modes of dryness=wetness variability are found in the mid to low sections of two major valleys in eastern China, the Yellow and Yangtze River valleys. These valleys experienced the largest dryness=wetness variability in the history of eastern China. The third and fourth modes are located in northwest and northeast China. The fifth and sixth modes are situated in south and southwest China. However, over the last 500 years the strength and location of principal modes have experienced significant changes. During the 20th century, the first mode is found in the lower Yangtze River valley, the second mode in south China while the third mode is located in the mid-low Yellow River valley. During the 19th century, the first three modes are situated in the mid-low Yellow River, the mid-low Yangtze River and
south China, respectively. The first two modes in the 18th century are located in the mid-low Yellow River and the midlow Yangtze River valleys. The largest change of all modes occurred in the 17th century with the first mode in northeast China, the second mode in northwest China, and the third mode in the mid-low Yangtze River valley. During the 16th century, the first two modes are found in the mid-low Yangtze River and the mid-low Yellow River valleys. In each of the last five centuries, some special dryness= wetness processes are characterized in the mid-low Yangtze River and the mid-low Yellow River (north China). During the 20th century, continuous and severe wetness is experienced in the mid-low Yangtze River in the last two decades. A two-decade wetness period in north China was followed by a severe dry period in the late 19th century. Inter-annual variability, decade and two-decade oscillations of dryness= wetness are experienced in the series of different modes from one century to another. Dry=wet variations in north China and the middle Yangtze River are confirmed by series of data on local precipitation and runoff.
1. Introduction Because the period of records using instruments is too short for centennial climate change studies, it is of fundamental importance to find other ways to reconstruct the climate of the past. Such a reconstruction is based on historical information
14
W.-H. Qian et al.
of natural or social phenomena sensitive to climate such as continuous quantitative series of climatic elements, mainly temperature and precipitation (Wang et al., 1981). Useful information in historical documents containing descriptions of severe drought, floods, severe cold, heavy snow storms and unusually warm winters, etc in China (Zhang, 1988; Wang et al., 1991) have been used. Since the 1970s, Chinese climatologists have collaborated and extracted climatic information from over 2000 historical documentary records dating back to 1470. These records include a government weather book ‘‘Clear weather and Rain Records’’, local government severe dry-wet disaster reports and private diaries. A result of this effort is the Yearly Charts of Dryness-Wetness in China for the Last 500 Years (Central Meteorological Bureau, 1981). This dataset now covers each summer in the 530 years from 1470 to 1999 for 120 sites in China. The summer season climate (May–September) is categorized into dry and wet using a dryness=wetness Index (DW-Index) on a scale 1 to 5, from very wet or flood (1), wet (2), normal (3), dry (4), and very dry, or drought (5). The DW-Index records in this dataset for the recent decades, after instrument observations became available, are calculated from measured rainfall in the months of May–September based on methods described in Tang (1988), Zhang (1988), and Zhang and Crowley (1989). Statistical properties of this DW-Index data series, for example consistency and persistency, have been carefully examined and established (Yao, 1982; Ronberg and Wang, 1987). Many of the 120 sites are located in the Yellow River and the Yangtze River catchments. During the 20th century, many climatologists in China (Zhu, 1925; Xie, 1943; Zhang et al., 1974; Wang and Zhao, 1981; Wang et al., 1981; Jiang et al., 1997) have conducted DW-Index studies using historical documents with different time-space resolutions. However, many of the previous studies focus only on the DW-Index reconstruction or analyses of regional or local DW-Index series in a specific historical period. Wang et al. (1981) have studied the long-term climatic variations for the 500 years (1471–1970) only over the eastern part of China for 25 sites with time series of decadal averages. Jiang et al. (1997) have used a relatively long series from 960 to 1992, but only six small regions in eastern China are con-
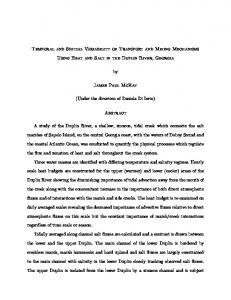
sidered. Recently, this unique historical dataset has been used to understand other aspects of climate variation in China. For instance, Hu and Feng (2001) have analyzed the DW-Index data (1470–1997) from 65 of the 120 sites and found a centennial-scale southward migration of severe dryness-wetness changes in eastern China. Using data from 100 of the 120 sites (1470–1998), Song (2000) has studied the changes in dryness and wetness in different centuries. Zhou et al. (2002) have studied the chaotic features of severe wetness using data from the sites in the Huaihe River Basin (north part of the lower Yangtze River) over the time period 1470–1991. To identify the geographical distributions of dryness=wetness features in more detail, a rotated empirical orthogonal function analysis, is used, using a relative high time and space resolution. The long-term precipitation in Beijing, north China and the long-term runoff series in the middle Yangtze River are used to confirm the dryness=wetness variability in north China and the middle Yangtze River. A data description is given in Section 2 and the method used in this research is described in Section 3. The spatial patterns and the variability of the dryness and wetness in eastern China during the last 530 years (1470–1999) are separated into five centuries and described in Section 4. The main characteristics of temporal variability of the dryness and wetness in eastern China during each century for every mode are demonstrated in Section 5. In Section 6, the long-term precipitation in Beijing, north China and the long-term runoffs in the middle Yangtze River confirm the dry=wet variability in north China and the middle Yangtze River. Finally, the discussion and conclusion are given in Section 7. 2. Data description Many natural proxies, such as dendroclimatic and ice core data from wide areas and historical records, can be used to reveal past climate variability. In eastern China, however, there are few natural proxies but a lot of historical records do exist. In this paper, DW-Index series from 100 sites (Fig. 1) are used to investigate their temporal and spatial variability. A large part of today’s population in China is concentrated in the area covered by the sites. These sites also
Temporal and spatial variability of dryness=wetness in China during the last 530 years
Fig. 1. Geographic distribution of the selected 100 sites in eastern China. Seven regions are marked by A (northeast China), B1 (northern part of north China), B2 (the middlelower Yellow River, or north China), C (northwest China), D (the middle-lower Yangtze River), E (south China), and F (southwest China). Beijing in the region B, and Hankou and Yichang in the region D are denoted by triangle
include some long series from historical documents. The DW-Index series of each site, which represents a small region, are expressed by five grades. In previous similar studies, the grading is based on records and description. In the last five decades, however, both instrumental data and descriptions exist. The grade is mainly based on rainfall data, supplemented by descriptions. Rainfall data for 1470–1998 have been used by Song (2000) and for 1470–1997 by Hu and Feng (2001). The grade is mainly determined by rainfall during the rainy season when 80% of the annual rainfall occurs. For northeast China and north China, the rainy season is from June to September, while for other parts of China it is from May to September. The relative frequencies of DWIndex 1, 2, 3, 4, 5 should be about 10%, 20– 30%, 30%, 20–30% and 10% respectively. Observed total rainfall (Ri) in each site from May to September is used to construct the grade. Following Zhang (1988), formulas are used at each rainfall station located near the site to derive its grades from rainfall amounts: Grade Grade Grade Grade Grade
1: 2: 3: 4: 5:
Ri >ðR þ 1:17�Þ ðR þ 0:33�Þ