Proceedings of ICAD 05-Eleventh Meeting of the International Conference on Auditory Display, Limerick, Ireland, July 6-9, 2005
SPATIAL AUDITORY DISPLAY USING MULTIPLE SUBWOOFERS IN TWO DIFFERENT REVERBERANT REPRODUCTION ENVIRONMENTS William L. Martens, Jonas Braasch, Timothy J. Ryan McGill University, Faculty of Music, Montreal, QC, H3A 1E3 Canada
[email protected] ABSTRACT Spatial auditory displays that use multichannel loudspeaker arrays in reverberant reproduction environments often use single subwoofers to reproduce all the low frequency content to be presented to the listener, consistent with consumer home theater practices. However, even in small reverberant listening rooms, such as those of the typical home theater, it is possible to display a greater variety of clear distinctions in resulting spatial auditory imagery when using laterally positioned subwoofers to present two different signals. This study investigated listeners’ ability to discriminate between correlated and decorrelated low-frequency audio signals, emanating from multiple subwoofers located in two different reverberant environments, characterized as “home” versus “lab.” Octave-band noise samples, with center frequencies ranging in third-octave steps from 40 Hz to 100 Hz, were presented via a pair of subwoofers poitioned relative to the listener either in a left-right (LR) orientation, or in a front-back (FB) orientation. When delivered via subwoofers in the FB orientation, in each of the two reproduction envirnoments, discrimination between correlated and decorrelated low-frequency signals was at chance levels (i.e., the discrimination was effectively impossible). When delivered via the laterally positioned subwoofers (orientation LR) in the acoustically-controlled laboratory environment, the signals could be perfectly and easily discriminated. In constrast, when tests were run in the small and highly reverberant (i.e., home) environment, the decorrelated signals were not so easily distinguished from those that were correlated at the subwoofers, with performance gradually falling to chance levels as the center frequency of the stimulus was decreased below 50 Hz. 1. INTRODUCTION Auditory display systems that use multichannel loudspeaker arrays rather than headphones must take into account the influence of the reproduction envirnoment on the system’s ability to present clear spatial information to human listeners. It is extremely rare to find loudspeaker arrays deployed for spatial auditory display in acoustically controlled envirnoments, and it is even more rare to find anechoic deployment. Nontheless, the anticipated performance of most spatial auditory display systems is based upon the assumption that the reproduction environment will not degrade the reproduced spatial imagery too greatly. In fact, this is a bad assumption to make, especially if consumer-grade multichannel loudspeaker systems are used in their most common configuration, which relies upon a single subwoofer to reproduce the all the low-frequency audio program (combining the signals from the five main audio channels). The research reported in this paper examines what is
lost when only a single low-frequency audio signal is presented by loudspeaker systems located in two representative reproduction environments; one characterized as a “home” setting, with no special acoustical treatment, and the other characterized as a “lab” setting, with more attention to acoustical details. More specifically, this research was designed to test the hypothesis that listeners are able to discriminate between single and multiple low-frequency audio signals, when those signals emanate from multiple loudspeakers located in either of these two reverberant environments. Of course, such an investigation is motivated by the view that presenting such low-frequency content will be useful in auditory display applications. Suffice it to say that not all applications employ audio at such low frequencies, nor do many applications rely upon the distinctions that can be made between spatial auditory images when multiple low-frequency audio signals are presented. Naturally, if few users have experience with systems that present such auditory information, then there will be little awareness of the potential value of such information display. This state of affairs should not be unfamiliar to researchers in the auditory display community, given the current predominance of visual-only information displays that fail to take any advantage of the potential available in utilizing auditory display technology. So it is worth inquiring in this introduction, at least in general, just what advantages there might be in spatial auditory display of sources containing low-frequency content. Generally speaking, spatial auditory display systems present sound sources that have been positioned within auditory scenes to communicate spatial information to the user. It has been regarded as vital to the success of such systems that users are able to detect the displayed spatial information and discriminate between intended spatial distinctions about the sound source and the scene within which it is located. Though narrow-band low frequency sources may be difficult to localize in reverberant environments, there is evidence that listeners do in fact have the ability to laterally differentiate sound source azimuth at low frequencies [1]. For broadband sources, the proper reporduction of the low-frequency components does a great deal to solidify the spatial auditory image of the sound source. In addition, the mutlichannel presentation of low-frequency content can create an enhanced sense of envelopment in a virtual acoustic environment, and is associated with spatial auditory images that seem more tangible, and have greater “auditory volume’ [2]. Unfortunately, not much has been written about the use in spatial auditory display of attributes other than the direction and distance of displayed sources. Recently, Potard, et al. [3] have described control of apparent sound source width in virtual auditory displays, and and its applications to sonification, suggesting creative exploration of ‘sub-band decorrelation techniques.
ICAD05-30
Proceedings of ICAD 05-Eleventh Meeting of the International Conference on Auditory Display, Limerick, Ireland, July 6-9, 2005
Other recent studies by the first author, [4], [5], performed under anechoic conditions, have shown that including multiple lowfrequency signals in sound reproduction enables the creation of auditory spatial imagery that features increased variation in perceptual attributes such as auditory source width and listener envelopment. The question remains, however, whether these perceptual attributes, and their dependence upon low-frequency differences, can be discriminated in reverberant reproduction environments. This research takes place in the context of a growing interest in evaluating the need for, and usefulness of, the integration of multiple low-frequency loudspeakers in multichannel stereophonic sound reproduction systems; however, the discrimination performance supposedly enabled by multichannel loudspeaker arrays is seldom tested in reverberant environments typical of those in which the spatial sound reproduction system will be deployed (noteable exceptions are [6], [7], and [8]). Braasch et al. [1] investigated the ability of listeners to localize which of 5 subwoofers presented a test signal in a reverberant laboratory environment, and showed that their lateral positions were almost always correctly differentiated, but front/back distinctions were not so easily made. Of course, the spectral cues associated with the head-related transfer function do not operate to distinguish frontward from rearward incidence at subwoofer frequencies (nominally those below 120 Hz). This is because the diffraction of lowfrequency sounds around a listener’s head produces interaural level differences (ILDs) that are below the level of perceptibility at such frequencies. While at higher frequencies (above 1500 Hz), ILDs are utilized in source lateralization, for low-frequency sounds, interaural phase differences (IPD) are utilized in lateralization [9]. It is also well establihed that sensitivity to differences in interaural correlation generally decline as the center frequency of narrowband noise increases from 250 Hz up to 1500 Hz [10]. It is most important to stress that the reproduction environment, and the effect that it has on sounds reaching the ear, must be viewed as an integral part of any loudspeaker-based auditory display system. The consideration of a room’s properties becomes especially important when dealing with small spaces and low frequencies. As the ratio of early-to-late reflected sound is higher for small spaces [11], and loudspeaker directivity is especially low for frequencies in the subwoofer range, many have theorized that any auditory enhancement afforded by the use of multiple low-frequency devices would be negated by the obscurring effects room reverberation in the listening environment. One of the goals of this paper is to reveal the physical basis for human sensitivity to low-frequency decorrelation of loudspeaker signals through an examination of the signals that reach a listener’s ears when listening in a reverberant environment. Another goal is to evaluate whether it is possible for the associated spatial auditory images to be discriminated when such differences are presented under controlled conditions in which simple loudness or coloration differences have been ruled out as potential sources for discriminating between test signals displayed by multiple low-frequency loudspeakers. It will be shown that discrimination between correlated and decorrelated low-frequency signals was impossible in a control condition, but was enabled by a change in the orientation of listener to subwoofers that remained in fixed positions within the reproduction environment. Measurement of the signals reaching the ears in the test and control conditions reveals the physical basis for the change in discrimination performance.
2. METHODS 2.1. Apparatus The listening experiments reported here took place in two separate reproduction environments and employed difference sound reproduction electronics as well. The first environment was a very small, highly reverberant home theater space with hard wooden floors. For this space low-frequency reproduction was via two fullrange Cerwin Vega “residential” loudspeakers (model AT-15), using an Onkyo power amp (model TX-SV535). The cabinets housing this 3-way loudspeaker system, which were never moved between conditions, were placed on the floor, with the low-frequency driver (15-in diameter) at a distance of 200 cm from the listening position. The first environment was the Immersive Presence Lab (IPL) at McGill University. The IPL space was larger yet less reverberant than the home theater environment. For this space, low-frequency reproduction was via two “Mini-Mammoth” powered subwoofers (from D-Box Technologies of Quebec). These subwoofers, which were never moved between conditions, were placed on the cement floor, with the driver (15-in diameter) at a distance of 200 cm from the listening position. In order to minimize variation (due to room modes) in system response at the listener’s ears that might result if the subwoofers were moved to manipulate their angles relative to the listener, the listener rotated relative to subwoofers that were fixed in their position in the room. The result was to position the subwoofers at the following azimuth angles (relative to the listener’s median plane): either at 110 , termed the left-right (LR) speaker orientation, or with both to the listener’s left, at azimuth 20 and 160 , which was termed the front-back (FB) orientation. Figure 1 shows how this manipulation was accomplished simply by having listeners rotate 90 to point their noses at the left wall rather than the front wall of the room. By maintaining the locations of the loudspeakers within the listening environment, the magnitude response of the room measured at the ears was held constant (although interaural phase delay was observed to vary). Thus, it could be assured that differences between test and control conditions were not due to modal resonances, but rather due to the orientation of the listener’s ears within the environment.
;
;
2.2. Stimuli The test stimuli for the experiments were generated in Matlab. Multiple 1000-ms bursts of white noise were first created at a 44,100 kHz sampling frequency and 16-bit resolution. The signals were gated using 200-ms cos2 onset and offset ramps to avoid the listener’s use of onset effects (spectral widening) as cues. These signals were filtered with an octave-band-wide FIR filter (4096 coefficients) at five different center frequencies, ranging from 40 Hz to 100 Hz. The maximum sound pressure level of the loudspeaker signals was set to 70 dBC measured at the center position of the set-up. Pairs of noise samples were produced that exhibited zero correlation when correlation values were computed for complete signals (i.e., over the entire stimulus duration), in a manner similar to that taught in [10]. The single signal that was to serve as the “correlated” stimulus maximally similar to the synthesized “decorrelated” stimulus was created by summing the two “decorrelated” signals and then adjusting their subwoofer outputs to 70 dBC, again measured at the center position of the set-up. The “correlated” and “decorrelated” stimuli were confirmed to have roughly the same perceived loudness in an informal test, and this observation was
ICAD05-31
Proceedings of ICAD 05-Eleventh Meeting of the International Conference on Auditory Display, Limerick, Ireland, July 6-9, 2005 0 −2 −4
Magnitude (dB)
−6
Loudspeaker Configurations
−8 −10 −12 −14
Test
LR
−16 −18 −20
40
50
63
80
100
125
100
125
100
125
Frequency (Hz) 180
−110o
Interaural Phase Difference (deg)
LR
110o
Control
90
0
−90
FB −180
40
50
63
80
Frequency (Hz) 180
−20o
Interaural Phase Difference (deg)
FB
−160o
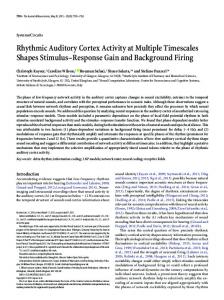
Figure 1: The configuration of the loudspeakers showing their constant position in the reproduction environment, and the change in listener orientation relative to the room and subwoofers between the test and control conditions. In the test condition, the listener oriented toward the front wall to position the loudspeakers at 110 , this being termed the left-right (LR) speaker orientation. In the control condition, the listener oriented toward the left wall to position the loudspeakers at azimuths 20 and 160 , this being termed the front-back (FB) orientation. The dotted line in each plot indicates the change in the listener’s orientation (i.e., nose direction) between conditions.
;
;
90
0
−90
−180
40
50
63
80
Frequency (Hz)
Figure 2: Subwoofer responses measured using HATS. The top panel shows the subwoofer magnitude response curves measured at one ear for the test and control conditions in the IPL environment, using a solid curve for the FB loudspeaker configuration, and a dashed curve for the LR loudspeaker configuration. The two lower panels show the measured Interaural Phase Difference (IPD), the higher of the two panels for the test (LR) configuration and the lowest panel for the control (FB) configuration. The green and red traces correspond to IPD measured when the test signal was applied to the left and right subwoofers respectively in the test condition, and the front and back subwoofers respectively in the control condition. The dashed black traces show IPD measured when the signal was applied to both subwoofers simultaneously.
ICAD05-32
Proceedings of ICAD 05-Eleventh Meeting of the International Conference on Auditory Display, Limerick, Ireland, July 6-9, 2005
1
subsequently confirmed by the failure of listeners to discriminate between them in the control condition (FB loudspeaker configuration). Of course, presenting perfectly correlated signals from subwoofers in reverberant reproduction environments does not result in the production of perfectly correlated signals at a listener’s ears. Therefore, some analysis was undertaken to quantify the effect of the acoustic response of the room on the coherence of the associated binaural signals.
TO
Left Sub Signal Amplitude
SUBS
2.3. Binaural Recordings of the Stimuli
0
−0.5
−1 −1
−0.5 0 0.5 Right Sub Signal Amplitude
1
−0.5
0 0.5 Right Ear Amplitude
1
−0.5
0 0.5 Right Ear Amplitude
1
1
LR Left Ear Amplitude
0.5
0
−0.5
−1 −1 1
FB 0.5 Left Ear Amplitude
In order to better characterize the proximal stimuli for the listening test, binaural recordings of these stimuli were made in IPL using a Br¨uel and Kjær head and torso simulator HATS and the same test stimuli from the listening test. These recordings were imported into Matlab for analysis of signal correlation, as observed at the listener’s ears. Subwoofer responses were also measured at the ears using a test signal that consisted of a sinusoid swept from 20 to 200 Hz (using the Audio Precision 2322 hardware system) for analysis of both Magnitude Response and Interaural Phase Difference (IPD). The top panel of Figure 2 compares the subwoofer magnitude response curves measured in the test and control conditions in the IPL environment. Note that each curve represents the reponse measured at one ear when the test signal was applied to the inputs of both subwoofers simultaneously. The solid curve corresponds to the FB loudspeaker configuration, and the dashed curve corresponds to the LR loudspeaker configuration. Both magnitude response curves show the same pattern of peaks and notches, since the center point of the binaural microphone system (i.e., the center of the dummy head) was the same in both conditions. The match in magnitude response indicates that the no substantial differences (due to room modes) occur within the local area of the head, despite the head rotation. The lower panels of Figure 2 show the measured IPD for the test and control conditions in the IPL environment. Each of these two plots contains data acquired from the left/front loudspeaker green trace) and right/back loudspeaker (red trace). As expected, there is a significantly greater IPD in the test (LR) configuration than in the control (FB) configuration. Note that when the signal was applied to both subwoofers simultaneously (plotted using a dashed black trace), the measured IPD for both the test and control conditions is near zero across all tested frequencies (where a positive IPD corresponds to arrival of the sound at the right ear first, and a negative IPD the reverse). Fig. 3 shows superimposed vector plots of correlated and decorrelated noise bursts, centered at 40 Hz, observed both at the subwoofer inputs, and at the ears using HATS for two listener-speaker orientation conditions, the test condition (LR) and the control condition (FB). The top graph shows the computer generated signals sent to the subwoofers, which in the correlated signal condition (plotted using light blue lines) are prefectly correlated, and in the decorrelated signal condition (plotted using black lines) show zero correlation. The lower graphs show similar vector plots for the signals observed at the ears under the two listening conditions. Regarding the observed interaural correlation values, the graphs plotted in Fig. 3 reveal, at least for the 40 Hz octave-wide band noise, that the change in orientation between the test condition (LR) and the control condition (FB) had the effect that was required for this study. Note that the audio signals applied to the subwoofer inputs were either perfectly correlated (r = 1:000) or perfectly decorrelated (r = 0:000). But the sound signals that
0.5
0
−0.5
−1 −1
Figure 3: Superimposed vector plots of correlated and decorrelated noise bursts, centered at 40 Hz, observed both at the subwoofer inputs, and at the ears of a dummy-head microphone system (HATS) for the two listening conditions (see text).
ICAD05-33
Proceedings of ICAD 05-Eleventh Meeting of the International Conference on Auditory Display, Limerick, Ireland, July 6-9, 2005
arrived at the ears could not exhibit such low correlation values, since the sound signals from the subwoofers both arrived at both ears with very little level difference, and only the natural time difference associated with the displacement of the ears (less than one ms). So, in the test condition (LR), it is no surprise that the originally decorrelated audio signals are highly correlated at the ears (r = 0:956). But, note also that the reverberation within the room does slightly decorrelate the originally correlated audio signals (r = 0:997). Nonetheless, in the test condition there is a marked difference between the appearance of the vector plots for the two signals, there being considerably greater spread along the negative diagonal in the test configuration (LR). However, note that in the control condition (FB), the vector plots associated with the two stimuli lie nearly on top of one another, with correlation values of r = 0:990 and r = 0:992 for the decorrelated and correlated audio signals, repsectively. Of course, the observed interaural cross correlation values (IACC values) were meaured using a long time window (in fact the entire duration of the stimuli), while the actual correlation was not constant over time, but could vary considerably over the 1-s duration of a given stimulus presentation. As only stimulus choice was of interest in the current experiment (which employed only discrimination tasks), there was no need to use stimuli exhibiting constant IACC as there might have been if the tasks were to require magnitude estimates of the perceptual attribute of interest (as in [12]). Also, since listener head movements were allowed in the current study, temporally constant IACC values could never be guaranteed, nor would these be representative of typical multichannel loudspeaker reproduction in reverberant environments.
LR
100 90
Percent Correct
80 70 60 50
FB
40 30 20
HOME 10 0
40
50
63
80
100
Center Frequency (Hz) LR
100 90 80
Percent Correct
2.4. Procedure The procedure employed in the experiments was a standard, nonadaptive 3-Alternative Forced Choice (3AFC) task for observing discrimination performance. In each trial, stimuli were presented as a series of three noise bursts. The series contained two correlated and one uncorrelated burst, and these were presented in a new random order on each trial. Here, the listener’s task was simply to choose which of three stimuli was different from the other two. The choice of test-type (3AFC) had a further benefit for analysis of results, since the performance expected by chance alone is only 1 in 3 for this task. At the low number of 30 experimental trials, this selection made definition of statistically significant performance levels less problematic. 2.5. Listeners Four adult male observers between the ages of 20 and 46 participated voluntarily in the experiments. None had any know hearing loss.
70 60 50
FB
40 30 20
LAB 10 0
40
50
63
80
100
Center Frequency (Hz)
Figure 4: Discrimination performance in a 3AFC task in two different listening environments. The top graph shows the performance in the home theater (HOME), while the bottom graph shows the performance in the IPL (LAB).
3. RESULTS The observed discrimination performance in the two listening envirnoments, and for the two listener orientations, are given in Figure 4 for one of the four listeners. The top panel shows the results on the 3AFC discrimination task for one listener in the home theater environment. For comparing results between the two conditions, results for the test configuration are plotted using circular symbols, and square symbols are used to plot results for the
ICAD05-34
Proceedings of ICAD 05-Eleventh Meeting of the International Conference on Auditory Display, Limerick, Ireland, July 6-9, 2005
control configuration. This listener exhibited significant discrimination performance for all but the lowest-center-frequency octaveband noise stimulus, when loudspeakers were positioned at 110 azimuth (termed here the test condition). Only when the center frequency was 40 Hz did the listener’s discrimination performance fall below the 53.3% level (corresponding to an error criterion of p < :05). In contrast, when both loudspeakers were located to the left of the listener’s median plane, at azimuth angles of 20 and 160 (square symbols, termed here the control configuration), performance never reached levels significantly above chance at any of the presented center frequencies. Figure 4 (bottom panel) shows the results on the 3AFC discrimination task for the listener in the lab (IPL). In this less reverberant environment, the listener scores perfectly in the test case for all test stimuli, yet again fails to score significantly higher than chance in the control condition. The other three listeners showed a similar pattern of results.
;
;
4. DISCUSSION It is worth briefly discussing what the perceptual differences were between the experimental stimuli presented in this study, that could provide the basis for the observed discrimination performance. Recent work by Martens, et al. [7] has shown that under conditions in which low-frequency decorrelation differences can be discriminated in reverberant reproduction environments, the associated auditory spatal images can also be identified as differing in listener envelopment. Griesinger [13] has often emphasized the importance of decorrelated low-frequency sound (below 300 Hz) in creating optimal spaciousness and listener envelopment in multichannel stereophonic sound. In particular, his research on identifying the critical features of the reproduced spatial image associated with an outstanding concert hall led to placement of two lowfrequency drivers directly on either side of the listener (at 90 azimuth). He concluded that lateral separation at frequencies as low as 60 Hz is “vital to world class envelopment.” The current study shows that differences between correlated and decorrelated audio signals reproduced by laterally positioned subwoofers are maintained at the listener’s ears, though to a reduced degree, and are not obscured in the presence of reverberation. Though the signals presented at low correlation levels are effectively re-correlated at the listeners ears (by virtue of the absence of interaural level differences), the interaural phase differences that are still present for laterally positioned subwoofers enable listeners to hear the differences between the decorrelated and correlated subwoofer signals. When the subwoofers were located to the front and rear of the listener, however, the difference between correlated and decorrelated subwoofer signals was not discriminable in either of the two reproduction environments. In the smaller, more reverberant environment, and under conditions in which differences in arrival time of low-frequency signals are preseant at the ears (i.e., in this study’s test condition), discrimination between “decorrelated” and “correlated” noise stimuli was found to be possible as long as the center-frequency of the octave-band stimulus is 50 Hz or higher (and unlikely at 40 Hz and below). In a less reverberant environment, discrimination between signals was found to be possible for frequencies as low as 40 Hz. In fact, the 3AFC discrimination was nearly effortless. And just to re-iterate, in the control condition, in which interaural differences were minimized, successful discrimination was rendered virtually impossible regardless of environment. What can account for this result? With the exception of the binaural response near magnitude
peaks, corresponding to room modes, the phase differentials in the test case (see Fig. 2) appear to decrease as the frequency decreases as one might expect given the relationship between wavelength and the diameter of the listener’s head. The observed presence of a complete phase inversion between the ear signals at around 100 Hz supports previous conclusions [5] that negative correlations can be produced through subwoofer signal manipulations such as those utilized here. Such anticorrelated signals have been reported to be distinguishable from correlated signals in similar 3AFC tests using headphone presentation of narrow-band noise stimuli, though Edmonds, et al. [14] report significant individual differences in listeners’ dicrimination performance. In the binural responses to subwoofer signals observed here, the fact that IPD around 40 Hz appears to be near zero does raise an interesting question. As 50 Hz is included octave-band noise centered at 40 Hz, is the larger IPD around the magnitude notch near 50 Hz significantly aiding the listener’s discrimination of stimuli in this band? The authors hope to answer such questions in subsequent investigations dealing with the cancellation of room modes via the use of acoustical treatment and the consequent effects on the discrimination of stimuli differing in low-frequency correlation at the ears. 5. CONCLUSIONS It was shown that listeners were able to discriminate between spatial auditory images associated with multiple low-frequency audio signals emanating from subwoofers located in two reverberant reproduction environments, characterized as “home” versus “lab.” Whereas decorrelated subwoofer signals could not be discriminated from correlated subwoofer signals when the subwoofers were positioned symmetrically to the front and back of the listener (the control condition), the discrimination was made possible when the subwoofers were positioned to the left and right of the listener (the test condition). Since the magnitude response measured at the position of the listener’s ears was held constant in all conditions, it was concluded that this discrimination was enabled by the interaural phase differences that were presented at the listener’s ears in the test condition, but not in the control condition. Although the discrimination in the test condition was perfectly correct and quite effortless under laboratory conditions (in the “lab”), the decorrelated signals were not so easily distinguished from those that were correlated at the subwoofers when heard in a small and highly reverberant environment (in the “home”). In this latter case, discrimination performance was very good for octave-band noise with center frequency of 100 Hz, the highest frequency tested, but feel to chance levels as the center frequency of the stimulus was decreased below 50 Hz. Thus, for spatial auditory display systems using mutliple low-frequency drivers in reverberant envirnoments, these results confirm that there is some basis for the claim that stereophonic information is lost at very low frequencies; however, it was shown that the difficulty in discriminating between correlated and decorrelated subwoofer signals was only observed in a small, highly reverberant environment, and not in a larger, less reverberant environment. 6. ACKNOWLEDGEMENTS This investigation was supported by a Grant of the Government of Qu´ebec within the project Real-time Communication of Highresolution Multi-sensory Content via Broadband Networks of the program Valorisation-Recherche Qu´ebec (VRQ).
ICAD05-35
Proceedings of ICAD 05-Eleventh Meeting of the International Conference on Auditory Display, Limerick, Ireland, July 6-9, 2005
7. REFERENCES [1] J. Braasch, W.L. Martens, and W. Woszczyk, “Modeling auditory localization of subwoofer signals in multi-channel loudspeaker arrays,” in Proc. Audio Engineering Society 117th Int. Conv., San Francisco, CA, Oct. 2004, Audio Eng. Soc. [2] A. Subkey, D. Cabrera, and S. Ferguson, “Localization and image size effects for low frequency sound,” in Proc. Audio Engineering Society 118th Int. Conv., Barcelona, Spain, May 2005, Audio Eng. Soc. [3] G. Potard and I. Burnett, “Control and measurement of apparent sound source width and its applications to sonification and virtual auditory displays,” in Proc. Int. Conf. on Auditory Display, Sydney, Australia, 2004, ICAD. [4] W. L. Martens, “The impact of decorrelated low-frequency reproduction on auditory spatial imagery: Are two subwoofers better than one?,” in Proceedings of the Audio Engineering Society 16th Int. Conf. on Spatial Sound Reproduction, Rovaniemi, Finland, 1999, pp. 67–77. [5] W. L. Martens, “Subjective evaluation of auditory spatial imagery associated with decorrelated subwoofer signals,” in Proc. Int. Conf. on Auditory Display, Kyoto, Japan, 2002, ICAD, pp. 307–319. [6] C. K¨ugler and G. Theile, “Loudspeaker reproduction: Study on the subwoofer concept,” in Proc. Audio Engineering Society 92nd Int. Conv., Vienna, Austria, Mar. 1992, Audio Eng. Soc., preprint 3335. [7] W.L. Martens, J. Braasch, and W. Woszczyk, “Identification and discrimination of listener envelopment percepts associated with multiple low-frequency signals in multichannel sound reproduction,” in Proc. Audio Engineering Society 117th Int. Conv., San Francisco, CA, Oct. 2004, Audio Eng. Soc. [8] T. Welti, “How many subwoofers are enough,” in Proc. Audio Engineering Society 112th Int. Conv., Munich, Germany, May 2002, Preprint 5602. [9] L.A. Jeffress and D. McFadden, “Differences of interaural phase and level in detection and lateralization,” J. Acous. Soc. Amer., vol. 49, pp. 1169–1179, 1971. [10] J. Culling, H. S. Colburn, and M. Spurchise, “Interaural correlation sensitivity,” J. Acous. Soc. Amer., vol. 110, pp. 1020–1029, 2001. [11] D. Queen, “Temporal considerations differentiating sound in review rooms vs. theatres,” SMPTE J., vol. 86, pp. 149–152, 1977. [12] R. Mason, T. Brookes, and F. Rumsey, “Frequency dependency of the relationship between perceived auditory source width and the interaural cross-correlation coefficient for time-invariant stimuli,” J. Acoust. Soc. Am., submitted for publication. [13] D. Griesinger, “Objective measures of spaciousness and envelopment,” in Proc. Audio Engineering Society 16th Int. Conf. on Spatial Sound Reproduction, Rovaniemi, Finland, 1999, pp. 27–41. [14] B. Edmonds and J. Culling, “The discrimination of interaurally correlated noise bands,” J. Acous. Soc. Amer., vol. 117, pp. 2563, 2005.
ICAD05-36