This article has been accepted for publication in a future issue of this journal, but has not been fully edited. Content may change prior to final publication. Citation information: DOI 10.1109/ACCESS.2018.2874500, IEEE Access
Spatial Big Data and Moving Objects: A Comprehensive Survey 1
Usama Mir, 2Ubaid Abbasi, 3Yang Yang, 4Zeeshan Ahmed Bhatti and 5Talha Mir
1
Senior Member IEEE, Saudi Electronic University, Saudi Arabia,
[email protected] GPRC, Alberta, Canada,
[email protected] 3 Beijing University of Posts and Telecommunications, and Center for Data Science, China,
[email protected] 4 King AbdulAziz University, Saudi Arabia,
[email protected] 5 Tsinghua University Beijing, China,
[email protected] 2
This work is supported by the National Science Foundation of China under Grant 61801035 and the 2018 Education Basic Project (500418763).
ABSTRACT Recently, big data (BD) has seen a tremendous growth in its volume, magnitude and complexity. Examples of such data include navigation maps, mobile phone trajectories, and social media posts/tweets. Normally, this humongous data is known as spatial big data (SBD). The handling and routing of SBD datasets become more challenging when the movement of objects (such as humans and vehicles) is highly dynamic and random. In this paper, we focus on different aspects related to generation, routing, and handling of BD and SBD. The purpose of this paper is multifold; first, we present the viewpoint of various researchers about BD. This part also includes the differentiation between BD and SBD based on several examples. Second, we focus on social media and e-applications, which are considered to be the biggest contributors in generating large volumes of spatial data. Third, our study highlights the routing perspective for BD and SBD including various interesting strategies to route large traffic volumes generated by moving objects. Fourth, we discuss different techniques for big data analysis within the context of moving objects. Finally, we highlight important issues and challenges within the domain of BD and SBD.
INDEX TERMS Big data; Moving objects I. INTRODUCTION
The enormous spread of low cost sensing devices and dramatic drop in storage cost of the data has resulted in extraction of valuable information that is used for the efficient design of any system. The volume, velocity, and variety of such big data (BD) generation and processing is unprecedented. The benefits of BD processing can be seen in a variety of applications such as device to device (D2D) networks [42], urban planning [161], traffic safety [162] and Intelligent transport system (ITS) [90]. There are various sources that contribute to the generation of BD ranging from social media, global positioning maps, electronic and marketing apps (including e-marketing and e-health), global climate models, and vehicle-related information. The importance and handling of such BD become more significant and complex if the objects (generating data) are highly mobile and spatially located at a distance. This type of data is mostly referred to as spatial big data (SBD) [90][13] . One of the biggest challenges for SBD is the dynamic nature of spatially distributed devices and objects especially with the availability of 4G-LTE (long term evolution) services around the globe [113]. The limitation of spectral efficiency for the 4G physical layer results in the utilization of highly dynamic and resource efficient networks such as D2D [42]. In addition, the presence of navigation services such as Google Maps has started a new era of GPS (global positioning system)-based communications. Therefore, this highly dynamic nature of data requires us to develop realtime solutions in order to track the moving objects [90]. Another vital issue is to efficiently ‘route’ the SBD [96]. This means routing the traffic patterns generated by the
movements of objects (such as vehicles and humans) from one location to another. Such kind of information is highly random and quite difficult to manage. Another perspective on routing is to handle the amount of big data generated by modern day networks such as clouds and software defined networks (SDNs) [64]. In addition, an important phenomenon for BD and SBD is extracting the appropriate conclusion by properly analyzing the collected data. The exploitation of collected data has always received considerable attention by academia and industry, however, huge volume, high velocity, and large variety of BD push the limits of the existing storage and processing systems. Moreover, it is difficult to apply the existing statistical techniques on this huge data due to several reasons such as the biasness. The collected data consists of both structured and unstructured information that might be useful for a specific scenario only [25]. Therefore, it is highly important to develop modern techniques and methods that assist in processing these huge data streams. There are different dimensions of research in the area of BD, but in case of BD analysis for moving objects, it mainly relies on ad-hoc solutions [23][51]. The emphasis stays on achieving certain predefined objectives (such as traffic flow predictions, mining data from sensors, etc.) which may result in very limited applications and range of scenarios. Currently, there are variety of sources for data generation in moving objects including social media, video devices, sensors, and GPS, however, it is not enough to rely only on these sources for extremely sensitive decisions such as real-time traffic flow, routing, and ITS. In addition, the new trend in moving objects is more towards
2169-3536 (c) 2018 IEEE. Translations and content mining are permitted for academic research only. Personal use is also permitted, but republication/redistribution requires IEEE permission. See http://www.ieee.org/publications_standards/publications/rights/index.html for more information.
This article has been accepted for publication in a future issue of this journal, but has not been fully edited. Content may change prior to final publication. Citation information: DOI 10.1109/ACCESS.2018.2874500, IEEE Access
proactive control such as accurate prediction of congestion or traffic accidents. Therefore, it is crucial to understand the inherent mechanism of moving objects using both historical as well as real data. Related Surveys and Contribution of this Article In relation to above, a few survey related efforts have been done in the recent past. For example, the work proposed in [90] briefly differentiates between BD and SBD. This paper explains in detail the basic concept of big data and differentiates it with SBD using interesting examples. Several types of big data are also defined such as raster, vector, and graph based datasets. Later, the authors of [90] shift their entire focus on cyber-based information which includes fault-tolerant file systems and BD clouds. Thus, the main idea of interest roams around global information systems (GIS). Our work, on the other hand, not only covers the spatial aspect of big data but also highlights the social media, routing, and learning perspectives. We list down numerous definitions related to SBD, and explain in detail various approaches and algorithms for SBD generation, handling, routing, and analysis. Another short survey is presented in [177] highlighting important challenges and opportunities in trajectory data analysis. The paper is written on the argument that current research on SBD trajectory analysis focuses on a single factor (such as the movement of people from one place to another) which is quite simple and thus, not enough to make effective and real-time routing decisions. Therefore, the authors emphasize on including multiple factors in trajectory analysis such the types of vehicles used for movement, temperature, and road conditions and they list challenges and issues related to the aforementioned. However, we think that the claim of authors is not totally justified since there are several existing approaches (such as [30][90]) which consider multiple factors for routing-based decisions. The work proposed in [176] highlights the challenges for SBD with uncertainties. The focus of the paper is to identify the unreliable knowledge resulting from different sources and ensure stage-by-stage uncertainty handling for enhancing the reliability of the knowledge. The authors explain the reasons for the uncertain data and provide a framework for uncertainty based SBD analytics. They further discuss the place-based heuristic, analytics, and assessment of user generated images and texts in the context of any existing uncertainty. Quite differently, our work (especially section V) highlights different aspects of big data analysis in moving objects. Although uncertainty can be classified as one of the issues in SBD analysis for moving objects however, we kept our focus on discussing existing techniques used for effective analysis of the available data. Another interesting survey presented in [79] lists the important platforms for BD analysis but the importance of spatiality and moving objects is mostly ignored. The focus of [50] remains on disaster management aspects related to BD networks. The networking of BD is very comprehensively covered in [107]. The authors of [28] survey all the issues related to the processing and handling
of BD which is generated via scholarly information databases. In this paper, we focus on various aspects related to SBD and moving objects. More specifically, the main contributions of this paper are as follows: Table 1. List of acronyms/abbreviations
Acronym/Abbreviation
Full form
ADP
Adaptive Dynamic Programming
ANBR
Aggregatable Named Based Routing
AODV
Ad hoc On demand Distance Vector
API
Application Programming Interface
ARM AV
Association Rule Mining Autonomous Vehicle
BD BS
Big Data Base Station
CCN CR
Content Centric Network Cognitive Radio
CRD2D
Cognitive Radio Device to Device
D2D DACAR DCN DSR
Device to Device Data Capture and Auto identification Reference Data Center Networks Dynamic Source Routing
EAR GIS
Explicit Adaptation Requests Global Information System
GPS
Global Positioning System
IaaS ITS
Infrastructure as a Service Intelligent Transport System
LTE
Long Term Evolution
MAE MANET
Mean Absolute Error Mobile Ad hoc Network
MAP
Mean Average Precision
NS2 PDR
Network Simulator 2 Pick-up and Drop-off Rate
PPCA PU
Probabilistic Principal Analysis Primary User
RFID RL
Radio Frequency Identification Reinforcement Learning
ROI
Return On Investment
RST SA
Rough Set Theory Sentiment Analysis
SaaS
Software as a Service
SBD SDN
Spatial Big Data Software Defined Network
SU TOU
Secondary User Time of Use
V2V
Vehicle to Vehicle
VGI WWW
Volunteered Geographical Information World Wide Web
Component
We comprehensively define BD. This part includes the viewpoint of several researchers about BD. BD is then differentiated with SBD with the help of
2169-3536 (c) 2018 IEEE. Translations and content mining are permitted for academic research only. Personal use is also permitted, but republication/redistribution requires IEEE permission. See http://www.ieee.org/publications_standards/publications/rights/index.html for more information.
This article has been accepted for publication in a future issue of this journal, but has not been fully edited. Content may change prior to final publication. Citation information: DOI 10.1109/ACCESS.2018.2874500, IEEE Access
II. SPATIAL BIG DATA AND MOVING OBJECTS
size, volume, and unstructured nature [47]. Table 2 summarizes various existing viewpoints about BD. BD is in limelight for years now and a lot of research has been done on defining, processing, and handling these large sets of random information. Due to the current advances in the field of information technology especially with the provision of internet connectivity whenever and wherever needed, SBD has emerged as one of the most important and interesting research areas. The terms BD and SBD are easy to differentiate. For example, normal posts/tweets on Facebook and Twitter can be categorized as BD while geolocated posts/tweets from different parts of the world fall under the window of SBD [90]. Another example of SBD is the data gathered from various ‘sensor nodes’ spatially located in a large geographic region. This data has to be stored, monitored, and processed in real-time to deal with situations like disaster recovery, possibility of fire spreading in a jungle, and temperature control. SBD is largely influenced by the movement of geographically located objects. These ‘moving objects’ are mostly in the form of humans and vehicles changing their locations on frequent basis. Sometimes, these location changes are so random and fast that it gets difficult to process and control the generated data. Thus, special algorithms and solutions are required to handle the data generated by the moving objects. Recent trends shown by the mobile industry in terms of volume (up to Terabytes) and variety (such as gaming, multimedia, cloud services, navigation, and social posts) are also part of SBD. A huge increase in the usage of location-based services (like Google Earth, Google Maps, Swarm, Waze, etc.) through mobile phones and other handheld devices highlights the importance of SBD in our daily life. Table 3 summarizes the difference between BD and SBD w.r.t several interesting contexts and examples.
The term big data signifies to huge amount of data that is complex to analyze. There are several examples of BD such as location maps, investigative reports, data gathered from thousands of sensors placed at various locations, climatic changes and detailed weather reports, political surveys about upcoming elections, and so on. According to [99], big data is large and heterogeneous making it difficult to store in regular relational databases. This data can either be structured (stored in relational databases) or unstructured to be used for analysis. Evans et al [90] argue that the size of data varies with the context which means there is a solid correlation between the dataset and users’ personal experiences. The authors of [15] define BD as a combination of datasets which are humongous in size and cannot be solved using simple statistical techniques within the allocated time frame. These datasets are mostly loosely coupled showing the complexity in handling and processing. Similarly, Douglas [21] defines BD as any information with large size, variety, and high volume that can only be managed through the development of advanced optimization and discovery techniques. Moreover, well-known organizations like IBM, Intel, and Oracle also distinguish BD from conventional data in its
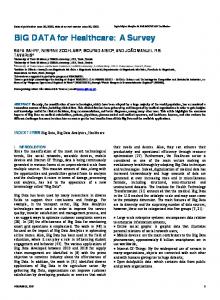
In continuation to above, figure 1 depicts a case study based on people’s daily patterns in life. These statistics were presented in [103] where the ‘activity space’ is chosen as a life pattern. Based on a thorough GPS tracking of 30 people’s weekday routine, we see that a high percentage spends their time at homes or in offices. However, their online data access could totally be different. For example, from noon to 5pm, the pattern of data would be video conferencing, stock exchange monitoring, fund transferring, tweeting about current achievements in office, and posting pictures of lunch menus and restaurants. On the other hand, the hours from midnight to 7am would result in rather different traffic patterns like normal web-browsing and social media activities. Therefore, a person having a seamless internet connectivity will be experiencing a wide variety of activity during a single day and by multiplying it with billions, we can think of how huge, dynamic, and geographically distant this data can become. Furthermore, in this context, in Table 4, we name certain examples of data, which are specific to SBD and moving objects, and should be processed in real-time. The recent trends show that the total amount of data (generated from the types
promising examples. This section also clarifies the relationship between SBD and moving objects. We focus on social media and e-applications which are considered to be the highest contributors in generating large volumes of spatial data. This section also includes examples of current market trends related to BD. Our study highlights the routing perspective for BD and SBD including various interesting strategies to route large traffic volumes generated by the moving objects. This part surveys different strategies designed for routing of vehicles as well as network-generated traffic. We discuss different techniques for BD analysis within the context of moving objects. Current and future challenges and issues are also discussed for all of the above mentioned parts.
The acronyms used throughout this article are presented in Table 1. Survey Structure The paper is organized as follows. In the next section, we comprehensively define BD, differentiate it with SBD using examples, and explain its relationship with moving objects. Important contributing factors involved in SBD generation (such as social media) w.r.t moving objects are highlighted in Section III. Routing is directly related to movement of spatially located objects, therefore Section IV entirely focuses on various routing strategies for BD and SBD. BD analysis techniques are discussed in Section V. We highlight current and future research issues in section VI. Finally, Section VII concludes the paper.
2169-3536 (c) 2018 IEEE. Translations and content mining are permitted for academic research only. Personal use is also permitted, but republication/redistribution requires IEEE permission. See http://www.ieee.org/publications_standards/publications/rights/index.html for more information.
This article has been accepted for publication in a future issue of this journal, but has not been fully edited. Content may change prior to final publication. Citation information: DOI 10.1109/ACCESS.2018.2874500, IEEE Access
Table 2. Viewpoints of researchers from academia and industry related to big data. These viewpoints are chronologically arranged according to the year (and date in case of same year) of publication. Type of published Concept about Big Data Reference/ Year of Context document Source Publication Research article
BD is defined based on the volume and size of the data.
[66]
1997
Computer graphics
Technical report
Amount of data which is difficult to manage by the modern day database software.
[46]
2011
Enterprises storage and consumers usage
Research article
BD is defined in terms of its size and rapid generating nature.
[101]
2012
Computing
Study report
A large volume of data which is generated by new applications and technologies and thus, requires advanced processing techniques.
[40]
2012
Digital communication
Book
BD is defined according to culture and society values and people’s ability to use information.
[116]
2013
Things that can be done with big data
Research article
BD is humungous and requires advance level processing techniques.
[46]
2013
Computing
Research article
Similar idea as [40] and [46].
[99]
2013
General (not specific to a particular topic)
Research article
Kind of data which requires timely processing however modern day tools are finding it difficult to process BD in time.
[112]
2013
Computing
Book
Large datasets seem to emerge from last decade or so.
[110]
2014
Management sciences
Online page (blog)
Large variety and volume of datasets requiring innovative techniques for processing.
[9]
N/A
General
Research article
BD is defined based on three ‘C’ i.e., Cardinality, Continuity, and Complexity.
[105]
2014
Machine learning
Technical report
Extensive datasets which require scalable processing techniques.
[24]
2015
General
(Best seller in USA)
Figure 1. A use case study of people’s weekday activity patterns. Study is conducted for a period of three months by tracking (through GPS) the continuous spatial movements of people from one activity space to another [103].
2169-3536 (c) 2018 IEEE. Translations and content mining are permitted for academic research only. Personal use is also permitted, but republication/redistribution requires IEEE permission. See http://www.ieee.org/publications_standards/publications/rights/index.html for more information.
This article has been accepted for publication in a future issue of this journal, but has not been fully edited. Content may change prior to final publication. Citation information: DOI 10.1109/ACCESS.2018.2874500, IEEE Access
Table 3. A brief comparison of big data and spatial big data considering different contexts. Some well-known example applications for SBD are also provided. Context Big Data Spatial Big Data SBD Examples Facebook, Twitter, Social Media Simple posts or tweets Geo-located posts or tweets Whatsapp Menus of all Chinese Menus of all restaurants in Searching Foursquare the middle east with more restaurants in the middle east than 100 hundred guests check-ins during last couple of hours Detailed study manuals on Change of sensory data in Loop detectors, Surveillance and Monitoring deployment of sensor nodes last hour or so in all the cameras, hotspots places where temperature and security cameras sensors are deployed within a country Results of previous two Voting trends in past 48 Political Analysis Buzzfeed elections hours Detailed channel ratings Television/Movies Checking www.imdb.com USA NOW based on viewers presence during particular hours Detailed past history of all Real-time maps with shortest Google Maps Navigation reported accidents on the paths, nearby gas stations, highway connecting eastern restaurants, and hospitals and western regions Patterns of life for last three Daily Life Detailed biography UBhind months including work, sports, club, study, sleeping hours, and surfing on mobile/laptop Table 4. Types of modern day real-time services generating huge amount of data. This data is strongly related to the context of moving objects. Type of Real-time Data Famous Example(s) Social Network Data (also mentioned in Table 3) Facebook, Twitter, Instagram Click Streams Data YouTube, Dailymotion, Broadcast through privately own smart-phones (such as Samsung Note) Automobiles Data Google Maps, TomTom, Samsung Mobile Live Broadcast RFID (radio frequency identifier) Data Smart cards, goods tracking Location-Based Data GPS, Whatsapp location feature. Also includes automobile data Point of Sale Data Barcodes Customer Data Billing, Inquiries, Payments Smart Meters Data Digital electricity meters for TOU (time of use) tariffs and fluctuation management Sensory Data Security cameras, temperature and climate sensors Mobile Data 4G-5G and LTE services
specified in Table 4 and similar other cases) is increasing at a fast pace and expected to reach 7.9 Zettabytes this year compared to 1.8 Zettabytes in 2011, respectively [84]. Therefore, efficient techniques are desirable to compensate this immense growth in SBD considering the distributed and dynamic nature of objects. III. MAIN SOURCES FOR BIG DATA GENERATION: SOCIAL MEDIA AND E-AAPLICATIONS
One of the main sources of BD is the extensive use of social media applications as shown in Table 4. The substantial growth of social media over the last decade has been supplemented by the upsurge of spatial technologies. This has provided new mapping mechanisms where users are involved in online activities in real time. The coupling of users social media and location-based information generates tons of crowdsourced data that can be used in many contexts. However, this unstructured data requires
2169-3536 (c) 2018 IEEE. Translations and content mining are permitted for academic research only. Personal use is also permitted, but republication/redistribution requires IEEE permission. See http://www.ieee.org/publications_standards/publications/rights/index.html for more information.
This article has been accepted for publication in a future issue of this journal, but has not been fully edited. Content may change prior to final publication. Citation information: DOI 10.1109/ACCESS.2018.2874500, IEEE Access
advanced data mining techniques to draw meaningful insights. Social media data together with geotagging, known as geosocial data enables content creation by users and is publicly accessible. Thus, social media is one of the main sources of SBD generation. This is mainly because of the exponential growth of mobile usage thus making it possible to measure and analyze different types of social, economic, and political activities [131]. BD generated via social media is also known as ‘social BD’. This social BD is defined in [132] as “those processes and methods that are designed to provide sensitive and relevant knowledge to any user or company from social media data sources when data sources can be characterized by their different formats and contents, their very large size, and the online or streamed generation of information”. One of the features of data generated through social media applications is that it is unstructured in nature. Due to the various types of social media generated data, the analytics performed on social BD vary as well. Text analytics are used for social media data collected from organizational proprietary web pages as well as pages hosted on various third party social media websites. Social media content helps firms in understanding the opinions of consumers and general public related to social events, political movements, company strategies, marketing campaigns, and product preferences [133]. In order to better understand these opinions, sentiment analysis (SA) techniques are used in literature. SA is a computation study of opinions, sentiments, emotions, and attitudes expressed in text towards an entity [134]. Due to the ever increasing trend in e-commerce, online reviews and product evaluations are becoming common, and therefore, producers and service providers take into consideration the analysis of these customer opinions [135]. However, the increasing use of mobile devices coupled with social media data has provided organizations an access to much more in-depth data which is even more useful. This is usually referred as ‘mobile analytics’ or ‘mobile business intelligence’. According to Chen et al. [136], mobile data generation and analytics have a wide range of applications such as location-based mobile sensing apps that are activity-sensitive, disaster management, m-health, mlearning, mobile social networking, crowd-sourcing, gamification, mobile advertising, and social marketing. Some of these applications are discussed in detail in the following subsections. 1. MOBILE/SOCIAL MARKETING
Marketing activities with social BD have been enhanced to a great extent. Organizations are investing in BD infrastructure by logging and storing data from customer engagements because it helps to achieve a positive return on investment (ROI) [137]. One way to get high ROI is to perform predictive analytics for product demands which offers accurate demand forecast. According to [137], traditional time-series forecasting with historical sales data works well with popular products but is not very predictive for other products because of the random noise, hence more
and more firms are relying on predictive analytics from socially generated consumers data. Online social networking websites provide marketers with deep insights and user intelligence to launch targeted marketing campaigns. Similarly, online recommender systems used by YouTube and Netflix as well as ecommerce websites such as Amazon and eBay can significantly transform marketing [132]. A study of Twitter as an advertising medium analyzing range frequency, timing, and tweet contents revealed that 19% of tweets from the corporate accounts do mention at least one ‘brand’ [163]. He et al. [145] argue that in today’s competitive environment, BD is one of the vital resources for a firm that is able to generate something of value to its customers and cannot be imitated. According to the resource-based view of a firm, there are three types of resources: physical capital, human capital, and organizational capital [139]. In the context of BD, the physical capital is referred as the applications used to gather and analyze BD [164]. The human capital can be equated to the data analysts who can have insights into the data to know about consumer activities. The organizational capital is basically the structure that enables the strategies to be translated into actions [138]. Building on this insight, firms have recently started utilizing consumer BD generated through mobile phones and applications to enhance their dynamic capabilities. One such example is the use of recorded conversations between service staff and customers by various organizations with the integration of speechanalytics to determine key performance indicators [140]. Similarly, a much more proactive approach is used by Target stores in competition with Walmart reported by Li et al.[142]. With the built-in GPS in mobile devices to enable location information for users, social media applications allow their users to post content with geographic information, hence producing vast amount of data with location information [168]. The authors of [169] coined the term individual mobility pattern (IMP) to understand human behaviors in performing daily activities based on their locations. The main source of data for IMP which is mobile phone trajectory combined with social media data generated by users becomes a competitive data source for moving objects. Naturally, with respect to IMP, spatial aspect remains the most important one e.g., frequent visits to point-of-interest as identified by [170] and the role of GIS as social media by online mapping websites. Therefore, a plenty of research is done on social media and spatial data. However, researchers have recently realized regularities not only in spatial but also in temporal aspects of IMP and hence stressing spatial-temporal data for individuals to be more rational [168]. Therefore, in addition to the data related to individuals points-of-interest, temporal data such as the sequence of visits to these points-ofinterest provides us with more comprehensive spatiotemporal data.
2169-3536 (c) 2018 IEEE. Translations and content mining are permitted for academic research only. Personal use is also permitted, but republication/redistribution requires IEEE permission. See http://www.ieee.org/publications_standards/publications/rights/index.html for more information.
This article has been accepted for publication in a future issue of this journal, but has not been fully edited. Content may change prior to final publication. Citation information: DOI 10.1109/ACCESS.2018.2874500, IEEE Access
He et al. [145] state that with the growing richness of data, marketers now have more opportunities to identify new gaps which was not possible before. With the availability of geospatial and temporal data, marketers can now predict where a customer/product would possibly be at a given time. Google Now application has the capacity to suggest consumers on the availability of products/services based on their browsing and searching patterns e.g. availability of tickets at a local cinema and movie hours (based on temporal data) or a restaurant offering food according to customer’s likings. Text Analytics and Network Analytics in Social Media One source of SBD (particularly for organizations) is the unstructured textual information residing in email communications, corporate documents, and social media content on websites such as Facebook, Twitter and other social media. Government and research institutions also monitor such textual information for security purposes and/or to analyze the general opinion of public for popular events such as elections and referendums. According to Erevelles et al. [138], in the World Wide Web (WWW), opinion identification and classification is normally based on social media textual contexts, therefore the authors suggest two main approaches for such classification; lexicon and learning based methods. Lexicon-based approaches have pre-established rules to interpret textual sentiments [143] such as measuring the tone of news. Learning methods (on the other hand) use a hybrid approach combining lexicons and machine learning to classify opinions (the learning methods are discussed in much detail in section V). Similarly, online reviews of products by people/customers are also a source of data for marketers as well as producers [144]. The authors of [144] further argue that online reviews allow a customer to be a part of product design and development as well as customer requirements. Erevelles et al. [138] believe that opinion mining is an extensively used approach in social media environments. Network analytics are often coupled with text analytics in social media to derive more sense out of data. Users’ online posts or tweets trigger responses such as likes, comments, and re-shares, which may lead to the population of more textual content. According to Chen et al. [136], network analytics focus on link mining and community detection by exploring and predicting the connectivity among nodes of a network. Nodes can be in the form of customers and users of a service or products, while the links represent the medium such as email messages, and social media comments, likes and shares. These connections between nodes create a social network of opinionated users. Online recommendation system such as YouTube video recommendation also utilizes SBD consolidated by network connections by grouping similar users and extending it to other users by suggesting content they might be interested in. For instance, He et al. [145] show that an online service
for travel recommendation must capture or infer users’ travel interests from their consumption behavior on travel packages which is termed as social recommendation. Network SBD analysis is also being utilized in road network modeling for instance in an online taxi service with the use of GPS sensors. Zhou et al. [146] highlight a problem in traditional taxi service focusing on misbehavior of taxi drivers. These drivers were not taking the shortest route to travel from point A to B, and the passengers were not aware of this deception especially when they were not acquainted with the route. This detouring allows taxi drivers to overcharge passengers in unfamiliar settings. By incorporating GPS sensors in taxis, data such as position, speed, timestamps, and flag markings can be generated. Therefore, the authors of [146] suggest to prevent this fraud by considering the data of customers who have already traveled from point A to B and hence, consolidating this data to calculate the optimal route. Zhou et al. [146] further recommend a real-time trajectory detection which means that when a driver tries to deviate the recommended path, a notification may be pushed to the passenger notifying him/her of a potential fraud. We further discuss route recommendation and similar topics in Section IV. 2. M-HEALTH
The extensive use of e-health records by hospitals across the globe has generated vast datasets [147]. Apart from hospitals, there are other sources of BD in healthcare such as clinical decision support systems, laboratories, pharmacies, and insurance companies. The gathering and analysis of healthcare related BD has been given various terminologies such as e-health, m-health (medical-health), digital health, health 2.0, and e-medicine [148]. One of the features of such data is crowdsourcing which is the basis of social media technologies. A number of websites has emerged recently trying to consolidate crowdsourced data such as PatientsLikeMe, Health Tracking Network [149], and Global Public Health Intelligence Network [132]. Barrett et al. [149] state that crowdsourced data is especially beneficial for observing the spread of infectious diseases. Similarly, HealthMap – an online aggregator uses informal online data sources such as news, reports, and online discussion forums to observe and map diseasesrelated information. In the same fashion, individual users’ (Facebook and Twitter) profiles generate diseases-related data using the keywords in their status updates/tweets which helps in mapping the location and intensity of a disease. In addition to above, a more accurate source of such data is the use of mhealth applications installed on smartphones and sensory wearable devices [150]. The growing trend of health related applications on smartphone has triggered the market for personal sensors with pre-loaded applications – which serve as passive and manual data generation source [149]. In addition, devices such as Google Glass, Apple
2169-3536 (c) 2018 IEEE. Translations and content mining are permitted for academic research only. Personal use is also permitted, but republication/redistribution requires IEEE permission. See http://www.ieee.org/publications_standards/publications/rights/index.html for more information.
This article has been accepted for publication in a future issue of this journal, but has not been fully edited. Content may change prior to final publication. Citation information: DOI 10.1109/ACCESS.2018.2874500, IEEE Access
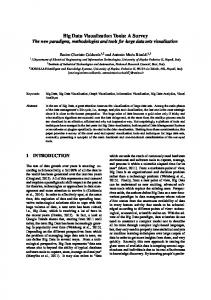
Figure 2. M-Health System at Chelsea and Westminster Hospital (London) (Adapted from [153]).
iWatch, and Samsung Gear among others have built in hardware and software functionalities for monitoring users’ heart, pulse, and respiratory rates [151]. Sultan [152] reported the life-saving incident of a patient using Google Glass at Boston’s Beth Israel Deaconess Medical center where physicians learned a patient’s complete medical history from his wearable device. This patient had earlier provided medical staff with an incomplete medical history. Google Glass helped the physicians in an emergency situation and saved time accessing patient’s medical records with more accuracy than searching through physical records. Following this incident, the hospital extended the use of Google to the entire emergency department. Another potential use of wearable devices in healthcare is for data access. Sultan [153] mentioned the use of DACAR (data capture and auto identification reference) to gather remote data from patients that allows close family and friends to access data buckets of patients for surveillance and care purposes. Family members or friends can set threshold values (e.g., heart rate and blood pressure) in the system to trigger alarms related to a patient’s health condition. Figure 2 shows the functioning of the m-health system ‘DACAR’ adapted by the Chelsea and Westminster hospital in London [147]. The system is basically a platform that enables remote delivery, storage and access to patient’s electronic records using platform as a service (PaaS). DACAR is hosted on an IaaS (infrastructure as a
service) cloud platform. The system enables close friends and family of a patient as well as the hospital/doctors to access his/her data buckets at any given time. The system is essentially connected to wearable technology on a patient and a data bucket allows creating, holding, updating, and deletion of patient’s data. A cloud server stores all the updated data which is accessible by multiple stakeholders such as friends/family for monitoring the patient, the patient itself, and the doctor for accessing medical records. A consulting doctor or a staff can always access the real-time updates of any patient, as the data is continuously saved on the cloud. Data from the cloud can also be sent to the data center for further analysis. In addition, the DACAR system allows a patient to easily share information with the consultant if he/she is to seek any medical advice. Finally, for critical and elderly patients, their close family members are notified via messages if any health monitoring values breach the threshold levels (such as high blood pressure, pulse, and heartbeat). 3. SBD GENERATED SITUATIONS
THROUGH
DISASTER
Recent natural environmental disasters have drawn focus to the vulnerability of our society and infrastructure [154]. Novel information streams, such as social mediacontributed videos, photographs, and text as well as other open sources are redefining situation awareness during emergencies [155]. Social media messages combined with
2169-3536 (c) 2018 IEEE. Translations and content mining are permitted for academic research only. Personal use is also permitted, but republication/redistribution requires IEEE permission. See http://www.ieee.org/publications_standards/publications/rights/index.html for more information.
This article has been accepted for publication in a future issue of this journal, but has not been fully edited. Content may change prior to final publication. Citation information: DOI 10.1109/ACCESS.2018.2874500, IEEE Access
geographic reference containing spatial and temporal information are termed as volunteered geographical information (VGI) [156] that unfolds the power of ‘citizens as sensors’ to provide real-time updated data. According to Dashti et al. [157] VGI can be used in disaster response, timely damage assessment, and to efficiently carry out rescue and relief operations. Howe [158] argues that VGI is similar to crowdsourcing primarily because of two reasons. First, it makes use of the wisdom of crowd and can solve a problem more effectively than an expert, irrespective of the group’s knowledge and expertise pertinent to the problem. Second, the information acquired via collaborative VGI is possibly closer to reality than the information obtained from a single source. A number of examples where volunteered data has been used to retrieve critical information have been cited in the recent literature, e.g. during hurricane Katrina [155], fire emergency event in Shanghai [159], River Elbe flood in Germany [160] and so forth. IV. ROUTING AND BIG DATA
In this section, we summarize several existing contributions related to geographically generated BD. In the first part, we focus on existing solutions which deal with BD traffic generated through geographical/spatial movements of various objects including cars, taxis, and buses. In the second part of this section, we summarize interesting algorithms proposed for the routing of BD traffic in modern day networks such as SDN (software define networking), D2D networks, BD clouds, etc. 1. ROUTING FOR SPATIAL/GEOGRAPHICAL MOVEMENTS OF OBJECTS
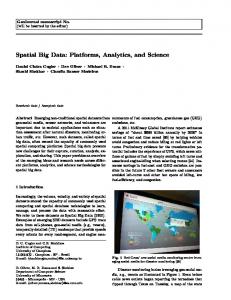
BD can play an important role in developing efficient traffic routing schemes. The increase in number of vehicles using location-based services and uncertainty in people’s movement from one location to another demand us to develop more accurate, cost-effective, and energy efficient traffic routing schemes [14]. This requires a thorough and deep analysis of the currently available big volumes of data and sharing the available information with users/devices/vehicles in real-time [108]. A. Important Types of Spatial Big Data Routing [14] In relation to routing of SBD, a promising work is presented in [14], where routing is divided in several interesting categories such as eco-routing [57][72], personalized routing [37][83], and vehicle routing with user-generated trajectory data [118][115] as shown in figure 3. In eco-routing, the best route for vehicles is chosen based on fuel efficiency. Other factors such as road situations, traffic and weather conditions, and amount of luggage in a vehicle can also be considered. Further, two approaches based on histogram and graph theory to represent various case studies related to eco-routing are presented and several interesting results are shown. Different from eco-routing, personalized routing presented in [14] considers a driver’s personal preference as a primary factor in selecting a route.
For example, someone traveling for vacations during summers will go for fuel economy since he/she has plenty of time to travel. However, any other person driving in a rush hour would be less concerned with fuel saving and would opt for the fastest/shortest route, thus, showing two different preferences of drivers. The authors further suggest to look for a driver’s nature in route selection such as aggressive (or a fast-paced driver) and moderate (or a low paced driver). Despite highlighting this important techniques for route selection, the authors of [14] do not provide any further details. Third type of routing presented in [14] considers temporal conditions (such as familiar/unfamiliar surroundings) and popularity index (rated by various local travelers) in selecting the best route. A “trajectory database” is created which provides trip suggestions to drivers in real-time. This database has routes which are rated/scored by various drivers. The results of trajectory database are compared with the results provided by the routing service (such as driver’s navigation/GPS) and the route with maximum match is selected. Similar kind of routing concepts are highlighted in [41][67] as well. Based on the above concepts, we categorize the existing literature on big data routing in numerous categories discussed in the next subsections. Our work mostly focuses on (but not limited to) the research work done in the past two to three years. B. Grouping of Autonomous Vehicles with Privacy Preservation [1] Autonomous vehicles (AVs) have emerged as a new phenomenon in modern era with the flexibility of driving without the need of a driver. These vehicles are normally equipped with advanced sensing and navigation facilities allowing them to route with accuracy. The work proposed in [1] tries to utilize these interesting features of AVs. Basically, for each AV, there is a set of primary and secondary users. A primary user (PU) is the owner of an AV and a secondary user (SU) is the one wanting to share a PU’s vehicle. A PU decides whether to share its AV with SU(s) on the basis of nearest neighbor selection algorithm proposed in [78]. A PU also has the right to decide the number of SUs who can share its AV. Moreover, three different routing scenarios are presented such as:
A PU decides the pick and drop areas for SUs according to the start and the end locations agreed by both primary and secondary users. The vehicle is then routed accordingly.
A PU decides the pickup area but the dropping location is different from the end location, however it should not be far from the surrounding of route.
A PU decides the pick area but the dropping location is different from the end location and it can be far from the route. The AV can then drop the PU first, take SU to its destination, and finally route back to the PU (which is unlikely to happen with human driven cars).
2169-3536 (c) 2018 IEEE. Translations and content mining are permitted for academic research only. Personal use is also permitted, but republication/redistribution requires IEEE permission. See http://www.ieee.org/publications_standards/publications/rights/index.html for more information.
This article has been accepted for publication in a future issue of this journal, but has not been fully edited. Content may change prior to final publication. Citation information: DOI 10.1109/ACCESS.2018.2874500, IEEE Access
R o u t e S e l e c t i o n F a c t o r s
T y p e s E c o - r o u t i n g D a t a I n t e n s i v e R o u t i n g f o r S p a t i a l N Pe et w r so or nk a l i z e d
F u e l e f f i c i e n c y R o a d c o n d i t i o n s W e i g h t o f v e h i c
Dr ro iu v t ei rn sg
b e h a v i o r /
c o n d i t i R o u t i n g b a s e d T oe nm p o r a l t r a j e c t o r y d a tU as e r r a t e d / s c o r e
Figure 3. Types of data intensive routing with route selection factors for each type [14].
All the above routing strategies are tested on real maps of Tennessee State (USA) and the results show that the proposed scheme incurs less route searching time which is highly desirable for modern day users dealing with BD applications and AVs. C. Personalized Route Recommendation based on Big Social Media As mentioned before (in Section III), Social media (such as Facebook, Twitter, and Instagram) is one of the biggest examples of BD [31]. We use social media to post photographs and videos, tag friends, make suggestions, and so forth. Thus, social media has become a necessary part of our daily routine. Among other important things shared on social media these days, most people prefer sharing their travel experiences in the form of photographs and posting status updates. This important source of travel information from social media along with various ‘Travelogues’ available on several websites can be used together to propose more personalized and efficient travel recommendations to users which is done in a very interesting work presented in [96]. The authors propose a learning model named as “topical package model (TPC)” which recommends personalized routes to users based on community-contributed photos and travelogues. In addition, the routes are learned and suggestions are made according to the average amount of money a user spends on a trip plus the visiting season and time. Different mathematical models are proposed to show how important information (such as users preferred season for traveling) can be extracted/mined from various social media photos, tags, and travelogues. Mining information is then used to recommend routes to users based on a ranking system. Extensive set of experiments are performed on real-time travelogues to show the impact of user interests, traveling season, time, and cost on mean average precision (MAP-which is
calculated using the proposed mathematical model). This MAP reflects the change in choices of users when they are selecting their traveling packages. The results conclude that time and cost have more impact on MAP than traveling season which is kind of an obvious trend. We summarize the main points of [96] and other important works (similar to [96]) which are based on recommending personalized routes to users using different criteria such as geographical locations, distances, time, cost, etc., in Table 5. For example, in Table 5, the work proposed in [128] is summarized that uses real-time datasets for the experiments collected from Flickr API. Similar to [96], the authors of [128] use MAP as an important criterion for suggesting routes to users. Moreover, references [37][83] discussed in our previous section can also be categorized under “personalized route recommendation based on social datasets” and thus are highlighted in Table 5. D. Bi-directional Route Planning using Taxi GPS Traces [10] Here we discuss a very interesting case study-based approach presented in [10]. The reason we separate this approach from above presented strategies is because; (1) the authors present a very interesting case study for routing the night buses, and (2) the real-time data of various taxies is taken to plan the routes (which was missing in the strategies presented in above subsection). Moreover, buses are considered as one of the cheapest ways of traveling, therefore, providing automated routes to bus drivers as well as real-time information to passengers on their smartphones or similar devices would be a huge benefit to modern society. By considering the above, the authors of [10] divide the night buses routing problem into two subproblems: the candidate bus stop identification and the best bidirectional bus route selection. To address the former, whole city is
2169-3536 (c) 2018 IEEE. Translations and content mining are permitted for academic research only. Personal use is also permitted, but republication/redistribution requires IEEE permission. See http://www.ieee.org/publications_standards/publications/rights/index.html for more information.
This article has been accepted for publication in a future issue of this journal, but has not been fully edited. Content may change prior to final publication. Citation information: DOI 10.1109/ACCESS.2018.2874500, IEEE Access
divided into equal sized small grids where each cell is 10 X
10 meters. Then, the cells with highest PDR (pick-up and
Table 5. Various parameters/factors proposed for personalized route recommendation. Ref #
User Interest/ Rating
Time
Cost/Money/ Energy
Season
Distance
Visited Places
Type of Dataset
Dataset Website/Social Media Platform
Important Criterion for Routing
[37]
Real
GPS/Trajectories
User Rating
[83]
Real
Real People
Travel choices
Real
IgoUgo
MAP
Real
Flickr API
MAP
Real
Flickr
MAP
Real
Panoramio
Directed graph with user preferences
Real
Sina Weibo (aka Twitter of China)
Mean Absolute Error (MAE)
Real and NonReal
Gowalla
Matrix Factorization
Real
Foursquare and Whrrl
User preference + social and geographic influence
[96]
[128]
[68]
[123]
[86]
[11]
[73]
[33]
Real
Foursquare
User Sentiment
[127]
Real
Yelp
Highest User Rating
[87]
Real
Flixster, MovieLens
Utility
[124]
Real
Yelp, MovieLens, Douban Movie
MAE
drop-off rate) are combined to form a big cluster which is later divided into small sized clusters each having a principle bus station which is at a walking distance for a user within the specified cluster. A cluster merging algorithm is also presented allowing a big cluster to merge nearby small clusters if their distance is not greater than a certain limit (i.e., if the absorbed cluster is not too far). For bus route selection, the authors propose a graph theory based three-step process as follows: Build the graph with bus route and remove unnecessary nodes and edges. This process requires
certain proposed criteria to be met such as the maximum distance between two stops is not too high (and is adequate), the bus should always move forward (farther) from the origin and close to destination, and the zigzag routes should be avoided ensuring the smoothness of the routes. Heuristicsbased mathematical equations are also provided for each criterion. The information about the bus and its passengers is recorded in two different matrices known as Time and Flow matrices, respectively. Each element in time matrix represents the bus travel time from one stop to
2169-3536 (c) 2018 IEEE. Translations and content mining are permitted for academic research only. Personal use is also permitted, but republication/redistribution requires IEEE permission. See http://www.ieee.org/publications_standards/publications/rights/index.html for more information.
This article has been accepted for publication in a future issue of this journal, but has not been fully edited. Content may change prior to final publication. Citation information: DOI 10.1109/ACCESS.2018.2874500, IEEE Access
another. Likewise, each entry of Flow matrix corresponds to the number of passengers. Based on above two factors, the authors propose probability algorithm that generates best/optimal route for the passengers. The algorithm selects routes with large number of passengers and less distance. Similar sort of algorithm can also be found in [93].
All the theoretical aspects of [10] are supported by extensive set of experimental results conducted in MATLAB on real-time SBD considering thousands of taxis in Hangzhou, China over a period of one month. Interesting graphical illustrations are presented showing the convergence of proposed algorithm, optimal route selection based on less number of stops, direct relationship between number of stops, and the total traveling time for the buses. The results are compared to the algorithm proposed in [93] reflecting that the proposed algorithm converges to an optimal value. 2. ROUTING ALGORITHMS FOR MODERN DAY BIG DATA NETWORKS
Here we consider routing algorithms designed for BD traffic generated in modern day networks. We focus on various types of networks such as cognitive radio (CR) networks, D2D communications, SDN, energy efficient networks, MANETs (mobile ad hoc networks) and so on. The work cited in this section is not limited to the aforementioned types of networks and can easily be adapted to all kinds of traditional wireless networks. Our classification for this section is summarized in figure 4.
D2D communication [70] plays an important role in BD networks due to its ad-hoc nature, flexible and light weight architectures, and anytime availability especially in critical conditions where the network resources are merely available. The authors of [42] address this interesting concept combining D2D communications with cognitive radio (CR) technology that exploits the unused licensed and unlicensed freely available spectrum [113]. This work falls within the scope of our survey since the devices movement is related to the movement of a person from one geographical location to another and thus, the routing algorithm is proposed based on real-time mobility of people. Basically, by integrating D2D and CR technologies, a “socially aware” big data (greedy) routing algorithm is proposed which uses the mobility of devices and spectrum as benefits for efficient data delivery. Here the mobility of nodes refers to the movement of people from one location to another which is finite and follows a periodic pattern. Same trend applies to the mobility of spectrum which is based on daily activities of licensed or primary users and thus can be predicted having finite patterns. In the proposed “greedy” algorithm, a node ‘x’ chooses the most optimal node in the neighborhood which then acts as a “relay” to forward the data of ‘x’. This optimal selection and relaying process continues unless the data reaches its final destination. Besides the proposed algorithm, the authors describe in detail the concept of CRD2D networks and identify open issues related to routing in these networks (such as effects of weak links on delivery of data, nodes communication overhead, and traffic control) which remained untouched in the existing literature [41].
A. Big Data Routing in Cognitive Radio Device to Device (CRD2D) Networks [42] Big Data Routing Algorithms
Device to Device Networks
Software Defined Networking
Energy Efficient Routing
Other Routing Schemes
Greedy algorithm
Application aware routing algorithm analyzing real time data
Clustering algorithm
Routing for MANETs
Name based routing algorithm using longest prefix matching
Routing for DCN
Algorithm for cloud computing
Figure 4. Division of existing big data routing algorithms in different categories.
B. Application Aware Big Data Routing in SDN SDN has shown great emergence in the recent past. Basically, in SDN, a centralized entity (a software defined
centralized controller) or a platform controls the flow of all the network traffic [80]. The centralized controller adds flexibility in routing by intelligently controlling the flow of
2169-3536 (c) 2018 IEEE. Translations and content mining are permitted for academic research only. Personal use is also permitted, but republication/redistribution requires IEEE permission. See http://www.ieee.org/publications_standards/publications/rights/index.html for more information.
This article has been accepted for publication in a future issue of this journal, but has not been fully edited. Content may change prior to final publication. Citation information: DOI 10.1109/ACCESS.2018.2874500, IEEE Access
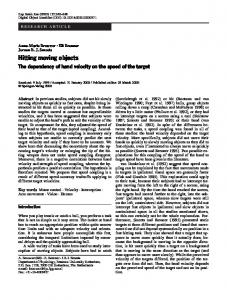
network traffic, thus making the integration of SDN with BD applications a feasible approach. The work proposed in [64] utilizes the “application awareness” advantage of SDN to perform real-time routing. Basically, the authors analyze the traffic patterns of MapReduce [69] based on the information provided by Hadoop (a well-known BD platform) [19]. An entity named as TaskTracker is allowed to store the information about traffic size and volume, which is later communicated to the SDN controller. This novelty was missing in the previous work [51] where the job of TaskTracker was only to send empty hello/heartbeat messages. Based on the information provided by Hadoop (via TaskTracker), the SDN controller performs routing of BD traffic by assigning priorities to one-on-one flows which are remotely located. Flows having all-to-all connectivity are given lower priorities since they have higher freedom in accessing the available bandwidth. For experiments, real-world traffic patterns are generated using sixteen different Hadoop servers with a bandwidth of 10 Mbps and a delay of 1 ms, respectively. Most prominent feature of the results is the comparison of proposed SDN aware routing with existing solutions not utilizing the SDN as a part of their architecture (such as the famous spanning tree algorithm [129]). As expected, all results show the proposed approach significantly reduces the overall traffic shuffling time due to the flexibility added by the SDN controller. Nevertheless, there is no discussion nor any graphical illustration on other important parameters such as the system complexity, number of messages sent and received between Hadoop and SDN controller, and the effect of increased message size on global system performance. C. Routing of Big Data with Energy Efficiency Wireless sensor networks normally produce large amount of data by collecting information from various sensor nodes geographically located in a region or an area. This data is sometimes so large in size that it can easily be termed as big data. The authors of [94] believe that this “multisensor” BD needs to be processed and routed by introducing a new “cluster-based” scheme that also keeps the battery usage level of sensory nodes at minimal. In the proposed approach (figure 5), sensor nodes gather (or sense) the information and forward it to the Base station (BS). This process is known as ‘self-organization’ where nodes learn about their neighbors through broadcasting. The responsibility of forming clustering group remains with the BS which is shown as ‘flat layer design’ in figure 5. The cluster head manages the communication with the BS, floods control messages to neighbors, selects cluster members, and chooses the most energy efficient path for routing as shown with steps 3 ‘cluster layer design’ and 4 ‘cluster member selection’. Thus, all other sensor nodes are exempted from the overhead of optimal route selection. This in turn saves the battery life of senor nodes. Another novelty of the proposed approach is that only those devices form clusters which are at one-hop distance from the BS, thus the directly connected nodes to BS remain
“unclustered”. This also saves energy of sensor nodes. Once the clusters are formed, BD collected by the participating sensors has to be routed (or disseminated) to the desirable destinations. For this, a technique known as “data fusion (step 5)1” is used, which separates data at various clusters both contextually and structurally. Fusion technique also monitors each cluster head’s data processing performance. Results show that the proposed approach has high energy efficiency because; 1) the direct neighbors of BS remain “unclustered” which reduces the number of clusters, and 2) limited number of broadcast messages are exchanged only with selected neighbors. We also highlight the important steps of [94] in figure 5. Another related approach with the focus on energy efficient routing for BD networks is presented in [89]. The entire focus of the proposed solution roams around utilizing the benefits of a content centric network (CCN) [29] for BD retrieval and sharing. An aggregatable named based routing (ANBR) algorithm is proposed that searches the closest copy of data for a user’s request. Longest prefix matching is used to retrieve the desired copy of data requested by the user. Most of the routing information is stored locally which speeds up the retrieval process. Moreover, the authors claim that ANBR is energy efficient because it employs a hierarchical routing structure and uses longest prefix matching for information retrieval where one prefix can serve as a set of data to reduce the size of a routing table. This energy efficiency claim has been proven via simulation results, however, the authors failed to provide any comparison with any existing approach. Another promising energy efficient routing algorithm is reported in [109] with emphasis on BD cloud computing. The authors use extensive mathematical calculations with linear and dynamic approaches to model/calculate the power consumption of the network, network topology, and energy and time required for route computation. The proposed models have been evaluated using real-time statistics of four different routes each having distinct equipment, capacity, and power consumption. The results show that despite having large number of traversed nodes, one of the four routes consumes less energy than the others. This is due to the difference in capacity and power consumption of the equipment used in each route. D. Other Important Routing Algorithms for Various Networks Beside the algorithms presented so far, there are some important research efforts on routing of BD which are worth mentioning here. For example, the work presented in [4] considers analysis of BD traffic generated in MANETs using quality assurance metrics (such as functionality and usability of data). Big data carried by the traditional DSR (dynamic source routing) and AODV (ad hoc on demand distance vector) routing protocols has been simulated using NS2 (network simulator 2). Results depict that AODV performs better than DSR when combined with BD 1
We detail fusion in Section V.
2169-3536 (c) 2018 IEEE. Translations and content mining are permitted for academic research only. Personal use is also permitted, but republication/redistribution requires IEEE permission. See http://www.ieee.org/publications_standards/publications/rights/index.html for more information.
This article has been accepted for publication in a future issue of this journal, but has not been fully edited. Content may change prior to final publication. Citation information: DOI 10.1109/ACCESS.2018.2874500, IEEE Access
analytics. Moreover, another work presented in [26] examines the BD traffic in DCN (data center networks) [119]. The authors tackle a challenging task of determining the conditions in which the traditional routing algorithms can carry BD packets with less loss and high throughput. Thus, Markov chains are used for system analysis and probability estimations. Later, through simulations, it is
1. Self Organization All nodes initially have equal energy Random/uniform distribution of nodes Broadcasting of control packets Neighboring table contains less information
2. Flat Layer Design
Base station does: Not form cluster groups with direct neighbors Form clusters with one-hop neighbors
shown that the time taken to reach a “non-blocking routing” situation is exponential. In addition, the proposed Markov model achieves a good convergence rate over a DCN of large number of nodes due to its simplicity in signaling. This signaling is named as EAR (explicit adaptation requests) in [26] and is performed between various switches to control the packet flow.
5. Data Fusion Data categorization both contextually and structurally Performance measurement and monitoring by data fusion algorithm for each cluster head
3. Cluster Layer Design Centralized approach: all nodes broadcast Distributed approach: difficult to manage due to unpredictable cluster size Proposed approach: few nodes are selected for broadcasting based on packet ID
4. Cluster Member Selection JoinRequest from head to others JoinAccept from node to head (if agreed) Cluster size should not exceed defined threshold
Figure 5. Five functional elements proposed in [94]. V. BIG DATA ANALYSIS FOR MOVING OBJECTS
There are different sources for data generation in moving objects including video devices, sensors, vehicles, etc. The obtained data serve as an input for real-time traffic analysis and decision making; therefore, it is not appropriate to rely only on these sources for data generation. Moreover, the recent advances in data analysis within the context of moving objects focus on proactive control and management [119]. For example, in vehicular communications, the analysis of real-time as well as historical data might result in accurate prediction of collisions and accidents. In the following sub-sections, we discuss several BD learning techniques for moving objects. In particular, we focus on learning techniques used in vehicular communications and intelligent transport system (ITS). 1. LEARNING DRIVEN TECHNIQUES
The existing learning-based mechanisms utilize different metrics which serve as an input for the analysis component [49]. Although, these metrics (such as trip duration) might be useful, however the challenge is that they depend on the traffic conditions, which are highly unpredictable and change over time. Therefore, these shallow traffic prediction models are not reliable for accurate modeling of
the problem and real-world applications [72]. To solve the problem, the authors in [49] propose a new traffic prediction model which utilizes the temporal and spatial correlations. This learning model uses generic traffic flow features in a layered fashion. The area of concern for this model is high computational cost and limited scalability. In [34], a predictor-corrector Kalman filter for travel and arrival time predictions is proposed. The authors use mathematical model with the node-arc network in which arcs represent the roadways while nodes represent the junctions. However, the focus of this contribution was more on mathematical modeling instead of actual traffic flows and condition in the network. Linda and Manic [81] use the active nearest neighbor for the identification of important places. In the second phase of the proposed algorithm, fuzzy logic is employed to compute the risk-level for the places identified in the first step. For the purpose of autonomous navigation in cities, it is extremely important to analyze the trajectory pattern of the vehicles. One of the hurdles in such analysis is the inefficiency of the algorithms that rely on offline trajectory data [75]. This means after completing the learning stage, these algorithms are unable to learn diverse patterns. The
2169-3536 (c) 2018 IEEE. Translations and content mining are permitted for academic research only. Personal use is also permitted, but republication/redistribution requires IEEE permission. See http://www.ieee.org/publications_standards/publications/rights/index.html for more information.
This article has been accepted for publication in a future issue of this journal, but has not been fully edited. Content may change prior to final publication. Citation information: DOI 10.1109/ACCESS.2018.2874500, IEEE Access
solution to this problem is provided in [22] which focuses on incremental learning of trajectory patterns along with the predictions. The authors propose a growing hidden Markov model in which the constraints are derived through online learning for efficient identification of new trajectories. Authors in [82] predict the trajectory of the vehicle using Gaussian model by considering the parameters such as lane-crossing and driver correction events as inputs for learning. Several automatic learning models are discussed in literature considering the mobility in vehicular and D2D networks [35][122]. The authors in [35] propose a semisupervised learning algorithm that represents the activities as sequence of actions and learns those activities as stochastic grammar. Similarly [122] proposes a supervised learning algorithm in which devices can learn the optimal cooperation strategy for providing the relaying services such as audio/video data. Another application of learning algorithms is routing decision in opportunistic networks [129] which uses decision trees and neural networks for efficient routing decisions. The parameters used for learning include routing scheme, device popularity, speed, location, and energy consumption. 2. DATA FUSION BASED TECHNIQUES
Another approach for achieving high performance in BD networks is to use multiple models. For example the work presented in [75] utilizes moving average, autoregressive moving average, and exponential smoothing model for traffic flow predictions. The predictions from these models are utilized in aggregation stage by the neural networks providing the ultimate prediction. Several algorithms fuse the predictions from different models for short-term flow prediction and trajectory changes [77][92]. In [92], the authors fuse the prediction from Kalman filtering in an equation of weighted coefficients. These weighted coefficients are generated in real-time during the prediction process. For efficient analysis and prediction of flow dynamics, the authors in [48] suggest to utilize multi-source driven data fusion strategy. Such a strategy results in extremely broad and holistic information which increases the performance gain. Another data fusion approach is presented in [97] for surveillance and tracking of vehicles. The mechanism is based on robust data alignment that finds relational maps between the invariant feature datasets. These datasets consist of aligned images that are gathered from different unnamed aerial vehicles. Several solutions focus on utilizing multi-source information fusion that combines core evidence for highly dynamic, diverse, and conflicting data received through different sources [82][88]. The ultimate objective is to extract a comprehensive estimate about an event by integrating information received from multiple sources. Authors in [82] analyze several approaches for fusing video streams and propose an algorithm for vehicle trajectory prediction considering the lane-crossing and driver correction events. One of the problems with the proposed approach is that it considers only the most common driving
signals which limit the scope and application for adaptability. The approach used by [88] is based on multisource information that includes fusing data from underground loop detector and GPS. The first part of the algorithm creates a credible and robust platform for the fusion of multi-source data, while, in the second part, wave theory is applied for estimating the mean speed. One of the issues with data collection using roadside sensors and GPS is that the collected data is sparse due to random distribution of vehicles in time and space. Mehta et al. [117] discuss several techniques for flow estimation by considering parameters such as running time and accuracy of used data. It is observed that most of the data comes from probing (roadside sensors, GPS, etc.) at different sampling rates. The authors propose higher sampling interval which results in lower quantity and accuracy of data but provides efficiency in terms of processing. Aris et al. [6] propose a hierarchical structure algorithm for predicting the trajectory of moving objects using the fusion of environmental and vehicle dynamic data. García et al. [44] present a multi-sensory system for the detection of obstacles by using a set of diverse techniques for data fusion. Authors in [104] suggest a new approach which integrates the spatial and temporal information for the flow forecast. For selecting the input variables, they use Pearson correlation coefficient. The resulting multiple outputs are then integrated using a fusion algorithm for final predictions. 3. RULE EXTRACTION BASED TECHNIQUES
One of the important features for learning-driven moving object models is to understand the pattern, association, and correlation among various datasets acquired through different sources. The objective is typically achieved using association rule mining (ARM). The authors in [120] utilize the association analysis with ARM for the prediction of network flow. Similarly, ARM is used for the classification of network flow anomalies in [65]. Another technique for rule extraction is based on rough set theory (RST) [55][56][84]. RST extracts useful data from decision table using induction based decision-making techniques. BD is analyzed using statistical methods and association rule in order to identify the common attributes that appear with high frequency. One of the advantages of using RST is to extract important attributes without having any information outside the dataset. 4. ADP (ADAPTIVE DISTRIBUTED PROGRAMMING)BASED LEARNING CONTROL
Although, learning based techniques seem effective and the results are also quite promising, yet realizing the performance in a highly dynamic and uncertain environment is quite difficult. Several mathematical approaches are proposed to handle such problems [27]. In order to solve complex decision processes having huge and continuous states, authors in [27] propose methods that use reinforcement learning (RL) with dynamic programming. The dynamic programming algorithms are classified into
2169-3536 (c) 2018 IEEE. Translations and content mining are permitted for academic research only. Personal use is also permitted, but republication/redistribution requires IEEE permission. See http://www.ieee.org/publications_standards/publications/rights/index.html for more information.
This article has been accepted for publication in a future issue of this journal, but has not been fully edited. Content may change prior to final publication. Citation information: DOI 10.1109/ACCESS.2018.2874500, IEEE Access
Data Analysis Technique
Learning Driven
Table 6. Brief summary of data analysis techniques discussed in section V and VI. Description Reference Issues Solutions
These techniques are based on the intrinsic mechanism for the moving objects using both real-time and historical data collected through different sources
[22][34][35] [49][72][75] [81][82] [122][129]
Data Fusion
These techniques mostly use multiple models on BD for achieving high performance. The prediction from these models are utilized in aggregation stage
[6][44][75] [77][82][88] [92][97] [104][117]
Data cleansing on the actual received data is challenging. Removing of useless noisy parts is required Multi-dimensional data increases the problem complexity of the analytics Redundant features of data result in possible duplication Heterogeneous data collected from wide variety of sources needs to be incorporated for specific scenarios
Energy consumption is one of the main concerns especially for small devices such as sensors Latency and delay must be within considerable range for fast processing of data Designed algorithms must be scalable having low time and space complexity Realizing the performance in a highly dynamic and uncertain environment is quite difficult
Rule Extraction
Techniques to understand the pattern, association, and correlation among various datasets acquired through different sources
[55][56][65] [84][120]
ADP Based Learning Control
This technique uses ADP and reinforcement learning for the performance optimization of complex dynamic systems
[6][7][8] [27]
Latency and delay must be within considerable range for fast processing of data.
Object Based Learning
The spatial-temporal relationship in traffic flow data and geographical information are important considerations for object based learning
[103][126]
The persistent congestion in sensor and V2V networks might arise due to many reasons including the network congestion, accidents, and so forth [3]
Refining the data and removing the abnormalities [63][123]. Manifold learning and dimension reduction [36][106] Sparsity penalization and reduction in coding complexity [39][43] Using procrustes analysis and canonical correlation [16][59] Use of multi-source driven data fusion strategy providing holistic information Multi-sensory system integrating spatial and temporal information for the flow forecast BD is analyzed using statistical methods and association rule in order to identify the common attributes that appear with high frequency [84] A lot of work still needs to be done but it is expected that dynamic programming variants, methods, and algorithms will provide the basic functionality for realizing an optimized and dynamic system for moving objects Incorporate diverse patterns such as vehicle type in the learning systems, which are ultimately applicable to reallife scenarios
2169-3536 (c) 2018 IEEE. Translations and content mining are permitted for academic research only. Personal use is also permitted, but republication/redistribution requires IEEE permission. See http://www.ieee.org/publications_standards/publications/rights/index.html for more information.
This article has been accepted for publication in a future issue of this journal, but has not been fully edited. Content may change prior to final publication. Citation information: DOI 10.1109/ACCESS.2018.2874500, IEEE Access
two classes. First class is the one that does not need any initial stable policy while the other class of algorithms requires an initial stable policy. Ling et al. [61] study various elements of RL agents such as reward, action set, and state space in the context of traffic flow. One of the most promising features of RL is the ability of an agent to understand the relationship between controlled actions and their consequences on the environment. The authors in [8] utilize this feature and propose a Q-learning method for network traffic control. Salkham et al. [7] utilize the information provided by GPS and V2V (vehicle to vehicle) communication for traffic optimization. They use a local round robin switching model based on RL. A lot of work still needs to be done but it is expected that dynamic programming variants, methods, and algorithms will provide the basic functionality for realizing an optimized and dynamic system for moving objects. 5. OBJECT-BASED LEARNING
The object movement in V2V, sensor networks, or D2D networks has its own unique characteristic which is extremely important for learning driven models and algorithms. The spatial temporal relationship in traffic flow data and geographical information are important considerations for efficient learning-driven systems. It is important to distinguish between two close but unrelated data points that may wrongly be clustered in the same group [103][126]. Similarly, the persistent congestion in V2V networks might arise due to many reasons including the network congestion, accidents, and so forth [3]. The same scenarios are true for sensor networks as well as the other networks involving moving objects. Therefore, it is extremely important to incorporate diverse patterns in the learning systems which are ultimately applicable to real-life scenarios. 6. BIG DATA ANALYSIS FOR SOCIAL MEDIA
Social media and data analysis techniques are extremely important for effective proliferation of user-generated content. The collection of data from social media and its analysis using existing BD tools help in mining users sentiment which results in effective marketing and service activities. The large amount of data produced by the social media users cannot be handled by conventional data management techniques. There is a need of real-time analytics and powerful metrics for the analysis of social media data. The efficient analysis of social media data has created new opportunities to understand and influence how people think and act. The huge volume of social media data combined with the mobility of objects needs fast processing and analysis. The existing data analysis techniques can handle volume, velocity, and variety of data and mining of significant patterns from the data. In this regard, Godbole et al [172] discuss the semantic orientation of words and sentences on social media. Adjectives divided with AND are known to have the equal polarity while the ones divided by BUT have reverse polarity. Adjectives of the same affinity can be
grouped into clusters using statistical model. Another major problem is the summarizing of huge volume of data generated by social media. Ku et al [173] proposed opinion summarization by analyzing the sentiment polarities, degree, and the associated occurrences. However, one of the drawbacks for such approach is that not all opinions are of same importance. For example, the nature of news is quite different from the blog articles. Compared with blog articles, news articles own a larger vocabulary making it harder to retrieve the relevant sentence. In addition to above, several clustering techniques are used for analyzing social media information of moving objects [174][175]. The authors in [175] presented a wide variety of approaches for anomaly detection in social network such as structured, clustering, and Bayesian classifier based techniques. However, despite having this wide variety of work there are a few shortcomings. First, temporal constraints (such as previous information for learning the defined model) need to be added for analyzing social media. Secondly, the analysis of big data in social networks for the presence of anomalies requires a lot of attention. It is important to focus on unstructured behavior of data in social networks rather than predefined set of labeled data or randomly chosen nodes. Table 6 provides the description, issues, and challenges for the BD analysis techniques discussed in sections V and VI. In the next section, we analyze some important research issues that are essential for an efficient data driven moving object system. VI. ISSUES AND FUTURE DIRECTIONS FOR BIG DATADRIVEN MOVING OBJECTS
In the context of V2V communication and BD routing, the use of technology such as GPS, sensors, and other IoT devices provides the important data for analysis. However, using a large number of these devices not only incurs huge cost but also results in redundant data. Another interesting aspect is related to the application of BD analysis on social media. Social media provides diverse information including audio, videos, messages on the fly, and other information generated by sensors attached with the mobile devices. Moreover, social media applications are one of the major sources for BD analysis but there are certain inherited challenges associated with this type of BD. Firstly, it is important to get huge number of users providing reliable data. At the same time, it is required to address the issues related to the security and privacy of users’ data [132][167]. The anonymity of the data must be protected in such a way that not only the data makes sense but it also preserves the identity of the subjects [165][166]. At some point of the time, the analysis of data provides useful information such as traffic routes and congestion notification. The model is a dynamic people-centric model. As discussed in previous sections, data is the main element in any analysis framework. The accuracy and efficiency of data collected from different sources are extremely crucial for the analysis phase as well as the
2169-3536 (c) 2018 IEEE. Translations and content mining are permitted for academic research only. Personal use is also permitted, but republication/redistribution requires IEEE permission. See http://www.ieee.org/publications_standards/publications/rights/index.html for more information.
This article has been accepted for publication in a future issue of this journal, but has not been fully edited. Content may change prior to final publication. Citation information: DOI 10.1109/ACCESS.2018.2874500, IEEE Access
design of routing algorithms. While using clustering and data fusion techniques, the energy consumption is an important concern for the sensory devices [94][109]. Apart from energy consumption, latency and delay must be in considerable range for fast processing of data. Thus, the designed algorithms must be scalable and should have low time and space complexity [89]. In order to reduce the network contention, dynamic routing algorithms must be deployed instead of static ones [26]. In the following subsections, we will discuss some important problems related to the utilization of learningbased systems for moving objects and identify areas for future research as shown in figure 6. The figure shows the learning and cost issues which are explained in detail in the next sub-sections. 1. LEARNING ISSUES
The data gathered from different sources is mostly multidimensional, heterogeneous, and irregular [98]. This leads us to the following four challenges:
A. Data Cleansing and Imputing Data provided by different sources is full of noise [52], therefore, it is extremely important to perform the cleansing of data for removing the useless and noisy parts. The process of data cleansing is not straight forward. The authors in [123] propose a data analysis technique that also performs data cleansing by refining the data and removing the abnormal parts. The noise removal process here is based on statistical estimation information of several noise types. One of the drawbacks with these kinds of approaches is that the noise in reality is arbitrary while these approaches consider it as some known form. Probabilistic principal component analysis (PPCA) [63] is another method used to capture different features of traffic flow. It is also used to filter out the useless and abnormal data that effects the imputation process. PPCA based methods not only consider the local information but also rely on global information such as relationship between historical data.
Figure 6. Issues for BD-Driven moving objects.
B. Dimension Reduction The complexity of learning problem is another issue in data analysis for moving objects. In case of V2V, the vehicle image can be considered having multiple dimensions. The increase in dimensions results in exponential increase in number of samples. There are several dimension reduction techniques proposed in the literature [36][106]. An important method in this context is known as manifold learning [54]. The basic idea behind manifold is discovering the low dimensional manifold integrated in high dimensional Euclidean space. The initial inspiration of manifold is to obtain the nonnegative part from the data [12]. The other method for dimension reduction is Kernel dimension [58]. It uses supervised information to make decision on the dimension reduction. Such methods help to extract very useful information for moving object analysis
and help to improve the performance of learning-driven tasks. C. Sparsity Learning Sparse learning is different from dimension reduction in a sense that it focuses on the removal of certain redundant features (such as dimension reduction of interference data) while preserving the originality of the remaining feature [91][111]. The authors in [91] identify these redundant features and give them extremely low weightage for ensuring smooth removal. Several refinements to this procedure are proposed later in the literature [32][74][32]. The authors in [39] utilize sparsity penalization into the boosting algorithms for attaining higher performance. Although, there are several methods for employing the coding complexity related to the structure of the featured set [43], it is still an important concern to differentiate
2169-3536 (c) 2018 IEEE. Translations and content mining are permitted for academic research only. Personal use is also permitted, but republication/redistribution requires IEEE permission. See http://www.ieee.org/publications_standards/publications/rights/index.html for more information.
This article has been accepted for publication in a future issue of this journal, but has not been fully edited. Content may change prior to final publication. Citation information: DOI 10.1109/ACCESS.2018.2874500, IEEE Access
redundant features and the features crucial for the performance. D. Heterogeneous Learning Another important issue is the heterogeneous property of data that is collected from a wide variety of sources. Data fusion of such heterogeneous data is an extremely challenging task. Although there are several ways to handle the heterogeneous data but two common methods are based on machine learning. The first method uses common space such as Procrustes analysis and canonical correlation [16][59]. These methods assume the linearity of the datasets transformation. Kernel stick is used as another method for transforming linear data to non-linear [95]. 2. COST ISSUES
Cost is still a major concern for data analysis in moving objects. One of the major concerns in this regard is the data collection sources. It is possible to reduce the cost in BD routing by designing an efficient classifier for object recognition [38][53]. Another solution is to utilize low cost alternative devices while improving the performance of the algorithms. It is also possible to use the existing infrastructure deployed for other applications [53][62]. The authors in [45] combine the high accuracy map and the navigation system to propose a lane departure system. Such system reduces the cost by eliminating the requirement for expensive GPS receivers. Similarly, the probe cell phones are used to estimate the travel time between two points. The advantage here is to use the already deployed infrastructure for acquiring the desired data [62]. 3. MULTIMODAL EVALUATION CRITERIA
It is important to measure the effectiveness of any method using different evaluation criteria. The data in moving objects is highly dynamic and varies over time so a static metric may not provide the complete picture [60]. There are different algorithms that consider multimodal evaluation criteria and argue that a single or a certain group of criteria might not be effective for all cases [71]. Hussein et al. [71] evaluated different algorithms using detection error tradeoff curves. It was observed that the detection performance is not influenced due to different sensors however; the window size chosen for modeling the classifiers has significant impact on detection performance. In order to identify the problem in detail and propose a model for solution, we are required to establish a multimodal evaluation criterion considering the dynamic nature of data sources as well as the moving objects [2]. Multimodal evaluation criterion is not important for identifying the problem however, it helps in effective design of the system. VII. CONCLUSION
Recent years have shown a tremendous growth in volume and complexity of spatially generated big data. This growth is due to the decline in prices of portable devices as well as the 24/7 availability of internet connections. The handling and processing of such immensely generated data become more complex when the movement of spatial objects is
random and dynamic. These objects may range from humans to moving vehicles, geographically located sensors to objects and moving animals with RFID chips, and so forth. The data generated by these objects is not small in size, for instance, a person traveling in a car might use several applications together which need real-time analysis and processing. The amount and complexity of this data double with inclusion of modern day social media applications. In this paper, we tried to highlight various important approaches, algorithms, and trends related spatial big data (SBD) and moving objects. We have surveyed sources of SBD generation and highlighted their routing, analysis, and processing techniques. We have observed that there is a variety of techniques to deal with complexity of SBD ranging from personalized routing to data fusion, however still a lot of research has to be done in future for more advanced real-time applications. We concluded our survey by outlining open issues and challenges with some future directions for big data driven moving objects. REFERENCES [1]
[2]
[3] [4]
[5]
[6]
[7]
[8]
[9] [10]
[11]
[12]
[13]
[14] [15]
[16]
A. B. T. Sherif et al., “Privacy-Preserving Ride Sharing Scheme for Autonomous Vehicles in Big Data Era,” IEEE Internet of Things Journal, vol. 4, pp. 611-618, 2016. A. Hobeika, and N. Yaungyai, “Evaluation update of the red light camera program in Fairfax County, VA,” IEEE Trans. Intell. Transp. Syst., vol. 7, pp. 588–596, 2006. A. K. H. Tung, et al., “Spatial clustering in the presence of obstacles,” in Proc. Int. Conf. Data Eng., pp. 359–367, 2001. A. Kush, et al., “Big Data Analytics on MANET Routing Standardization using Quality Assurance Metrics,” IEEE Future Technologies Conference (FTC’16), pp. 192-198, 2016. A. Masini, et al. “Analysis of multiresolution-based fusion strategies for a dual infrared system,” IEEE Trans. Intell. Transp. Syst., vol. 10, pp. 688–694, Dec. 2009. A. Polychronopoulos, et al. “Sensor fusion for predicting vehicles’ path for collision avoidance systems,” IEEE Trans. Intell. Transp. Syst., vol. 8, no. 3, pp. 549–562, Sep. 2007. A. Salkham, et al., “A collaborative reinforcement learning approach to urban traffic control optimization,” in Proc. Web Intelligence and Intelligent Agent Technology, 2008. B. Abdulhai, et al., “Reinforcement learning for the true adaptive traffic signal control,” J. Transp. Eng., vol. 129, pp. 278–285, May/Jun. 2003. Big Data definition, Gartner, Inc. [online] http://www.gartner.com/it-glossary/big-data/ C. Chen, et al., “B-Planner: Planning bidirectional night bus routes using large-scale taxi GPS traces,” IEEE Transactions on Intelligent Transportation Systems, vol. 99, pp. 1-15, 2014. C. Cheng, et al., “Fused matrix factorization with geographical and social influence in location-based social networks,” in Proc. 26th AAAI Conference on Artificial Intelligence, pp. 17-23, 2012. C. Ding, et al., “Convex and semi non negative matrix factorizations,” IEEE Trans. Pattern Anal. Mach. Intell., vol. 32, pp. 45–55, 2010. C. Jardak, et al., “Spatial big data and wireless networks: experiences, applications, and research challenges,” IEEE Network, vol. 28, pp. 26-31, 2014. C. S. Jensen, “Data-Intensive Routing in Spatial Networks,” Keynote speech presented in ACM TURC, 2017. C. Snijders, et al., “Big data: Big gaps of Knowledge in the field of internet science,” International Journal of Internet Science, vol. 7, pp. 1-5, 2012. C. Wang, and S. Mahadevan, “Manifold alignment using Procrustes analysis,” in Proc. Int. Conf. Mach. Learn., pp. 1120–1127, 2008.
2169-3536 (c) 2018 IEEE. Translations and content mining are permitted for academic research only. Personal use is also permitted, but republication/redistribution requires IEEE permission. See http://www.ieee.org/publications_standards/publications/rights/index.html for more information.
This article has been accepted for publication in a future issue of this journal, but has not been fully edited. Content may change prior to final publication. Citation information: DOI 10.1109/ACCESS.2018.2874500, IEEE Access
[17] C. Liu, et al. “A Dynamic Spatiotemporal Analysis Model for Traffic Incident Influence Prediction on Urban Road Networks,” Int. J. Geo-Inf., vol. 6, 2017. [18] C. Wu, et al. “Flow: Architecture and Benchmarking for Reinforcement Learning in Traffic Control”, in Proc of arXiv Journal, October 2017. [19] D. Cheng., et al., “Energy Efficiency Aware Task Assignment with DVFS in Heterogeneous Hadoop Clusters,” IEEE Transactions on Parallel and Distributed Systems, vol. 29, pp. 70-82, 2018. [20] D. D. Lee, and H. S. Seung, “Learning the parts of objects by nonnegative matrix factorization,” Nature, vol. 401, pp. 788–791, 1999. [21] D. Laney, “3D Data Management: Controlling Data Volume, Velocity and Variety,” Technical report, META Group, Inc (now Gartner, Inc.), February 2001. URL http://blogs.gartner.com/douglaney/files/2012/01/ ad949-3D-Data-Management-ControllingData-Volume-Velocity-and-Variety.pdf. [22] D. Vasquez, et al. “Incremental learning of statistical motion patterns with growing hidden Markov models,” IEEE Trans. Intell. Transp. Syst., vol. 10, pp. 403-416, 2009. [23] D. Xia, et al. “A distributed spatial-- temporal weighted model on MapReduce for short-term traffic flow forecasting,” Neuro computing, vol. 179, pp. 246–263, 2016. [24] Draft NIST big data interoperability framework: Volume 1, Definitions, NIST special publication 1500-1, 2015. [25] E. Chaniotakis and C. Antoniou, “Use of Geotagged Social Media in Urban Settings: Empirical Evidence on Its Potential from Twitter,” in Proc. IEEE 18th International Conference on Intelligent Transportation Systems, 2015. [26] E. Zahavi, et al., “Distributed Adaptive Routing for Big-Data Applications Running on Data Center Networks,” in Proc. ACM/IEEE Symposium on Architectures for Networking and Communications Systems (ANCS’12), pp. 99-110, 2012. [27] F. Wang, et al., “Adaptive dynamic programming: An introduction,” IEEE Comput. Intell. Mag., vol. 4, pp. 39–47, May 2009. [28] F. Xia, et al., “Big Scholarly Data: A Survey,” IEEE Transactions on Big Data, vol. 3, pp. 18-35, 2017. [29] G. Edens, et al., ``A better way to organize the internet: Contentcentric networking,'' Blog on IEEE Spectrum, 2017. [30] G. Pauer, “Development Potentials and Strategic Objectives of Intelligent Transport Systems Improving Road Safety,” Transport and Telecommunication Journal, vol. 18, 2017. [31] G. Zhao, et al., “User-Service Rating Prediction by Exploring Social Users’ Rating Behaviors,” IEEE Transactions on Multimedia, vol. 18, pp. 496-506, 2016. [32] G.-J. Qi, et al., “An efficient sparse metric learning in highdimensional space via l1-penalized logdeterminant regularization,” in Proc. Int. Conf. Mach. Learn., pp. 841–848, 2009. [33] H. Gao, et al., “Content-aware point of interest recommendation on location-based social networks,” in Proc. 29th International Conference on AAAI, pp. 1-7, 2015. [34] H. Jula, et al. “Real-time estimation of travel times along the arcs and arrival times at the nodes of dynamic stochastic networks,” IEEE Transaction on Intelligent Transp. Syst., vol. 9, pp. 97-110, 2008. [35] H. Veeraraghavan, and N. P. Papanikolopoulos, “Learning to recognize video-based spatiotemporal events,” IEEE Trans. Intell. Transp. Syst., vol. 10, pp. 628-638, 2009. [36] J. B. Tenenbaum, et al. “A global geometric framework for nonlinear dimensionality reduction,” Science, vol. 290, pp. 2319– 2323, 2000. [37] J. Dai, et al., “Personalized route recommendation using big trajectory data,” in Proc. IEEE ICDE, pp. 543–554, 2015. [38] J. Du, and M. J. Barth, “Next-generation automated vehicle location systems: Positioning at the lane level,” IEEE Trans. Intell. Transp. Syst., vol. 9, pp. 48–57, 2008. [39] J. Duchi, and Y. Singer, “Boosting with structural sparsity,” in Proc. Int. Conf. Mach. Learn., pp. 297–304, 2009. [40] J. Gantz and D. Reinsel., “THE DIGITAL UNIVERSE IN 2020: Big Data, Bigger Digital Shadows, and Biggest Growth in the Far
[41]
[42]
[43] [44]
[45]
[46] [47]
[48]
[49]
[50]
[51]
[52]
[53] [54]
[55]
[56]
[57]
[58] [59]
[60]
[61]
[62]
[63]
[64]
East,” Study report, IDC, December 2012. URL www.emc.com/leadership/digital-universe/index.htm. J. Huang et al., “Mobility Assisted Routing in Intermittently Connected Mobile Cognitive Radio Networks,” IEEE Transactions on Parallel and Distributed Systems, vol. 25, pp. 2956-2968, 2013. J. Huang, et al., “Big data routing in D2D communications with cognitive radio capability,” IEEE Wireless Communications, vol. 23, pp. 45-51, 2016. J. Huang, et al., “Learning with structured sparsity,” in Proc. Int. Conf. Mach. Learn., pp. 417–424, 2009. J. J. García, et al. , “Efficient multisensory barrier for obstacle detection on railways,” IEEE Trans. Intell. Transp. Syst., vol. 11, pp. 702–713, Sep. 2010. J. M. Clanton, et al. “A low-cost solution for an integrated multi sensor lane departure warning system,” IEEE Trans. Intell. Transp. Syst., vol. 10, pp. 47–59, 2009. J. Manyika, et al., “Big data: The next frontier for innovation, competition, and productivity,” Tech. Rep., Mc Kinsey, May 2011. J. S. Ward and A. Barker., “Undefined By Data: A Survey of Big Data Definitions,” ArXiv Prepr ArXiv13095821 [Internet]. 2013 [cited 2014 Mar 28]; Available at: http://arxiv.org/abs/1309.5821 J. Shawe, et al., “Data mining, data fusion and information management,” IEEE, Intell. Transp. Syst., vol. 153, pp. 221–229, 2006. J. W. C. van Lint, “Online learning solutions for freeway travel time prediction,” IEEE Transactions on Intell. Transp. Syst., vol. 9, pp. 38-47, 2008. J. Wang, et al., “Big Data Analytics for Emergency Communication Networks: A Survey,” IEEE Communications Surveys & Tutorials, vol. 18, pp. 1758-1778, 2016. J. Yu, et al., “RTIC-C: A big data system for massive traffic information mining,” in Proc. Cloud Computing and Big Data (CloudCom-Asia), pp. 395–402, 2013. J. Zhang, et al., “Adaptive constraint k-segment principal curves for intelligent transportation system,” IEEE Trans. Intell. Transp. Syst., vol. 9, pp. 666–677, 2008. J. Zhang, et al., “Low-resolution gait recognition,” IEEE Trans. Syst., Man, Cybern. B: Cybern., vol. 40, pp. 986–996, 2010. J. Zhang, et al., “Manifold learning for visualizing and analyzing high-dimensional data,” IEEE Intell. Syst., vol. 25, pp. 54–61, 2010. J.-R. Chang, et al., “Using rough set theory to induce pavement maintenance and rehabilitation strategy,” in Proc. Lecture Notes in Computer Science , vol. 4481, pp. 542–549, Berlin, Germany: Springer-Verlag, 2007. J.-T. Wong, and Y.-S. Chung, “Rough set approach for accident chains exploration,” Accident Anal. Prevention, vol. 39, pp. 629– 637, 2007. K. Boriboonsomsin, et al., “Eco-Routing Navigation System Based on Multisource Historical and Real-Time Traffic Information“, IEEE Transactions on Intelligent Transportation Systems, vol. 13, pp. 1694-1704, 2012. K. Fukumizu, et al., “Kernel dimension reduction in regression,” Ann. Statist., vol. 37, pp. 1871–1905, 2009. K. Fukumizu, et al., “Statistical consistency of kernel canonical correlation analysis,” J. Mach. Learn. Res., vol. 8, pp. 361–383, 2007. K. G. Zografos, and K. N. Androutsopoulos, “Algorithms for itinerary planning in multimodal transportation networks,” IEEE Trans. Intell. Transp. Syst., vol. 9, pp. 175–184, 2008. K. Ling, and A. S. Shalaby, “A reinforcement learning approach to streetcar bunching control,” J. Intell. Transp. Syst., Technol., Planning, Oper., vol. 9, pp. 59–68, 2005. K. Sohn, and K. Hwang, “Space-based passing time estimation on a freeway using cell phones as traffic probes,” IEEE Trans. Intell. Transp. Syst., vol. 9, pp. 559–568, 2008. L. Qu, et al., “PPCA-based missing data imputation for traffic flow volume: A systematical approach,” IEEE Trans. Intell. Transp. Syst., vol. 10, pp. 512–522, 2009. L. W. Cheng and S. Y. Wang, ‘‘Application-aware SDN routing for big data networking,’’ in Proc. IEEE GLOBECOM, pp. 1–6, 2015.
2169-3536 (c) 2018 IEEE. Translations and content mining are permitted for academic research only. Personal use is also permitted, but republication/redistribution requires IEEE permission. See http://www.ieee.org/publications_standards/publications/rights/index.html for more information.
This article has been accepted for publication in a future issue of this journal, but has not been fully edited. Content may change prior to final publication. Citation information: DOI 10.1109/ACCESS.2018.2874500, IEEE Access
[65] L.Trajkovic et al. “Data Mining and Machine Learning for Analysis of Network Traffic”, in Proc. IEEE ICSSE, July 2017. [66] M. B. Cox and D. Ellsworth., “Application-Controlled Demand Paging for Out-of-Core Visualization,” IEEE Visualization, pp. 235–244, 1997. [67] M. Bakillah, et al., “Towards an Efficient Routing Web Processing Service through Capturing Real-time Road Conditions from Big Data,” in Proc. Computer Science and Electronic Engineering Conference (CEEC’13), pp. 152-155, 2013. [68] M. Clements, et al., “Personalised travel recommendation based on location cooccurrence,” arXiv preprint arXiv:1106.5213, 2011. [69] M. Goudarzi, “Heterogeneous Architectures for Big Data Batch Processing in MapReduce Paradigm,” IEEE Transactions on Big Data, Issue 99, 2017. [70] M. Haus, et al., “Security and Privacy in Device-to-Device (D2D) Communication: A Review,” IEEE Communications Surveys and Tutorials, vol. 19, pp. 1054-1079, 2017. [71] M. Hussein, et al., “A comprehensive evaluation framework and a comparative study for human detectors,” IEEE Trans. Intell. Transp. Syst., vol. 10, pp. 417–427, 2009. [72] M. Kubicka, et al., “Performance of Current Eco-Routing Methods,” in Proc. IEEE Intelligent Vehicles Symposium (IV’16), pp. 472-477, 2016. [73] M. Ye, et al., “Exploiting geographical influence for collaborative point-of-interest recommendation,” in Proc. ACM SIGIR , pp. 325– 334, 2011. [74] M. Yuan, and Y. Lin, “Model selection and estimation in regression with grouped variables,” J. Roy. Statist. Soc. B, vol. 68, pp. 49–67, 2006. [75] M.-C. Tan, et al. “An aggregation approach to short-term traffic flow prediction,” IEEE Trans. Intell. Transp. Syst., vol. 10, pp. 60– 69, Mar. 2009. [76] M. Gmira et al. “Travel speed prediction using machine learning techniques”, in Proc of ITS World Congress, 2017 Montreal. [77] M. Ma, et al. “Short-term traffic flow prediction using a selfadaptive two-dimensional forecasting method”, Sage Advances in Mechanical Engineering, vol. 9, 2017. [78] N. Cao, et al., “Privacy-preserving multi-keyword ranked search over encrypted cloud data,” IEEE Transactions on Parallel and Distributed Systems, vol. 25, pp. 222–233, 2014. [79] N. Khan, et al., “Big Data: Survey, Technologies, Opportunities, and Challenges,” The Scientific World Journal, pages. 18, 2014. [80] N. Kitsuwan, et al., “Flows Reduction Scheme Using Two MPLS Tags in Software-Defined Network,” IEEE Access, pp. 1462614637, vol. 5, 2017. [81] O. Linda, and M. Manic, “Online spatiotemporal risk assessment for intelligent transportation systems,” IEEE Trans. Intell. Transp. Syst., vol. 12, pp. 194-200, 2011. [82] P. Angkititrakul, et al., “On the use of stochastic driver behavior model in lane departure warning,” IEEE Trans. Intell. Transp. Syst., vol. 12, pp. 174-183, 2011. [83] P. Campigotto, et al., “Personalized and situation-aware multimodal route recommendations: The Favour algorithm,” IEEE Transactions on ITS, vol. 18, pp. 92-102, 2017. [84] P. Haluzová, “Effective data mining for a transportation information system,” Acta Polytech., vol. 48, pp. 24–29, 2008. [85] P. Illapani., “Big Data for Enterprise Customers Leveraging Hadoop Distributed File System and SAP Real Time Data Platform,” SAP Hana Blog, 2012. [86] P. Lou, et al., “Schedule a Rich Sentimental Travel via Sentimental POI Mining and Recommendation,” in Proc. IEEE Multimedia Big Data (BigMM’16), 2016. [87] Q. Yuan, et al., “Graph-based point-of-interest recommendation with geographical and temporal influences,” in Proc. ACM International Conference on Conference on Information and Knowledge Management (CIKM'14), pp. 659–668, 2014. [88] Q.-J. Kong, et al. “An approach to urban traffic state estimation by fusing multisource information,” IEEE Trans. Intell. Transp. Syst., vol. 10, pp. 499–511, Sep. 2009.
[89] R. Li, et al., “An aggregatable name-based routing for energyefficient data sharing in big data era,” IEEE Access, vol. 3, pp. 955–966, 2015. [90] R. Michael, et al., “Enabling Spatial Big Data via CyberGIS: Challenges and Opportunities,” CyberGIS: Fostering a New Wave of Geospatial Innovation and Discovery (Ed. S. Wang and M. Goodchild), 2014. [91] R. Tibshirani, “Regression shrinkage and selection via the Lasso,” J. Roy. Statist. Soc. B, vol. 58, pp. 267–288, 1996. [92] R. Toledo-Moreo, and M. A. Zamora-Izquierdo, “Imm-based lane change prediction in highways with low-cost GPS/INS,” IEEE Trans. Intell. Transp. Syst., vol. 10, pp. 180–185, Mar. 2009. [93] S. Borzsony, D. Kossmann, and K. Stocker, “The skyline operator,” in Proc. ICDE, pp. 421-430, 2001. [94] S. Din, et al., “A Cluster-Based Data Fusion Technique to Analyze Big Data in Wireless Multi-Sensor System,” IEEE Access, vol. 5, pp. 5069-5083, 2017. [95] S. J. Pan, and Q. Yang, “A survey on transfer learning,” IEEE Trans. Knowledge Data Eng., vol. 20, pp. 1345–1359, 2010. [96] S. Jiang, et al., “Personalized Travel Sequence Recommendation on Multi-Source Big Social Media,” IEEE Transactions on Big Data, vol. 2, pp. 43-56, 2016. [97] S. Jwa, et al., “Information-theoretic data registration for UAVbased sensing,” IEEE Trans. Intell. Transp. Syst., vol. 9, pp. 5–15, 2008. [98] S. K. Barai, “Data mining applications in transportation engineering,” Transport, vol. 18, no. 5, pp. 216–223, 2003. [99] S. Kaisler, et al., “Big Data: Issues and Challenges Moving Forward,” in Proc. 46th Hawaii International Conference on System Sciences (HICSS ’13), pp. 995-1004, 2013. [100] S. Khan, et al., "A Comprehensive Review on Adaptability of Network Forensics Frameworks for Mobile Cloud Computing," The Scientific World Journal, vol. 2014, pages. 27, 2014. [101] S. Madden., “From Databases to Big Data,” IEEE Internet Computing, vol. 16, pp. 4–6, 2012. [102] S. Sagiroglu and D. Sinanc, “Big data: a review,” in Proc. International Conference on Collaboration Technologies and Systems (CTS ’13), pp. 42–47, 2013. [103] S. Shekhar., “Spatial Big Data Challenges,” Tutorial in ARO/NSF Workshop on big data at large: applications and algorithms, USA, 2012. [104] S. Sun, and C. Zhang, “The selective random subspace predictor for traffic flow forecasting,” IEEE Trans. Intell. Transp. Syst., vol. 8, pp. 367–373, Jun. 2007. [105] S. Suthaharan, "Big Data Classification: Problem and challenges in Network Intrusion Prediction with Machine Learning", ACM SIGMETRICS Performance Evaluation Review, vol. 41, pp. 70-73, 2014. [106] S. T. Roweis, and L. K. Saul, “Nonlinear dimensionality reduction by locally linear embedding,” Science, vol. 290, pp. 2323–2326, 2000. [107] S. Yu, et al., “Networking for Big Data: A Survey,” IEEE Communications Surveys & Tutorials, vol. 19, pp. 531-549, 2017. [108] S-N. Orzen, et al., “Routing Tables as Big Data Searchable Structures for Achieving Real-Time Session Fault Tolerance Rerouting” in Proc. IEEE International Symposium on Computational Intelligence and Informatics (CINTI’16), pp. 000261 – 000264, 2016. [109] T. Baker, et al., “Greedi: An energy efficient routing algorithm for big data on cloud,” Elsevier Ad Hoc Networks, vol. 35, pp. 83–96, 2015. [110] T. H. Davenport, “Big Data at Work: Dispelling the Myths, Uncovering the Opportunities,” published by HBR Press, 2014. [111] T. Hastie, et al., “The Elements of Statistical Learning: Data Mining, Inference, and Prediction,” 2nd ed. New York: SpringerVerlag, 2008. [112] T. Kraska., “Finding the Needle in the Big Data Systems Haystack,” IEEE Internet Computing, vol. 17, pp. 84–86, 2013. [113] U. Mir, and A. Munir, “An Adaptive Handoff Strategy for Cognitive Radio Networks,” Springer Wireless Networks (WINE), pp. 1-16, 2017. doi:10.1007/s11276-017-1455-8
2169-3536 (c) 2018 IEEE. Translations and content mining are permitted for academic research only. Personal use is also permitted, but republication/redistribution requires IEEE permission. See http://www.ieee.org/publications_standards/publications/rights/index.html for more information.
This article has been accepted for publication in a future issue of this journal, but has not been fully edited. Content may change prior to final publication. Citation information: DOI 10.1109/ACCESS.2018.2874500, IEEE Access
[114] U. Mir, and L. Nuaymi, “LTE Pricing Strategies,” in Proc. IEEE VTC-Spring, pp. 1-6, 2013. [115] V. Ceikute, et al., “Vehicle Routing with User-Generated Trajectory Data,” in Proc. IEEE International Conference on Mobile Data Management (MDM’15), pp. 14-23, 2015. [116] V. M-Schönberger and K. Cukier, “Big Data: A Revolution That Will Transform How We Live, Work, and Think,” published by Houghton Mifflin Harcour, 2013. [117] Vivek Mehta, and Inderveer Chana. “Urban Traffic State Estimation Techniques Using Probe Vehicles: A Review,” pp. 273– 281. Springer Singapore, 2017. ISBN 978-981- 10-3935-5. [118] W. Lou, et al., “Finding time period-based most frequent path in big trajectory data,” in Proc. SIGMOD, pp. 713-724, 2013. [119] W. Xia, et al., “A Survey on Data Center Network (DCN): Infrastructure and Operations,” IEEE Communications Surveys and Tutorials, vol. 19, pp. 640-656, 2017. [120] Lin, Y.X et al. “Intelligent Transportation System (ITS): Concept, Challenge and Opportunity”. in Proc. IEEE International Conference on High Performance and Smart Computing, Beijing, 2017, pp. 167-172. [121] Y. Lv et al "Traffic Flow Prediction With Big Data: A Deep Learning Approach," in Proc IEEE Transactions on Intelligent Transportation Systems, vol. 16, no. 2, pp. 865-873, April 2015. [122] N. Mastronarde et al. "To Relay or Not to Relay: Learning Deviceto-Device Relaying Strategies in Cellular Networks," in IEEE Transactions on Mobile Computing, vol. 15, no. 6, pp. 1569-1585, June 1 2016. [123] X. Lu, et al., “Photo2trip: Generating travel routes from geo-tagged photos for trip planning,” in Proc. International Conference on Multimedia, pp. 143–152, 2010. [124] X. Qian, et al., “Personalized Recommendation Combining User Interest and Social Circle,” IEEE Transactions on Knowledge and Data Engineering, vol. 26, pp. 1763–1777, 2014. [125] X. Wu, and X. Zhu, “Mining with noise knowledge: Error-aware data mining,” IEEE Trans. Syst., Man, Cybern. A: Syst., Humans, vol. 38, pp. 917–932, 2008. [126] Y. Jin, et al., “Spatial–temporal data mining in traffic incident detection,” in Proc. SIAM Conf. Data Mining, Workshop Spatial Data Mining, Bethesda, MD, 2006. [127] Y. Lyu, et al., “Using multi-criteria decision making for personalized point-of-interest recommendations,” in Proc. 22nd ACM SIGSPATIAL International Conference on Advances in Geographic Information Systems (SIGSPATIAL'14), pp. 461–464, 2014. [128] Y. Shi, et al., “Personalized landmark recommendation based on geo-tags from photo sharing sites,” in Proc. 5th AAAI Conference on Weblogs Social Media, vol. 11, pp. 622–625, 2011. [129] D. K. Sharma et al. "A Machine Learning-Based Protocol for Efficient Routing in Opportunistic Networks," in IEEE Systems Journal, vol. PP, no. 99, pp. 1-7, Dec 2016. [130] Z. Zhou, et al., “Novel Survivable Logical Topology Routing by Logical Protecting Spanning Trees in IP-Over-WDM Networks,” IEEE/ACM Transactions on Networking, vol. 25, pp. 1673-1685, 2017. [131] A. Poorthuis, et al., “Using Geotagged Digital Social Data in Geographic Research,” Pre-published version of Book Chapter in Methods in Geography Social Science Research Network, Rochester, NY, October 2014 SSRN Scholarly Paper ID 2513938, 2014. [132] G. Bello-Orgaz, et al., “Social big data: Recent achievements and new challenges,” Information Fusion, vol. 28, pp. 45–59, 2016. [133] B. Pang and L. Lee, "Opinion mining and sentiment analysis (survey)," 2nd ed. published by Cornell University Press, 2008. [134] W. Medhat, et al., “Sentiment analysis algorithms and applications: A survey,” Ain Shams Engineering Journal, vol. 5, pp. 1093–1113, 2014. [135] K. Ravi and V. Ravi, “A survey on opinion mining and sentiment analysis: Tasks, approaches and applications,” Knowledge-Based Systems, vol. 89, pp. 14–46, 2015. [136] H. Chen, et al., “Business Intelligence and Analytics: From Big Data to Big Impact,” MIS Quarterly, vol. 36, pp. 1165–1188, 2012.
[137] J. LaRiviere, et al., “Where Predictive Analytics is Having the Biggest Impact,” Harvard Business Review, May 2016, URL https://hbr.org/2016/05/where-predictive-analytics-is-having-thebiggest-impact. [138] S. Erevelles, at al., “Big Data consumer analytics and the transformation of marketing,” Journal of Business Research, vol. 69, pp. 897–904, 2016. [139] J. Barney, “Firm Resources and Sustained Competitive Advantage,” Journal of Management, vol. 17, pp. 99–120, 1991. [140] M. van Rijmenam, “Southwest Airlines Uses Big Data To Deliver Excellent Customer Service,” Data Floq, Sep 2017, URL https://datafloq.com/read/southwest-airlines-uses-big-data-deliverexcellent/371. [141] C. Duhigg, “How Companies Learn Your Secrets,” The New York Times Magazine, Feb 2012, URL http://www.nytimes.com/2012/02/19/magazine/shoppinghabits.html. [142] J. Li, et al., “User opinion classification in social media: A global consistency maximization approach,” Information & Management, vol. 53, pp. 987–996, 2016. [143] Z. Zhang, et al., “Deciphering Word-of-mouth in Social Media: Text-based Metrics of Consumer Reviews,” ACM Transaction on Management Information Systems, vol. 3, pp. 1–23, 2012. [144] J. Qi, Z. Zhang, et al., “Mining customer requirements from online reviews: A product improvement perspective,” Information & Management, vol. 53, pp. 951–963, 2016. [145] J. He, et al., “SocoTraveler: Travel-package recommendations leveraging social influence of different relationship types,” Information & Management, vol. 53, pp. 934–950, 2016. [146] Z. Zhou et al., “A method for real-time trajectory monitoring to improve taxi service using GPS big data,” Information & Management, vol. 53, pp. 964–977, 2016. [147] T. B. Murdoch and A. S. Detsky, “The Inevitable Application of Big Data to Health Care,” JAMA, vol. 309, no. 13, pp. 1351–1352, 2013. [148] S. Kumar, et al., “Mobile Health: Revolutionizing Healthcare Through Transdisciplinary Research,” Computer, vol. 46, pp. 28– 35, 2013. [149] M. A. Barrett, et al., “Big Data and Disease Prevention: From Quantified Self to Quantified Communities,” Big Data, vol. 1, pp. 168–175, 2013. [150] J. Wu, et al., “The promising future of healthcare services: When big data analytics meets wearable technology,” Information Management, vol. 53, pp. 1020–1033, 2016. [151] I. Husain, “Researchers show Google Glass can calculate heart rate and respiratory rate,” iMedicalApps, Sep 2014, URL https://www.imedicalapps.com/2014/09/google-glass-calculateheart-rate-respiratory-rate/. [152] N. Sultan, “Reflective thoughts on the potential and challenges of wearable technology for healthcare provision and medical education,” International Journal of Information Management, vol. 35, pp. 521–526, 2015. [153] N. Sultan, “Making use of cloud computing for healthcare provision: Opportunities and challenges,” International Journal of Information Management, vol. 34, pp. 177–184, 2014. [154] M. F. Goodchild and J. A. Glennon, “Crowdsourcing geographic information for disaster response: a research frontier,” International Journal of Digital Earth, vol. 3, pp. 231–241, 2010. [155] G. Cervone, et al., “Using Twitter for tasking remote-sensing data collection and damage assessment: 2013 Boulder flood case study,” International Journal of Remote Sensors, vol. 37, pp. 100–124, 2016. [156] M. F. Goodchild, “Citizens as sensors: the world of volunteered geography,” GeoJournal, vol. 69, pp. 211–221, 2007. [157] S. Dashti, et al., “Supporting Disaster Reconnaissance with Social Media Data: A Design-Oriented Case Study of the 2013 Colorado Floods,” in Proc. 11th International ISCRAM Conference, University Park, Pennsylvania, USA, 2014. [158] J. Howe, "Crowdsourcing: Why the Power of the Crowd Is Driving the Future of Business," 1st ed. New York, NY, USA, published by Crown Publishing Group, 2008
2169-3536 (c) 2018 IEEE. Translations and content mining are permitted for academic research only. Personal use is also permitted, but republication/redistribution requires IEEE permission. See http://www.ieee.org/publications_standards/publications/rights/index.html for more information.
This article has been accepted for publication in a future issue of this journal, but has not been fully edited. Content may change prior to final publication. Citation information: DOI 10.1109/ACCESS.2018.2874500, IEEE Access
[159] Z. Xu et al., “Crowdsourcing based Description of Urban Emergency Events using Social Media Big Data,” IEEE Transactions on Cloud Computing, 2017. [160] J. P. de Albuquerque, et al., “A geographic approach for combining social media and authoritative data towards identifying useful information for disaster management,” International Journal of Geographical Information Science, vol. 29, pp. 667–689, 2015. [161] R. Ranjan, et al., "Urban Risk Analytics in the Cloud," IT Professional, vol. 19, pp. 4-9, 2017. [162] P. Goel, et al., "Optimal Pick up Point Selection for Effective Ride Sharing," IEEE Transactions on Big Data, vol. 3, pp. 154-168, 2017. [163] B. J. Jensen et al., “Twitter Power: Tweets as Electronic Word of Mouth”, Journal of the Association for Information Science and Technology, vol. 60 , no. 11, pp. 2169-2188, 2009. [164] A. Bharadwaj, et al., “Digital Business Strategy: Toward a Next Generation of Insights”, Management Information Systems, vol. 37, no. 2, pp. 471-482, 2013. [165] Y. Qu., et al., "Big data set privacy preserving through sensitive attributesed grouping," in Proc. IEEE ICC, pp. 1-6, 2017. [166] S. Yu., "Big Privacy: Challenges and Opportunities of Privacy Study in the Age of Big Data," IEEE Access, vol. 4, pp. 2751-2763, 2016. [167] R. Y. K. Lau and G. Chen, “Big Data Commerce”, Information & Management, vol. 53, pp. 929-933. 2016. [168] H. Yao et al., “Mining multiple spatial-temporal paths from social media data”, Future Generation Computer Systems, vol. 87, pp. 782-791, 2017. [169] M. C. Gonzalez et al., “Understanding individual human mobility patterns”, Nature, vol. 453, pp. 779-782, 2008. [170] J. Yuan et al., "Discovering regions of different function in a city using human mobility and POIs", in Proc. 18 th International Conference on Knowledge Discovery and Data Mining (ACM SIGKDD), pp. 186-194, 2012. [171] D. Sui and M. Goodchild, "The convergence of GIS and social media: challenges for GIScience", vol. 25, no. 11, pp. 1737-1748, 2011. [172] N. Godbole, et al., “Large Scale Sentiment Analysis for News and Blogs,” in Proc. International Conference on Weblogs and SM (ICWSM’07), 2007.. [173] ] L.-W. Ku, et al., “Opinion Extraction, Summarization and Tracking in News and Blog Corpora,” in Proc. Spring Symposia on Computational Approaches to Analyzing Weblogs (AAAICAAW'06), 2006. [174] A. Alsayat, et al., “Social media analysis using optimized K-Means clustering,” in Proc. IEEE International Conference on Software Engineering Research, Management and Applications, pp. 61-66, 2016. [175] R. Kaur and S. Singh, “A survey of data mining and social network analysis based anomaly detection techniques,” Egypt. Informatics J., vol. 17, pp. 199–216, 2015. [176] W. Shi, et al., "Challenges and Prospects of Uncertainties in Spatial Big Data Analytics," Annals of the American Association of Geographers, pp. 1-8, 2018. 10.1080/24694452.2017.1421898. [177] C. A. Ferrero, et al, “Multiple Aspect Trajectory Data Analysis: Research Challenges and Opportunities,” GEOINFO, pp. 56-67, 2016.
2169-3536 (c) 2018 IEEE. Translations and content mining are permitted for academic research only. Personal use is also permitted, but republication/redistribution requires IEEE permission. See http://www.ieee.org/publications_standards/publications/rights/index.html for more information.