Ann. Geophys., 30, 1693–1701, 2012 www.ann-geophys.net/30/1693/2012/ doi:10.5194/angeo-30-1693-2012 © Author(s) 2012. CC Attribution 3.0 License.
Annales Geophysicae
Spatial characteristics of wave-like structures in diffuse aurora obtained using optical observations K. Axelsson1,2 , T. Sergienko1 , H. Nilsson1 , U. Br¨andstr¨om1 , Y. Ebihara3 , K. Asamura4 , and M. Hirahara5 1 Swedish
Institute of Space Physics, Kiruna, Sweden of Space Technology, Lule˚a University of Technology, Kiruna, Sweden 3 Research Institute for Sustainable Humanosphere, Kyoto University, Kyoto, Japan 4 Institute of Space and Astronautical Science, Japan Aerospace Exploration Agency, Sagamihara, Japan 5 Department of Earth and Planetary Science, Graduate School of Science, University of Tokyo, Tokyo, Japan 2 Division
Correspondence to: K. Axelsson (
[email protected]) Received: 28 June 2012 – Revised: 13 November 2012 – Accepted: 23 November 2012 – Published: 14 December 2012
Abstract. We present the results of a statistical study using optical images from ALIS (Auroral Large Imaging System) to investigate the spatial and temporal variations of structures in diffuse aurora. Analysis of conjugate Reimei data shows that such fine structures are a result of modulation of highenergy precipitating electrons. Pitch angle diffusion into the loss cone due to interaction of whistler mode waves with plasma sheet electrons is the most feasible mechanism leading to high-energy electron precipitation. This suggests that the fine structure is an indication of modulations of the efficiency of the wave–particle interaction. The scale sizes and variations of these structures, mapped to the magnetosphere, can give us information about the characteristics of the modulating wave activity. We found the scale size of the auroral stripes and the spacing between them to be on average 13– 14 km, which corresponds to 3–4 ion gyro radii for protons with an energy of 7 keV. The structures move southward with a speed close to zero in the plasma convection frame. Keywords. Ionosphere (Particle precipitation; Waveparticle interactions) – Magnetospheric physics (Auroral phenomena)
1
Introduction
Diffuse aurora is characterized by a broad area of fairly uniform luminosity. Some might call it the least spectacular form of aurora, but it is the most energetically important one. It contributes to the majority of the energy input from the
magnetosphere into the polar ionosphere during both active and quiet geomagnetic conditions (Newell et al., 2009). Recent studies have shown that the diffuse aurora is caused by precipitation of plasma sheet electrons with energies of a few to tens of keV that are scattered into the loss cone due to interaction with whistler mode waves (Ni et al., 2011a,b), while the more dynamic discrete aurora is caused by particles that are accelerated along the magnetic field lines. Optical observations of diffuse aurora have shown that it often contains fine structures. At first it was believed that these structures were small-scale discrete auroral structures, caused by accelerated electrons, but later studies show that they in fact are variations of the modulation of the diffuse auroral precipitation. Ebihara et al. (2010) and Samara et al. (2010), among others, have reported observations of smallscale structures in diffuse aurora caused by precipitation of non-accelerated high-energy electrons. Variations in diffuse auroral structures, both spatial and temporal, can be used to study the magnetospheric wave processes responsible for scattering electrons into the loss cone. Samara and Michell (2010) looked at the frequency of pulsating diffuse auroral structures to study the wave activity causing the scattering, and found that they were consistent with frequencies of chorus waves. Structure in diffuse aurora is sometimes called black aurora. Obuchi et al. (2011) and Peticolas et al. (2002) studied the relationship between black aurora and precipitating electrons using optical and particle data and concluded that the regions of black aurora are caused by suppression of pitch angle scattering by whistler mode waves.
Published by Copernicus Publications on behalf of the European Geosciences Union.
1694
K. Axelsson et al.: Spatial characteristics of wave-like structures in diffuse aurora
One type of structure often found in diffuse aurora is regular, parallel stripes. Sergienko et al. (2008) studied this type of structure using optical data from ALIS (Auroral Large Imaging System) and electron spectrometer data from the FAST satellite. They found that this regular pattern is caused by the modulation of the efficiency of the pitch angle diffusion of high-energy electrons. Li et al. (2011a) found that the modulation of chorus waves, which leads to the modulation of the auroral luminosity, can be caused by density variations or compressional Pc4–5 pulsations. These mechanisms each play a dominant role in different parts of the magnetosphere (Li et al., 2011a,b). In this study we use ALIS images to investigate the spatial and temporal variations of the diffuse aurora. We are interested in structures that create the wavy pattern seen in the ALIS images. The scale sizes of these structures are of the order of about 1–20 km. The scale size and the variation of the structures, mapped to the magnetosphere, provide information about the characteristics of the modulating wave activity. Reimei data are also available for one event confirming that the structures correspond to non-accelerated electrons. From the same event, magnetometer chain data are also available providing information about how the structures move in relation to the background source plasma. This will constrain the possible processes giving rise to the structured diffuse aurora. Our objective is to present the observational data and give examples of mechanisms that are consistent with our results. 2
Instrumentation
ALIS (Br¨andstr¨om, 2003) currently consists of five remotely controlled stations in northern Scandinavia. Each station is equipped with a sensitive CCD detector with a 1024 × 1024 pixel and a filter wheel with six positions for narrow-band interference filters. The stations are separated from each other by a distance of approximately 50 km and are located so that their fields-of-view overlap, which makes it possible to study the aurora from different angles simultaneously. In this study we use data from the Kiruna (67.86◦ N, 20.42◦ E) and Skibotn (69.35◦ N, 20.36◦ E) stations for cases when the cameras are looking at zenith. With a total pixel number of 1024 × 1024 and a binning of 4 × 4, the image size used was 256 × 256 pixels, with a 70◦ and 90◦ field of view. Thus the pixel resolution is approximately 500 m and 700 m at an altitude of 110 km for the Kiruna and Skibotn cameras respec˚ filter with 1 s exposure time and a tively. We use a 5577 A time interval between exposures of 10–15 s.
Ann. Geophys., 30, 1693–1701, 2012
3
Observations
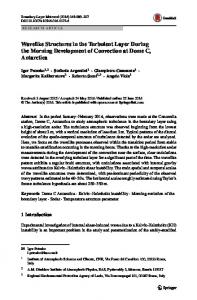
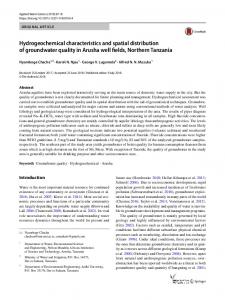
Widths of diffuse auroral strips were collected using the ALIS camera in Kiruna and Skibotn separately, during five events (18 December 2006, 8 November 2007, 5 December 2007, 15 December 2007 and 25 January 2008). In total 514 diffuse auroral structures were measured. Events were selected where it was possible to find stable structures, meaning that they do not change significantly in shape during a period of 2–3 min. Figure 1 shows examples of such structures, taken during two of the selected events. The primary interest in this study is structures creating the wavy pattern seen in the ALIS image and occurring in the equatorward part of the auroral zone during the recovery phase of a substorm, i.e. after injection of particles into the magnetosphere. The structures are stretched out from east to west, forming stripes of higher and lower (background) luminosity. Figure 2 shows keograms and magnetometer data for the same events as in Fig. 1. The first event shows a typical substorm, with breakup starting around 21:52 UT. The area of interest for our study lies between the two black lines in the keogram, i.e. between 23:00 and 24:00 UT, in the recovery phase of the substorm. This first event has similar geomagnetic conditions and is also, from a morphological point of view, similar to an event studied by Sergienko et al. (2008) where it was suggested that these auroral stripes were created by precipitation of high-energy electrons as a result of pitch angle diffusion into the loss cone by whistler mode waves. The events of 18 December 2006, 15 December 2007 and 25 January 2008 are similar from a morphological point of view. The remaining two events, 8 November 2007 and 5 December 2007, have slightly different morphology. For the latter we also have particle data from the Reimei satellite (Asamura et al., 2003) presented in Figs. 3 and 4. The lefthand panel of Fig. 3 shows the track of the satellite (red line) as it passes the field of view of the ALIS imager at the Skibotn station. The axes show the pixel number, but the image is oriented in such a way that the lower border is to the south and the upper border to the north. The right-hand panel of Fig. 3 shows the energy spectrum along the satellite track as a function of geographical latitude, moving from the bottom part of the ALIS image to the top. The electron spectra show a high flux in the 2–6 keV range across the whole image. In the most poleward part of the image, there is also a population of accelerated, lower energy electrons, with a peak energy of 500–800 eV. An enhancement of the more energetic electron fluxes can be discerned where the satellite crosses areas of higher luminosity that correspond to the diffuse auroral stripes. The enhancement is further emphasized in Fig. 4, where the left-hand panel shows the estimated intensity for the green auroral line, from Reimei data (black line) along with the intensity obtained from three consecutive ALIS images taken during the passage of the satellite. It is clearly seen how the electron flux intensity increases as the satellite passes www.ann-geophys.net/30/1693/2012/
K. Axelsson et al.: Spatial characteristics of wave-like structures in diffuse aurora
1695
Fig. 1. Example of images from two of the events. Upper panel shows images from the Kiruna camera from 18 December 2006, and the lower panel shows images from the Skibotn station from 5 December 2007. The red dot marks the location of magnetic zenith. The yellow line is the line along which the intensity profile in Fig. 5 was taken.
the auroral stripes. We also clearly see that the structures do not change much during the passage of Reimei through the field of view of the ALIS camera. The middle and righthand panel of Fig. 4 show the energy spectra inside and outside one of the diffuse structures. There is no difference between the downgoing and the trapped electrons inside the stripe. Outside the stripe the downgoing electron flux decreases more rapidly with energies greater than 3 keV. This suggests that electrons were not accelerated but instead scattered due to pitch angle diffusion. Thus enhanced precipitation of the more energetic electrons of 2–6 keV energy is responsible for the diffuse aurora, in accordance with some previous studies (Ebihara et al., 2010; Samara et al., 2010). In one case, where it was possible to use data from more than one station, the altitude of the aurora was determined using triangulation. By fitting the projection altitude and finding the best match from two images taken at different locations, the altitude was estimated at around 110 km, which is a typical altitude for the green line emission peak in diffuse aurora. In the remaining cases the same altitude was used. Changing the altitude from 100 to 110 km changes the width by approximately 0.5 km, which is much less than the scale sizes that we are interested in and does not have a significant effect on the result. Taking into account a north–south drift speed of around 65–220 m s−1 (discussed further in Sect. 4)
www.ann-geophys.net/30/1693/2012/
and an exposure time of 1 s, the effect of smearing due to drifting of the structures is negligible. Errors due to perspective effects also need to be taken into account. When looking at a structure that is not in magnetic zenith, it will appear to be broader since we will be measuring not only the width of the structure but also part of the height. There will also be a contribution from the background luminosity. For this reason we chose to look only at structures that are within 10 degrees from magnetic zenith. 4
Method and results
We have analysed about 500 diffuse stripe-like structures, recorded during five events, using ALIS. All the structures were extended in the east–west direction, aligned along a geomagnetic latitudinal line, and the brightness profile was taken across the image in the north–south direction (in geographical coordinates). The geomagnetic parallel and geographic parallel are not co-located; hence, the results were adjusted by multiplying with the cosine of the deviation angle. To determine the width of each stripe, a multiple Gaussian was fitted to the brightness profile (see Fig. 5). By fitting a Gaussian function (black) to each peak, we were able to retrieve the full width at half maximum (FWHM), which corresponds to the stripe width. The expression for the multiple Gaussian used is
Ann. Geophys., 30, 1693–1701, 2012
1696
K. Axelsson et al.: Spatial characteristics of wave-like structures in diffuse aurora
Fig. 2. (a) Keogram made from images from the Kiruna station from 18 December 2006. Stripe widths were calculated for the time interval 23:00–00:00 UT, marked with two black lines in the figure. (b) Magnetogram for the same event. (c) and (d) are the same as (a) and (b) but for the Skibotn ALIS camera, 18 December 2006 and 5 December 2007. The magnetogram is retrieved from data from magnetometers in Kiruna and Tromsø respectively.
Fig. 3. Left: ALIS image from Skibotn station taken on 5 December 2007 at 00:36:30 UT, along with the Reimei track (red line) marked with the geographical latitude in degrees. Right: electron energy spectrum as a function of geographical latitude, i.e. along the track of the Reimei satellite.
Y = V0 +
X
V1i exp(−(x − V2i )2 /2V3i2 )
i
where V0 is the background luminosity, V1i the amplitude for the Gaussian curve, V2i the position of the peak, and √ i is the number of the stripes. The FWHM is given by 2V3 2 ln(2). Ann. Geophys., 30, 1693–1701, 2012
In total 514 diffuse auroral structures were measured, and the result is shown in Fig. 6. The size ranges from 2.2 to 46.8 km with a mean value at 13.2 km, and the distance between the stripes ranges from 4.0 km and 37.2 km with a mean value at 14.0 km. The planetary Kp index value ranged
www.ann-geophys.net/30/1693/2012/
K. Axelsson et al.: Spatial characteristics of wave-like structures in diffuse aurora
1697
Fig. 4. Left: the black line shows the intensity for the green auroral line, calculated from Reimei data. The red, green and blue lines are the intensity obtained from three consecutive ALIS images taken during the passing of the satellite. Middle: energy spectra inside one of the auroral stripes for downgoing (pitch angle 0–30◦ ) and trapped electrons (60–90◦ ). Right: energy spectra between the stripes for downgoing and trapped electrons.
Fig. 6. Left: histogram of measured widths, for all events, obtained from structures within 10◦ from magnetic zenith. Right: distance between maximum intensity of the stripes
Fig. 5. The intensity profile taken along a line across the auroral stripes (green), with the fitted multiple Gaussian curve (black). The red line shows the location of magnetic zenith.
from 0 to 4 and the AE index between 0 and 500 nT, and we found no clear dependence of the width on either Kp or AE index. All five events show a clear southward movement of the auroral structures. The apparent velocity of the structures, obtained from the ALIS keograms, lies between 65 and 220 m s−1 . Additional data from European Incoherent Scatter (EISCAT) radar or the Super Dual Auroral Radar Network (superDARN) could give information about the convection velocity, but unfortunately we do not have usable data for our events. Instead we use equivalent ionospheric currents derived from magnetometer data obtained from the Magnetometers-Ionospheric Radars-All-sky Cameras Large Experiment (MIRACLE) to get a proxy of the north–south convection velocity (Vanham¨aki et al., 2003). Equivalent www.ann-geophys.net/30/1693/2012/
ionospheric currents derived from magnetometer chain data give a robust estimate of the latitudinal extent of the ionospheric convection region, so that we get a reliable estimate of north–south expansion of the convection cells, corresponding to north–south motion of the structures. The ionospheric equivalent currents correspond mainly to the Hall currents. They arise due to the E × B drift of plasma and can be used to get a macroscopic picture of the ionospheric convection. Figure 7 is an example of the comparison between ionospheric currents and the drift of the structures for one of the events. The upper panel shows the ionospheric equivalent currents, measured from ground magnetometers. The lower panel is a combination of the ALIS keogram and a contour plot of the equivalent currents from the MIRACLE data. The green stars represent the peak position of three stripes, determined using a Gaussian fit, that were followed through several consecutive images. We cannot get an exact value of the relative velocity, but we do see that the motion of the structure is closely related to the motion of the current system. A rough estimation of the velocity of the ionospheric currents gives a result of 160 m s−1 above Kiruna. The difference between the velocities of the stripes and the velocity of Ann. Geophys., 30, 1693–1701, 2012
1698
K. Axelsson et al.: Spatial characteristics of wave-like structures in diffuse aurora
Fig. 7. Upper panel: MIRACLE ionospheric equivalent current from 18 December 2006. The ionospheric equivalent currents are calculated from magnetometers on the ground. The black box marks the position, in time and latitude, for the lower panel. Lower panel: keogram of ALIS images from the same date with contour lines representing the equivalent currents from the image above. The green stars represent the movement of three auroral stripes.
the currents is much less than the convection velocity itself. This means that the stripes are approximately moving with the convection in the north–south direction. This indicates a steady state wave structure, moving with almost zero velocity in the plasma convection frame. Previous studies of auroral arc widths show, just as Partamies et al. (2010) concluded in their study, that the measured widths depend on the spatial resolution of the instrument. Their statistics, along with previous results (Maggs and Davis, 1968), show a sharp cut-off near the lower limit of what their instruments were able to measure. Our statistics lack this type of cutoff near the lower resolution limit of the ALIS imagers; instead our statistics show a more Gaussian shape with a mean value far above what our images are able to resolve. We therefore conclude that the results obtained in this study are not dependent upon the resolution of our instrument. Another source of errors is the broadening of structures that occurs due to perspective effects. This effect is demonstrated in Fig. 8. The left-hand panel shows statistics of stripe
Ann. Geophys., 30, 1693–1701, 2012
widths within 10 degrees from magnetic zenith, and the righthand panel shows stripe widths from the whole field of view. We clearly see a more distinct tail on the right-hand side of the distribution when we include structures from the whole field of view. The perspective effect will be there even for smaller angles, but we will still be able to get an estimate of the widths without significant systematical errors. 5
Discussion
The regular wavy pattern observed in the ALIS images indicates a modulation of the efficiency of the wave–particle interaction, causing the diffuse aurora. Both the optical images and the statistical result show a regular pattern of stripes of higher and lower luminosity, with an average width almost equal to the spacing between them, resembling a wave-like pattern for which the most plausible explanation is a standing or propagating wave. The scale size of the parallel auroral structures, mapped to the equatorial plane of the magnetosphere, can give an www.ann-geophys.net/30/1693/2012/
K. Axelsson et al.: Spatial characteristics of wave-like structures in diffuse aurora
1699
Fig. 8. Histograms of widths from the two events discussed in Sect. 3. The left-hand panel show statistics from the limited region around 10◦ from magnetic zenith. To demonstrate the broadening effect that arises when we measure structures far away from magnetic zenith, the histogram in the right-hand panel includes stripes from the whole field of view.
indication of the scale size of such a wave. From this study we obtained stripe widths on the order of a few tens of km, with a mean value at 13.2 km. The range between 5 and 23 km contains 80 % of the stripes. Mapped to the equatorial plane of the magnetosphere, to L-shell 5.6 and 6.3 (for Kiruna and Tromsø respectively), using the Tsyganenko model (Tsyganenko and Sitnov, 2007), this range corresponds to 75–345 km. The characteristic energy of injected protons in the magnetospheric source region is around 7 keV (Christon et al., 1991). We compare our results to the ion gyro radius, which was estimated to be around 53 km for 7 keV protons, and find that the stripe widths correspond to roughly 1–6 ion gyro radii. The distances between the stripes are equal to or slightly larger than the stripe widths. The mean value is 14.0 km, and 80 % lie within the range of 8–21 km. If the modulation causing the regular pattern is a pure harmonic wave, the distance between the peaks would equal two times the widths. In our case we find that the widths are almost equal to the spacing between the stripes, which suggests that the process responsible for the interaction of whistler mode waves and electrons has a certain threshold. As the stripe width is greater than half the peak-to-peak distance, the pitch angle scattering process is active during most of the wave, and inhibited only during a small part. We also compared the southward drift of the auroral structures with the ionospheric equivalent currents and found that they move together with convection with a relative speed that is close to zero.
www.ann-geophys.net/30/1693/2012/
Our observational data thus show signs of a standing or propagating wave with low velocity and wavelengths on the order of a few ion gyro radii. As discussed in the introduction, we expect that the structure in the observed diffuse aurora corresponds to density or magnetic field structures in the equatorial magnetosphere, which serve to modulate the wave–particle interaction and lead to electron precipitation. Ebihara et al. (2010) suggested that the diffuse aurora they observed was the visual manifestation of highly structured cold plasma in the magnetosphere. The existing structures could affect the wave–particle interaction causing precipitation of newly injected more energetic electrons. Such pre-existing structures would move together with convection, which is in agreement with our observations. The size of the structures would not be dependent on the parameters of the newly injected plasma. Cold plasma structures can for example be created by temporal changes of the convection electric field (Chen and Wolf, 1972). Another class of structures in the magnetosphere is discussed by Stasiewicz and Cheng (2009) – mirror mode structures propagating as slow magnetosonic solitons. The scale sizes of magnetic field and density structures predicted by this theory are in good agreement with our observations (up to a few ion inertial lengths of about 100 km in the equatorial plane). The problem is that these structures, though slow for magnetosonic waves, still move much faster than our structures, with a speed of about 50 km s−1 in the plasma reference frame. This corresponds to a velocity of a few km s−1 in the ionosphere.
Ann. Geophys., 30, 1693–1701, 2012
1700
K. Axelsson et al.: Spatial characteristics of wave-like structures in diffuse aurora
Another, related, option is stationary mirror mode structures as reported by Ge et al. (2011). These mirror mode structures were observed by the THEMIS-D spacecraft in the dipolarized magnetic field following a substorm-related dipolarization. The scale size of the mirror mode structures was about one ion gyro radii, which is somewhat smaller than our observations. The width of mirror mode structures in the solar wind is of the order of 10 proton gyro radii (Zhang et al., 2008), so larger structures are not unlikely. As these structures are stationary, they would drift with convection. The magnetic field troughs caused by the mirror mode instability are longer-lived than the magnetic field enhancements, and will exist after the instability criterion is no longer fulfilled. This is therefore a promising candidate to explain our structures.
6
Conclusions
We have used optical data from the Auroral Large Imaging System (ALIS) to perform a statistical study of spatial and temporal variations of diffuse auroral structures. The scale size of the structures gives us information about the mechanism producing these regular wavy patterns found in diffuse aurora. The widths of the diffuse auroral structures found in this study are of the order of a few tens of km and appear in a regular pattern. The mean values of the stripe widths and the spacing between stripes are 13–14 km, and 80 % of the stripes lie within a range of 5–23 km. This range is mapped to the equatorial plane of the magnetosphere, and gives a width of approximately 75–345 km, corresponding to a few ion gyro radii. These structures move southward with a speed close to zero in the plasma convection frame. Stationary mirror mode structures in the magnetospheric equatorial plane appear to be a plausible mechanism giving rise to the observed structures.
Acknowledgements. K. Axelsson is supported by the Swedish National Graduate School of Space Technology, Lule˚a University of Technology. ALIS is supported by the Swedish Research Council. We thank Ari Viljanen (FMI) for providing MIRACLE data. Topical Editor R. Nakamura thanks two anonymous referees for their help in evaluating this paper.
References Asamura, K., Tsujita, D., Tanaka, H., Saito, Y., Mukai, T., and Hirahara, M.: Auroral particle instrument onboard the index satellite, Adv. Space Res., 32, 375–378, 2003. Br¨andstr¨om, U.: The Auroral Large Imaging System-Design, operations and scientific results, Ph.D. thesis, Swedish Institute of Space Physics, Kiruna, Sweden, October 2003 (IRF Scientific Report 279), ISBN: 91-7305-405-4, 2003.
Ann. Geophys., 30, 1693–1701, 2012
Chen, A. J. and Wolf, R. A.: Effects on the plasmasphere of a timevarying convection electric field, Planet. Space Sci., 20, 483– 509, 1972. Christon, S. P., Williams, D. J., Mitchell, D. G., Huang, C. Y., and Frank, L. A.: Spectral Characteristics of Plasma Sheet Ion and Electron Populations during Disturbed Geomagnetic Conditions, J. Geophys. Res., 96, 1–22, doi:10.1029/90JA01633, 1991. Ebihara, Y., Sakanoi, T., Asamura, K., Hirahara, M., and Thomsen, M. F.: Reimei observation of highly structured auroras caused by nonaccelerated electrons, J. Geophys. Res., 115, A08320, doi:10.1029/2009JA015009, 2010. Ge, Y. S., McFadden, J. P., Raeder, J., Angelopoulos, V., Larson, D., Constantinescu, O. D.: Case studies of mirror-mode structures observed by THEMIS in the near-Earth tail during substorms, J. Geophys. Res., 116, A01209, doi:10.1029/2010JA015546, 2011. Li, W., Thorne, R. M., Bortnik, J., Nishimura, Y., and Angelopoulos, V.: Modulation of whistler mode chorus waves: 1. Role of compressional Pc4-5 pulsations, J. Geophys. Res., 116, A06205, doi:10.1029/2010JA016312, 2011a. Li, W., Thorne, R. M., Bortnik, J., Thorne, R. M., Nishimura, Y., Angelopoulos, V., and Chen, L.: Modulation of whistler mode chorus waves: 2. Role of density variations, J. Geophys. Res., 116, A06206, doi:10.1029/2010JA016313, 2011b. Maggs, J. E. and Davis, T. N.: Measurements of the thicknesses of Auroral structures, Planet. Space Sci., 16, 205–209, 1968. Newell, P. T., Sotirelis, T., and Wing, S.: Diffuse, monoenergetic, and broadband aurora: The global precipitation budget, J. Geophys. Res., 114, A09207, doi:10.1029/2009JA014326, 2009. Ni, B., Thorne, R. M., Horne, R. B., Meredith, N. P., Shprits, Y. Y., Chen, L., and Li, W.: Resonant scattering of plasma sheet electrons leading to diffuse auroral precipitation: 1. Evaluation for electrostatic electron cyclotron harmonic waves, J. Geophys. Res., 116, A04218, doi:10.1029/2010JA016232, 2011a. Ni, B., Thorne, R. M., Meredith, N. P., Horne, R. B., and Shprits, Y. Y.: Resonant scattering of plasma sheet electrons leading to diffuse auroral precipitation: 2. Evaluation for whistler mode chorus waves, J. Geophys. Res., 116, A04219, doi:10.1029/2010JA016233, 2011b. Obuchi, Y., Sakanoi, T., Asamura, K., Yamazaki, A., Kasaba, Y., Hirahara, M., Ebihara, Y., and Okano, S.: Fine-scale dynamics of black auroras obtained from simultaneous imaging and particle observations with the Reimei satellite, J. Geophys. Res., 116, A00K07, doi:10.1029/2010JA016321, 2011. Partamies, N., Syrj¨asuo, M., Donovan, E., Connors, M., Charrois, D., Knudsen, D., and Kryzanowsky, Z.: Observations of the auroral width spectrum at kilometre-scale size, Ann. Geophys., 28, 711–718, doi:10.5194/angeo-28-711-2010, 2010. Peticolas, L. M., Hallinan, T. J., Stenbaek-Nielsen, H. C., Bonnell, J. W., and Carlson, C. W.: A study of black aurora from aircraftbased optical observations and plasma measurements on FAST, J. Geophys. Res., 107, 1217, doi:10.1029/2001JA900157, 2002. Samara, M. and Michell, R. G.: Ground-based observations of diffuse auroral frequencies in the context of whistler mode chorus, J. Geophys. Res., 115, A00F18, doi:10.1029/2009JA014852, 2010. Samara, M., Michell, R. G., Asamura, K., Hirahara, M., Hampton, D. L., and Stenbaek-Nielsen, H. C.: Ground-based observations of diffuse auroral structures in conjunction with Reimei measurements, Ann. Geophys., 28, 873–881, doi:10.5194/angeo-28-873-
www.ann-geophys.net/30/1693/2012/
K. Axelsson et al.: Spatial characteristics of wave-like structures in diffuse aurora 2010, 2010. Sergienko, T., Sandahl, I., Gustavsson, B., Andersson, L., ˚ A study of fine structure of difBr¨andstr¨om, U., and Steen, A.: fuse aurora with ALIS-FAST measurements, Ann. Geophys., 26, 3185–3195, doi:10.5194/angeo-26-3185-2008, 2008. Stasiewicz, K. and Cheng, C. Z.: Modelling of mirror mode structures as propagating slow magnetosonic solitons, Ann. Geophys., 27, 4379–4389, doi:10.5194/angeo-27-4379-2009, 2009. Tsyganenko, N. A. and Sitnov, M. I.: Magnetospheric configurations from a high-resolution data-based magnetic field model, J. Geophys. Res., 112, A06225, doi:10.1029/2007JA012260, 2007.
www.ann-geophys.net/30/1693/2012/
1701
Vanham¨aki, H., Amm, O., and Viljanen, A.: 1-dimensional upward continuation of the ground magnetic field disturbance using spherical elementary current systems, Earth Planets Space, 55, 613–625, 2003. Zhang, T. L., Russell, C. T., Baumjohann, W., Jian, L. K., Balikhin, M. A., Cao, J. B., Wang, C., Blanco-Cano, X., Glassmeier, K.-H., Volwerk, M., Delva, M., and V¨or¨os, Z.: Characteristic size and shape of the mirror mode structures in the solar wind at 0.72 AU, Geophys. Res. Lett, 35, L10106, doi:10.1029/2008GL033793, 2008.
Ann. Geophys., 30, 1693–1701, 2012