Hindawi Publishing Corporation e Scientific World Journal Volume 2015, Article ID 531231, 10 pages http://dx.doi.org/10.1155/2015/531231
Research Article Spatial Dependence of Physical Attributes and Mechanical Properties of Ultisol in a Sugarcane Field Uilka Elisa Tavares,1 Mário Monteiro Rolim,1 Veronildo Souza de Oliveira,1 Elvira Maria Regis Pedrosa,1 Glécio Machado Siqueira,2 and Adriana Guedes Magalhães1 1
Departamento de Engenharia Agr´ıcola, Universidade Federal Rural de Pernambuco (UFRPE), Rua Dom Manoel de Medeiros, s/n, Dois Irm˜aos, 52171-900 Recife, PE, Brazil 2 Centro de Ciˆencias Agr´arias e Ambientais, Universidade Federal do Maranh˜ao, BR-222, KM 04, s/n, Boa Vista, 65500-000 Chapadinha, MA, Brazil Correspondence should be addressed to Gl´ecio Machado Siqueira;
[email protected] Received 1 February 2015; Revised 6 May 2015; Accepted 31 May 2015 Academic Editor: Jorge E. Gonzalez Copyright © 2015 Uilka Elisa Tavares et al. This is an open access article distributed under the Creative Commons Attribution License, which permits unrestricted use, distribution, and reproduction in any medium, provided the original work is properly cited. This study investigates the effect of conventional tillage and application of the monoculture of sugar cane on soil health. Variables like density, moisture, texture, consistency limits, and preconsolidation stress were taken as indicators of soil quality. The measurements were made at a 120 × 120 m field cropped with sugar cane under conventional tillage. The objective of this work was to characterize the soil and to study the spatial dependence of the physical and mechanical attributes. Then, undisturbed soil samples were collected to measure bulk density, moisture content and preconsolidation stress and disturbed soil samples for classification of soil texture, and consistency limits. The soil texture indicated that soil can be characterized as sandy clay soil and a sandy clay loam soil, and the consistency limits indicated that the soil presents an inorganic low plasticity clay. The preconsolidation tests tillage in soil moisture content around 19% should be avoided or should be chosen a management of soil with lighter vehicles in this moisture content, to avoid risk of compaction. Using geostatistical techniques mapping was possible to identify areas of greatest conservation soil and greater disturbance of the ground.
1. Introduction In the State of Pernambuco, Brazil, the sugarcane agroindustry occupies a large agricultural area, contributing to the significant production of sugar and alcohol and providing social value by generating direct jobs in rural and industrial areas [1]. According to Goldemberg et al. [2] and Gomes et al. [3], the coastal tablelands in the Northeast region in Brazil are exploited for agriculture and have significant economic value. In this region, some of the soil can be classified as cohesive owing to climatic factors and relief favoring the formation of this kind of horizon. The cohesive soils have a hard to very hard consistency when dry and are friable when moist [4]. They have high landscape spatial variability, which interferes directly with the production of cane sugar.
Conventional tillage can be defined as the revolving of topsoil to provide a favorable environment for the growth of crops and contribute to increased productivity and reduced costs through soil decompaction; incorporation of lime and fertilizer; increases in pore spaces, permeability, and the storage of air and water; and weed control [5–8]. Agricultural machinery and implements are used to maximize production and income but used indiscriminately can cause compaction and the deterioration of soil quality, fertility, and productive capacity over a long time [7, 9]. Increased soil compaction also increases the preconsolidation and decreases compression stress, causing adverse conditions, like decrease in soil permeability and macroporosity, for the growth of crops [10]. The continuous cultivation of sugar cane, for many years, can significantly increase microporosity, and the increase in the subsurface layers is
2
The Scientific World Journal Table 1: Physical characterization of Ultisol used for growing sugarcane by Beb´e et al., 2009 [1].
0.778 B 0.768
Bulk density (gcm−3 ) 1.47
A 0.758 C D
e 0.748
Sand (%) 58.77
Silt (%) 6.06
Clay (%) 35.15
FC (%) 18.8
PWP (%) 11.58
FC: field capacity; PWP: permanent wilting point.
0.738 0.728 E 0.718 10
100
410 kPa 1000
10000
𝜎p (kPa)
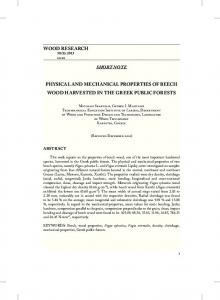
Figure 1: The Pacheco & Silva method to obtain the preconsolidation stress.
due to the intensive use of machinery promoting compression and pore clogging by clay illuviation [11]. When soils receive a load due to action for agricultural machinery and equipment, they undergo deformation and compaction whose intensities are related to their carrying capacity [6]. The laboratory test that can simulate the passage of the tractor on the ground is the compressibility test, and through it preconsolidation tension and compression ratio are obtained [6]. The preconsolidation tension (𝜎𝑝) expresses the maximum load that the soil has undergone throughout its history, indicating whether the ground has been under tension due to the passage of an agricultural vehicle or suffered an elastic deformation (recoverable) or plastic (nonrecoverable) [6]. The preconsolidation tension is obtained from the relationship between the logarithm of the vertical tension applied to soil and parameters related to the structure of the soil such as voids, porosity, or bulk density [6]. This relation plotted a curve that has two distinct regions: the first, where small elastic and reversible deformations occur, Identified in the curve of figure graph 1, it means that while the tractor present a load within this graph range, the traffic will not cause additional compression; other regions correspond to the straight virgin compression (highlighted by the line B of Figure 1) from which the tension applied to the soil leads to irreversible deformations. The value of preconsolidation tension separates these regions [6]. Studying the stress strain consolidation of soil is important because the agricultural production system has been enhanced through the use of increasingly powerful and heavy farm machinery [6]. Lamande et al. [13] found that subsoil compaction can persist for 30 years after a single pass of a combined heavy machinery tractor and trailer. Determining the spatial variability of physical attributes directly or indirectly related to the soil, such as density, moisture content, and soil texture, allows better control of crop production and environmental monitoring [4, 14]. Rabbi et al. [15] selected, through geostatistics techniques, soil quality index maps using a combination of physical attributes, such as bulk density, sand, silt, and clay, that can be used to
evaluate the spatial variability of soil physical quality in an agricultural field. The objectives of this work were to evaluate the spatial dependence structure of physical and mechanical attributes of soil and spatial correlation between these variables and to investigate the effect of soil wetting in their preconsolidation stress of the Ultisol at a depth of 0.0–0.20 m in a sugarcane field, giving direction to define a practical way of soil health maintenance.
2. Material and Methods 2.1. Study Area. The Ultisol (Table 1) was used for growing the sugarcane variety RB 92579, from Usina Santa Teresa in the Northern Forest region of Pernambuco, Brazil. The coordinates are 7∘ 33 38 south latitude and 35∘ 00 09 west longitude. The rainfall at the collection site was 1521.5 mm and the sugarcane was in its third harvest. The area received irrigation with vinasse, a residual substance left after sugarcane alcohol distillation, and soil tillage was conducted with Subsoilers and Disk Harrows implements. 2.2. Soil Sampling. The collections were made between May and November 2010 on days of lower rainfall. The cutting of sugarcane in the chosen area occurred in December 2010. Forty-nine soil samples were collected with disturbed soil to measure the contents of sand, silt, clay, consistency limits (liquid limit and plasticity index) and moisture content; and with undisturbed soil to measure bulk density and preconsolidation stress. The soil samples were collected in a square grid (20 m × 20 m by distance) composed of 7 rows and 7 columns at 0.00–0.20 m in depth. The total area was of 120 m × 120 m. 2.3. Soil Mechanics and Physical Analysis. The bulk density (BD) was obtained from undisturbed soil samples collected with the aid of Uhland sampler and a volumetric ring 0.05 m high and 0.02 m in diameter, according to the methodology of EMBRAPA [16]. In order to represent the BD in depth of 0.00 to 0.20 m, soil samples were collected with the Uhland sampler depths between 7.5 and 12.5 cm, which corresponds to the central point of the profile. The gravimetric moisture content (𝜃) was obtained as the relation between the mass of water in the soil and the dry mass of soil [16]. The texture was determined by a Bouyoucos densitometer with a dispersion of 50 g of air-dried soil in 25 mL of sodium hexametaphosphate buffered with sodium carbonate. The sand was separated by sieving, the clay by sedimentation, and the silt by subtracting the first two values from the total [16].
The Scientific World Journal
3
The liquid limit (LL) and plastic limit (PL) were determined according to ABNT [17] and ABNT [18], respectively, and the plasticity index (PI) was obtained from their difference. Soil compressibility was evaluated in samples with a preserved structure collected in metal rings 0.025 m high and 0.065 m in diameter from a depth of 0.00–0.20 m, according to NBR 12007/90 [19]. A spatula was used to remove excess soil from the upper and lower surface of the ring filled with the soil. The whole mass of soil over the ring odometer was saturated by capillarity for 24 h and then subjected to pressures corresponding to the water content corresponding to field capacity (CC) and the permanent wilting point (PWP) observed by Beb´e et al. [1] for the Ultisol in the experimental area: 0.1 and 0.19 kgkg−1 , respectively. During the test, loads were applied at 12.5, 25, 50, 100, 200, 400, 800, and 1600 kPa, with adaptations for unsaturated soil, with a 30 sec duration of load application. Some authors studied and discussed the compressive behavior soil, applying compressive stress for different loading times, that is, 0.5 sec or 2 min, to resemble the short application of load that occurs in the field [20, 21]. Salire et al. [22] used a loading time of 2 min for each stress. The software Compress 1.0 was used for the construction of curves determining the compressibility and tension for preconsolidation (𝜎𝑝). This parameter is defined in the void ratio (𝑒) and log tension (𝜎) graph. The Pacheco & Silva method was used to determine the preconsolidation tension [19]. This method considers the meeting point of the horizontal line A with line B (also known as virgin compression line) and arrows C, D, and E are the steps needed to define the preconsolidation tension value (Figure 1). 2.4. Statistical and Geostatistical Analyses. The variables were analyzed using the descriptive statistics of the mean, median, coefficient of variation, minimum and maximum values, skewness, kurtosis, and verification of data normality using an error probability of 5% by the Kolmogorov-Smirnov test. The Pearson correlation between variables was calculated in spreadsheet. The procedure described by Cahn et al. [23] was used to determine the presence of outliers, which in most cases are indicative of errors in reading the values of the variables [24]. The coefficient of variation (CV) of the attributes was rated following Warrick and Nielsen [25], which consider low variability as a CV of 60%. The spatial dependence was evaluated by setting the semivariogram based on the assumption of stationarity intrinsically estimated by
𝛾̂ (ℎ) =
𝑁(ℎ)
1 2 × ∑ [𝑍 (𝑥𝑖 + ℎ) − 𝑍 (𝑥𝑖 )] , 2𝑁 (ℎ) 𝑖=1
(1)
where 𝛾̂(ℎ) is the estimated experimental value and 𝑁(ℎ) is the semivariance number of pairs of measured values 𝑍(𝑥𝑖 ), 𝑍(𝑥𝑖 + ℎ), separated by a vector ℎ.
The software Geoeas [26] was used to generate the semivariogram and choose the best-fit model (exponential, Gaussian, or spherical), as follows. (i) Exponential model is as follows: 𝛾̂ (ℎ) = 𝐶0 + 𝐶1 [1.5 ×
ℎ ℎ 3 . − 0.5 ( ) ] 𝐴 𝐴 0