ECOLOGY
Spatial dynamics of understorey insectivorous birds and arthropods in a southeastern Brazilian Atlantic woodlot Manhães, MA.a,c* and Dias, MM.b Programa de Pós-graduação em Ecologia e Recursos Naturais, Universidade Federal de São Carlos – UFSCar, Rod. Washington Luís, Km 235, CEP 13565-905, São Carlos, SP, Brazil
a
b
Departamento de Ecologia e Biologia Evolutiva, Universidade Federal de São Carlos – UFSCar, Rod. Washington Luís, Km 235, CEP 13565-905, São Carlos, SP, Brazil Instituto de Ciências Biológicas, Universidade Federal de Juiz de Fora – UFJF, CEP 36036-900, Juiz de Fora, MG, Brazil
c
*e-mail:
[email protected] Received February 1, 2010 – Accepted June 11, 2010 – Distributed February 28, 2011 (With 4 figures)
Abstract Spatial distribution and spatial relationships in capture rates of understorey insectivorous birds and density of arthropods were investigated in a patch of upper montane rain forest in Minas Gerais state, southeastern Brazil, from January to December 2004. The composition of the arthropod fauna collected was similar to that reported for other tropical forests, with predominance of Araneae, Coleoptera, Hymenoptera and Hemiptera non-Heteroptera. A total of 26 bird species were captured, among which the more common were Dysithamnus mentalis, Conopophaga lineata, Platyrinchus mystaceus, Basileuterus culicivorus and Sclerurus scansor. Variation in the bird capture rates among sampling net lines were not correlated with arthropod density. Rather, individual analyses of some bird species suggest that spatial distribution of understorey insectivorous birds is better explained by habitat type. Keywords: neotropical birds, rain forest, spatial relationships, trophic ecology.
Dinâmica espacial de aves insetívoras de sub-bosque e artrópodes em um fragmento de Mata Atlântica no sudeste brasileiro Resumo De janeiro a dezembro de 2004, distribuições espaciais e correlações entre taxas de capturas de aves insetívoras de sub-bosque e densidade de artrópodes foram investigadas em uma mancha de floresta ombrófila altomontana no Estado de Minas Gerais, sudeste do Brasil. A composição da fauna de artrópodes coletados no ambiente foi semelhante às registradas em outras florestas tropicais, com predomínio de Araneae, Coleoptera, Hymenoptera e Hemiptera não Heteroptera. Foram capturadas 26 espécies de aves, com maior representatividade para Dysithamnus mentalis, Conopophaga lineata, Platyrinchus mystaceus, Basileuterus culicivorus e Sclerurus scansor. As taxas de captura das aves entre pontos de amostragens não esteve correlacionada com a densidade de artrópodes, e análises de algumas espécies individualmente sugerem que a distribuição espacial dos insetívoros de sub-bosque é mais bem explicada pelo tipo de hábitat. Palavras-chave: aves neotropicais, floresta ombrófila, distribuição espacial, ecologia trófica.
1. Introduction In tropical forest areas, communities of understorey birds tend to be dominated by insectivorous birds (Greenberg, 1981) which are very dependent on forest environments and rarely move between forest patches in fragmented areas (Stouffer and Bierregaard, 1995). Although such movements have been recorded for some species, these birds tend to restrict their activities to the limits of the fragments (Marini, 2000; Yabe and Marques, 2001). This has led to Braz. J. Biol., 2011, vol. 71, no. 1, p. 1-7
the disappearance of understorey insectivorous species, either as the result of human impacts (Canaday, 1996) or by an increase in the degree of isolation of fragmented areas (Aleixo and Vielliard, 1995; Sekercioglu et al., 2002). If food is a limiting resource for bird species in such forest patches (Newton, 1980), the composition and diversity of the understorey bird fauna of a locality should vary in response to fluctuations in the supply of 1
Manhães, MA. and Dias, MM.
this resource. Considering different guilds, Martin and Karr (1986), Wong (1986) and Poulin et al. (1994) noted that insectivorous birds had greater spatial stability and are more site-attached than frugivorous ones, but this does not mean that fluctuations do not occur, since forest insectivorous birds may have spatial distribution related to availability of arthropods. These spatial relationships are due to structural heterogeneity of the environment (Blake and Hoppes, 1986; Naranjo and Ulloa, 1997) influencing bird behaviour and distribution of prey (Robinson and Holmes, 1982; Smith et al., 1998) and, consequently, spatial distribution of insectivorous birds. In Brazil, these ecological approaches have received very little attention, despite the importance investigations into animal population response to food availability should receive in conservation programmes. This is particularly true in Atlantic Forest areas, a biome that has been reduced to less than ten percent of its original coverage (Tonhasca, 2005). In this work, our objective was to investigate the relationships between capture rates of understorey insectivorous birds and spatial distribution of arthropod density in an area of Atlantic rain forest.
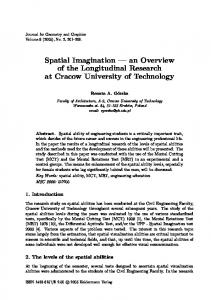
2. Material and Methods 2.1. Study area The sampled area is a patch of upper montane rain forest located at the Ibitipoca State Park (1,488 ha; 21o 42’ S and 43o 53’ W), state of Minas Gerais, Lima Duarte municipality southeastern Brazil. It is an area of Atlantic rain forest with approximately 90 ha (Oliveira‑Filho and Fontes, 2000), known locally as “Mata Grande”. The forest altitude is around 1,400 m a. s. l. The climate is characterised by an annual mean temperature of 18.9 °C (Aragona and Setz, 2001) and annual mean rainfall of 1,544 mm (Carvalho et al., 2000). In 2004 rainfall was markedly seasonal and the dry season was from May to October and the remaining period was the rainy season. October was considered as dry season due to the rainfall of 66.6 mm, almost half of the historical mean of 121.8 mm (Manhães, 2003a) (Figure 1). 2.2. Bird samplings The field work was carried out from January to December 2004 in monthly periods of seven to eight days. Due to the intensive rainfall in February and logistic problems related to the Park’s facilities in April, those months were not sampled. We performed captures of birds with mist nets (12 x 3 m, 38 mm mesh) in five net lines plotted in pre-existing trails used only by researchers and the Park staff. Samples were taken at one net line each day and sequentially from one to five. This procedure was repeated monthly. The distance between the end of a net line and the beginning of another ranged from 84 m to 818 m. At each net line, nine nets installed at the ground level were kept open for about seven hours, beginning between 6:00 and 6:30 AM. The nets were monitored at 60 minutes intervals, and the captured birds were marked with numbered metal 2
Figure 1. Rainfall and temperature at Ibitipoca State Park: historic mean (only rainfall) and data from 2004.
rings and released near the sampled net line. At the end of the study we had 3,178 net-hours. Daily sampling effort varied between 51.75 to 68.5 net‑hours and correction of the sampling effort to 50 net-hours allowed spatial analysis with the same capture effort. Individuals recaptured in the same month were included in spatial variability analyses when the recaptures occurred at different net lines. We classified birds as insectivorous if a collection of five or more fecal samples, collected after the birds were held in cloth bags, contained over 90% of these samples only with arthropods. Species with less than five samples were included in the analyses based on literature data (Willis, 1979; D’Angelo Neto et al., 1998). Hummingbirds were treated as mainly nectarivores and were excluded from the analyses. The nomenclature followed Remsen et al. (2008). 2.3. Arthropod samplings We used the branch clipping method, which consists of clipping the branches of trees or bushes involved by collecting bags (Cooper and Whitmore, 1990). Samplings were carried out in random schedules throughout the day, alternating between the left and right sides of the net lines each month. Vegetation close to the ground and branches up to 2 m were bagged (0.6 x 0.8 m plastic bags) at a distance not higher than 5 m perpendicularly to each net. Thus, nine collections were done at each net line totalling 45 monthly samples. The vegetation was vigorously shaken inside the bags to displace the captured arthropods and discarded. The residual vegetation was deposited over a cloth screen and carefully surveyed. Arthropods were collected with forceps, and kept dry in a freezer. Finally, we inspected the bags in order to find arthropods possibly adhered on the internal surface. Since the volume of the vegetation collected was variable, the number of arthropods was corrected to 100 g, after obtaining the difference between the weight of the bag with vegetation and the empty bag. Braz. J. Biol., 2011, vol. 71, no. 1, p. 1-7
Spatial dynamics of insectivorous birds and arthropods
For spatial variability, this value was multiplied by the mean of the vegetation density at each net line. The density was obtained counting the number of vegetation touches on a pole (Willson and Comet, 1996) (PVC pole, 1.9 cm diameter and 3 m high). The pole was vertically supported on the soil at a distance of 3 m perpendicularly to one net, with a 3 m distance between each measurement. With this procedure, four measurements were obtained at each side of a net, eight per net and 72 per net line. Additionally, the density of bamboo thickets, the main differential characteristic of the vegetation between net lines, was compared to the remaining vegetation. The arthropods were classified down to the lowest possible taxonomic level, in general Order, although in some cases the identified items did not correspond to stricto sensu taxonomic units, such as insect larvae and cocoons. To reduce the possible inconsistency between density of preys and its availability for birds, only arthropods with 1.5 to 20 mm in length were counted. Studies in Panama suggest that small forest birds consumed preys mainly in this size range (Karr, 1976; Karr and Brawn, 1990; Poulin and Lefebvre, 1996). 2.4. Analyses From monthly values of capture rates and arthropod density we clustered the net lines through Cluster analysis using average Euclidean distance and UPGMA. To verify spatial correspondence between these variables, we correlated the two distance matrices obtained applying the Mantel test. Analyses based on capture rates were restricted to the general tendencies of the insectivores as a whole, due to the reduced number of samples for most species. However, we tested the differences in the number of captures per net line of the most numerous species with the G test. In this case, the values were not corrected for capture rates since the greatest difference of the sampling effort between two net lines was 1.5 net-hour, for a total accumulated greater than 600 net-hours at each net line. Analysis of Variance (ANOVA) was applied to verify differences in vegetation density among net lines.
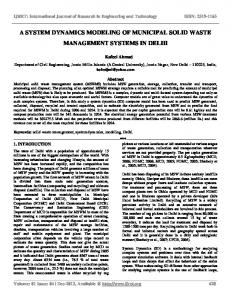
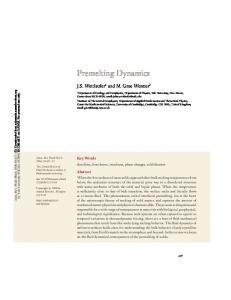
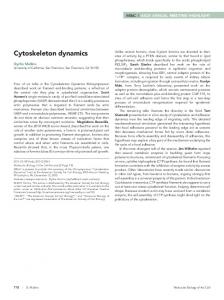
3. Results We collected 4,466 arthropods, being Araneae and Coleoptera the most abundant groups with 2,034 and 675 specimens respectively, reaching 60.7 percent of the total. Although the branch clipping method may underestimate arthropod groups that run away fast at minimum vegetation disturbance (Cooper and Whitmore, 1990), such insects can be considered well sampled, specially Hymenoptera, Diptera, Orthoptera and some Hemiptera non-Heteroptera, that summed up to 955 specimens (21.4%) (Figure 2). Spatially, the dendrogram revealed a consistent clustering (cophenetic correlation coefficient = 0.93) distinguishing the net line one from the others (Figure 3). We obtained 364 captures of 230 individuals belonging to 26 bird species, and the number of captures varied from one (five species) to 59 (Dysithamnus mentalis (Temminck)). Braz. J. Biol., 2011, vol. 71, no. 1, p. 1-7
Figure 2. Monthly mean of arthropod/100 g of vegetation (± standard error) collected at Mata Grande, Ibitipoca State Park, Brazil. Numbers in parenthesis represent the number of specimens collected. *Others: Mollusca (non-arthropod), Isopoda, Collembola, Mantodea, Phasmida, Blattariae, Isoptera, Plecoptera, Dermaptera, Embioptera, Thysanoptera, Neuroptera, Trichoptera, Lepidoptera, Acari, Opiliones, Chilopoda, Diplopoda, cocoons.
The most common species were D. mentalis (25.7% of the captured individuals), Conopophaga lineata (Wied) (14.3%), Platyrinchus mystaceus Vieillot (10%), Basileuterus culicivorus (Deppe) (7.8%) and Sclerurus scansor (Ménétriès) (6.1%) (Table 1). We captured 18 species in September but only nine in December. However, the most numerous species occurred regularly throughout the year. The distribution of captures in the net lines was homogeneous in the cases of D. mentalis (G = 2.04, d.f. = 4, p = 0.74) and C. lineata (G =3.01, d.f. = 4, p = 0.57). Conversely, other species were recorded at specific net lines, such as Drymophila ochropyga (Hellmayr), with 80 percent of the captures at net line one (G = 25.07, d.f. = 1, p