The Plant Cell, Vol. 24: 622–636, February 2012, www.plantcell.org ã 2012 American Society of Plant Biologists. All rights reserved.
Spatial Mapping of Lipids at Cellular Resolution in Embryos of Cotton W OA
Patrick J. Horn,a Andrew R. Korte,b Purnima B. Neogi,a Ebony Love,a Johannes Fuchs,c Kerstin Strupat,d Ljudmilla Borisjuk,c Vladimir Shulaev,a Young-Jin Lee,b and Kent D. Chapmana,1 a Department
of Biological Sciences, Center for Plant Lipid Research, University of North Texas, Denton, Texas 76203 of Chemistry, Iowa State University and Ames Laboratory–U.S. Department of Energy, Ames, Iowa 50011 c Leibniz Institute of Plant Genetics and Crop Research, D-06466 Gatersleben, Germany d Thermo Fisher Scientific, 28199 Bremen, Germany b Department
Advances in mass spectrometry (MS) have made comprehensive lipidomics analysis of complex tissues relatively commonplace. These compositional analyses, although able to resolve hundreds of molecular species of lipids in single extracts, lose the original cellular context from which these lipids are derived. Recently, high-resolution MS of individual lipid droplets from seed tissues indicated organelle-to-organelle variation in lipid composition, suggesting that heterogeneity of lipid distributions at the cellular level may be prevalent. Here, we employed matrix-assisted laser desorption/ ionization–MS imaging (MALDI-MSI) approaches to visualize lipid species directly in seed tissues of upland cotton (Gossypium hirsutum). MS imaging of cryosections of mature cotton embryos revealed a distinct, heterogeneous distribution of molecular species of triacylglycerols and phosphatidylcholines, the major storage and membrane lipid classes in cotton embryos. Other lipids were imaged, including phosphatidylethanolamines, phosphatidic acids, sterols, and gossypol, indicating the broad range of metabolites and applications for this chemical visualization approach. We conclude that comprehensive lipidomics images generated by MALDI-MSI report accurate, relative amounts of lipid species in plant tissues and reveal previously unseen differences in spatial distributions providing for a new level of understanding in cellular biochemistry.
INTRODUCTION Technical advances in mass spectrometry (MS) over the past decade have produced a wealth of information on the abundance and identification of metabolites (lipids, carbohydrates, etc.) and proteins in a manner analogous to the implementation of sequencing and microarray tools for genetic applications. This has led to development of new “-omics” techniques (e.g., metabolomics, proteomics, lipidomics, etc.) that focus on analyzing complex chemical compositional data for biological interpretation (Schmelzer et al., 2007; Welti et al., 2007). Until recently, conventional methods for analyzing metabolites by MS involved time-consuming, chemical-based tissue extractions followed by physical/chemical purification (e.g., liquid chromatography) and infusion of samples into the MS (Han and Gross, 2005). While this approach has been valuable for compound identification and quantification, this methodology is limited in its ability to distinguish where these molecules were localized in situ. On the other hand, optical imaging techniques, such as confocal or electron microscopy using selected fluores1 Address
correspondence to
[email protected]. The author responsible for distribution of materials integral to the findings presented in this article in accordance with the policy described in the Instructions for Authors (www.plantcell.org) is: Kent D. Chapman (
[email protected]). W Online version contains Web-only data. OA Open Access articles can be viewed online without a subscription. www.plantcell.org/cgi/doi/10.1105/tpc.111.094581
cent dyes, antibodies, and chemical modifications, can hint at cellular localization (Eggeling et al., 2009; Wessels et al., 2010) but currently cannot derive comprehensive compositional information within these images alone. The development of MS imaging (MSI) allows the capability to capture the chemical composition within the spatial context of biological tissues (Cornett et al., 2007; Lee et al., 2012). One type of MSI that offers ease of sample preparation, soft ionization, and MS-based analysis of cellular metabolites is matrix-assisted laser desorption/ionization–MS (MALDI-MS). Improvements in the spatial resolution of MALDI-MSI have progressed from resolutions >200 mm down to submicron levels in some applications (Koestler et al., 2008), with 10 to 50 mm the most commonly achievable spatial resolution at this time. New generations of mass spectrometers capable of extremely high mass resolution and accuracy (Hu et al., 2005; Schaub et al., 2008) make metabolite identification possible at the tissue and cellular levels. Lipid analysis is particularly amenable to MALDI-MSI. Most of the applications of MALDI-MSI analysis in situ (Murphy et al., 2009; Fuchs et al., 2010) have centered on membrane lipids in mammalian tissues, such as kidney (Murphy et al., 2009), lung (Berry et al., 2011), brain slices in mice (Chen et al., 2008), and whole body imaging (Chaurand et al., 2011). These studies were directed toward spatial analysis of lipid metabolites and have improved our understanding of diseases and genetic mutations. Phospholipids and triacylglycerols (TAGs) imaged in kidney
Lipid Imaging in Cottonseed Embryos
slices show complex molecular distribution profiles that likely result from tightly regulated lipid metabolism (Murphy et al., 2009). Furthermore, a recent article detailing an abundance of phospholipids with polyunsaturated fatty acids (FAs) in the airways of lung tissue by MALDI-MSI demonstrated how spatial organization improves our understanding of how these lipids might be involved in inflammatory responses (Berry et al., 2011). Elsewhere, molecular species of gangliosides in brain slices demonstrated the utility of MALDI-MSI as a histological tool for analyzing models of Tay-Sachs and Sandhoff disease (Chen et al., 2008). Few examples of MALDI-MSI in situ analysis of plant lipids are available, although several other types of metabolites have been profiled (for a recent review, see Kaspar et al., 2011; Lee et al., 2012). Several studies have adapted MALDI time-of-flight MS to analyze plant lipid extracts, including TAGs from fruit of olives (Olea europaea) and pomegranate (Punica granatum) seeds (Wiesman and Chapagain, 2009), phosphatidylcholines (PCs) from soybean (Glycine max; Zabrouskov et al., 2001), and lipidsoluble pigments (Cai et al., 2006; Suzuki et al., 2009) and galactolipids in plant-like green alga (Vieler et al., 2007). In plant tissues, surface lipids have been mapped in situ on Arabidopsis thaliana floral and leaf tissues by MALDI-MSI (Cha et al., 2008; Jun et al., 2010; Vrkoslav et al., 2010). Free FAs were profiled from apple (Malus domestica) core and strawberry (Fragaria spp) seeds using colloidal graphite as the matrix (Zhang et al., 2007). More recently, imaging MS has been applied to rice grain (Oryza sativa) for the analysis of individual PC species (Zaima et al., 2010). Elucidating the spatial distribution of lipid metabolites within plant tissues provides a new perspective to metabolism. This will aid in understanding metabolic compartmentation within plant tissues, help to predict enzyme localization, and provide insights into lipid signaling pathways (Burrell et al., 2007). Here, we present results of MALDI-MSI approaches to study the distribution of lipids in cotton (Gossypium hirsutum) seeds. Cotton is a typical oilseed, storing lipids and proteins in cytosolic organelles of mature seed tissues. In cottonseeds, the amount of stored lipid is ;20% of the seed dry weight (Horn et al., 2011b), making refined cottonseed oil a valuable coproduct of fiber production. However, the antinutritional secondary metabolite, gossypol, must be removed from seed oil extracts through the refining process, and gossypol residues in the protein meal limit its use as a high-value animal feed (Jones and King, 1996). Successful efforts to reduce gossypol levels through genetic engineering approaches are likely to support more widespread use of cottonseed products globally (Sunilkumar et al., 2006). Cottonseed oil is extracted and refined for food applications, and it is composed almost exclusively of TAGs containing linoleic (L; 18:2 at 55 mol %), palmitic (P; 16:0 at 26 mol %), oleic (O; 18:1 at 15 mol %), and stearic (S; 18:0 at 2 mol %) acids (Jones and King, 1996). Several cyclic FAs also are found in TAGs in cottonseeds in minor quantities, including sterculic (Sc; 19:1), dihydrosterculic (Dsc; 19:0), and malvalic acids (Schmid and Patterson, 1988; Obert et al., 2007). Together, these TAG storage molecules are packaged within the seed tissues into lipid droplets surrounded by a single monolayer of polar lipids (e.g., PC). While the abundance and composition of the lipid molecules in cottonseeds are well defined from chemical extracts (Lı´sa and Holcapek, 2008; Horn et al., 2011a), there is little information
623
available about their overall cellular distribution and heterogeneity. Recently, high-resolution MS of individual lipid droplets isolated from cottonseed tissues indicated a marked difference in organelle-to-organelle lipid compositions (Horn et al., 2011a), suggesting that heterogeneity of lipid distributions at the cellular and tissue levels may be prevalent. Our overall objective is to map the chemical distribution of the major and minor storage and membrane lipids throughout the mature cotton embryo tissues and assess the potential heterogeneity of distribution of these molecules by MALDI-MSI. These studies will form the basis for improved spatial understanding of the biosynthetic pathways leading to TAGs in cotton embryos and may suggest potential tissue-specific considerations for the metabolic engineering of oilseeds in general. Further, this approach provides a new tool for the prediction and analysis of lipid metabolism and function in plant tissues more broadly.
RESULTS General Distribution of Selected Lipid Classes in Cotton Embryos The reasonably large seed size and the recent MS information on lipid droplet variation (Horn et al., 2011a) made cottonseed a good candidate for analyzing lipid heterogeneity by MALDI-MSI (Figure 1). Total ion intensity profiles were imaged in mature embryos for major storage (TAG) and membrane (PC) lipid classes and compared with summed ion counts for phosphatidylethanolamine (PE), phosphatidic acid (PA), b-sitosterol, and the cotton-specific polyphenolic gossypol (Figure 2). Cross and longitudinal sections were prepared from representative areas of mature cotton embryos (Figure 1), and a raster step size of 50 mm with a laser spot size of ;35 mm was used to sample each section, a resolution about the size of mature cotyledon cells (Chapman et al., 2008). MALDI-MSI profiles (Figure 1D) showed multiple adducts for lipid species (primarily H+, Na+, and K+), some substantial ion suppression of TAGs by PC (Emerson et al., 2010), and evidence of diacylglycerol fragments produced by laser-induced compound fragmentation of PC and TAG (Gidden et al., 2007). The molecular species within each lipid class were identified using predefined databases from conventional electrospray ionization–MS (ESI-MS) profiles as well as accurate mass-tocharge ratio (m/z) searches for unique or less prevalent compounds and summed to show distributions for the total classes. The total ion counts (TICs) for total TAG, PA, and PE were distributed relatively heterogeneously throughout cross and longitudinal sections of embryos (Figures 2B, 2D, and 2E), whereas the total PC ions were more uniformly distributed throughout the cotyledonary tissues, although relatively less abundant within the embryonic axis region of the embryos (Figure 2C). The predominant free sterol in cottonseed tissues, b-sitosterol (Verleyen et al., 2002) (Figure 2F, m/z 397.383 [M – H2O + H]+), was localized mostly to the embryonic axis. Due to ion suppression of TAG (and other lipids) by PC, there appeared to be relatively more masking of TAG in the cotyledonary tissues, even though there is generally more oil in the cotyledon tissues than in the embryonic axis (Figure 3). This apparent shortcoming of MSI is
624
The Plant Cell
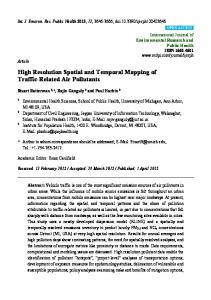
Figure 1. Schematic Overview of Cottonseed Anatomy and the MALDI-MSI Process. (A) Longitudinal diagram of a mature cotton embryo primarily composed of folded cotyledon tissues surrounding the embryonic axis (hypocotyl and radicle). Pigment glands containing the terpenoid gossypol are present throughout the tissue. (B) Intact embryos are chemically fixed and sliced into thin cross or longitudinal sections with a cryostat. Sections of ;30 mm are adhered to a glass slide and coated with matrix, 2,5-dihydroxybenzoic acid (DHB). (C) A laser beam is rastered across the section in a serpentine pattern ionizing the seed lipid/matrix mixture at an imaging resolution of 50 mm. Generated lipid ions as [M + H]+, [M + Na]+, or [M + K]+ adducts are directed into a mass analyzer for the mass spectral data acquisition. (D) Each laser shot and detection cycle generates a raw data spectrum for each x, y position of the seed section. A sample spectrum shows the identification of the matrix (DHB identified as [2DHB 2H2O + H]+ at m/z 273.04) and three distinct compound regions, phospholipids, and in particular PC (red region), TAGs (green region), and diacylglycerols (blue region) from in-source fragmentation of TAG and PC species. Representative species and adducts are labeled with their total acyl composition. For a more comprehensive list of species and adducts identified, see Supplemental Tables 1 to 4 online.
overcome easily by examining mol % distributions within lipid classes (below), but it is important to be cautious not to interpret absolute ion counts as quantitative when comparing lipids across classes. However, relative quantification within lipid classes by MALDI-MSI was remarkably consistent when compared with other methods (see below). Supplemental Figure 1 online shows an example of a raw MS data set and its conversion to a set of MS images for distribution analysis. The terpenoid gossypol (Figure 2G) is found in the small pigment glands of cottonseed (Adams et al., 1960) and is synthesized for insect and pathogen defense (Hedin et al., 1992; Stipanovic et al., 1999). Gossypol (m/z 501.191) was easily identified in cottonseed sections as a minus-water, protonated species [M – H2O + H]+ and was localized in discrete circular regions in the sections corresponding to the locations of the
pigmented glands. This emphasizes the value of MSI to combine visual structural features with direct chemical information and demonstrates its utility to the localization of plant secondary metabolites. To compare the distribution of total TAG in embryos by a nondestructive means, intact cottonseeds were subjected to magnetic resonance imaging by 1H-NMR (Neuberger et al., 2008). Based on NMR imaging of intact seeds (Figure 3; see Supplemental Movie 1 online), there were localized areas enriched in TAG with clear evidence of heterogeneity of total lipid content. There appeared to be regions within cotyledons and within the axis concentrated with more TAG, and not just a uniform, consistent distribution of storage lipid throughout the seed as might be expected. This heterogeneity could be a result of differences in localized enzyme activities or tissue maturity
Lipid Imaging in Cottonseed Embryos
Figure 2. Distribution of Absolute TICs/Intensities of Cottonseed Metabolites. (A) Optical cross (left) and longitudinal (right) sections prepared from the middle segment of the seed. Bars = 1 mm for all images. (B) Distribution of total TAG ions (sum of ions listed in Supplemental Table 1 online) normalized to the TIC on each pixel (max = 0.1 for both cross and longitudinal sections). (C) Distribution of total PC ions (sum of ions listed in Supplemental Table 2 online) normalized to TIC on each pixel (max = 0.3). (D) Distribution of total PA ions (sum of ions listed in Supplemental Table 4 online) normalized to TIC on each pixel (max = 0.03). (E) Distribution of PE ions (sum of ions listed in Supplemental Table 3 online) normalized to TIC on each pixel (max = 0.01). (F) Distribution of b-sitosterol ion (m/z 397.383) normalized to TIC on each pixel (max = 0.003). (G) Distribution of gossypol (m/z 501.191) normalized to TIC on each pixel (max = 0.01).
625
Three distinct distribution patterns were identified within the TAG lipid class when comparing the molecular species distributions in cotton embryos. The two most abundant TAGs, PLL (m/z 877.726, Figure 4B) and LLL (m/z 901.726, Figure 4D), showed marked differences in location with less occurrence in the inner embryonic axis region relative to the outer cotyledon region. TAGs with two 16:0 acyl chains (e.g., PPL; m/z 853.725, Figure 4A) or one 16:0 and one 18:1 acyl chain (e.g., PLO; m/z 879.742, Figure 4C) were found to have a greater relative occurrence within the embryonic axis relative to cotyledonary tissues. A third distribution pattern that was relatively uniform throughout the entire embryo was evident for some TAGs, including LLO (m/z 903.742, Figure 4E). A more comprehensive list of TAGs identified is available in Supplemental Table 1 online. Several cyclic FAs are found in cottonseeds in minor quantities, including sterculic, dihydrosterculic, and malvalic acids (Schmid and Patterson, 1988; Obert et al., 2007). Sterculic and dihydrosterculic acids are readily identifiable in odd chain TAGs. TAGs containing at least one 19C cyclic FA were exclusively localized in the embryonic axis of cotton embryos (Figure 5) and not detected in the outer cotyledonary regions representing a TAG distribution pattern distinctly different from TAGs without a cyclic FA. The minimum scale shown in Figure 4 is at least 20 times higher than the instrument detection limit, and if there is any TAG with a cyclic FA present in cotyledon, its abundance should be at least 20 times lower than that in embryonic axis. Gas
differences, but it suggests a nonuniform distribution of TAG in cotton embryos as observed by MALDI-MSI. Heterogeneous Distribution of Individual TAG Molecular Species The most illuminating information obtained by MALDI-MSI of lipids came from examining the percentages of molecular species within classes. NMR-based imaging points to localized differences in seed lipid reserve accumulation within embryos, but it does not provide information about specific molecular composition. MALDI-MSI revealed the spatial organization of individual TAG molecular species (Figure 4) on the basis of mol % of total TAG. Individual TAG molecular species were identified as both Na+ and K+ adducts in MALDI-MSI full scans from a database of their theoretical monoisotopic masses established from literature sources (Yunusova et al., 1982; Lı´sa and Holcapek, 2008; Horn et al., 2011a) and by comparison to ESI-MS data (see below).
Figure 3. Distribution of Total Seed Lipid Content by NMR. (A) Longitudinal representation of total seed lipids within an intact embryo. See Supplemental Movie 1 online for complete profiling of intact embryo. (B) to (D) Representative cross-section profiles through the chalazal (B), middle (C), and micropylar (D) sections of the intact embryo.
626
The Plant Cell
Figure 4. Distribution of Selected TAG Molecular Species. Distribution of selected TAG molecular species in mol %. Ion counts within 6 0.02 m/z units of each sodiated [M + Na]+ (labeled on figure) and potassiated [M + K]+ monoisotopic masses are normalized to the total TAG ion signals on each pixel. A red-green linear color scale is used with maximum mol % value corresponding to 35% of total TAG for all images. See Supplemental Table 1 online for all TAG species identified and m/z analysis for each species. Bar = 1 mm.
chromatography (GC)–MS analysis demonstrated the enrichment of cyclic FAs in the embryo axis and their near absence from the cotyledons (see Supplemental Figure 2 online). The most abundant species of these cyclic TAGs (LScP, LDscP/ OScP, and ODscP) all contained one palmitic acid, one 18 carbon unsaturated FA (oleic or linoleic), and one sterculic or dihydrosterculic FA (Figures 5A to 5C). One of the less abundant cyclic TAGs contained two linoleic FAs and either sterculic or dihydrosterulic (Figure 5D). Malvalic acid is present in cottonseeds but has the same chemical formula and is not distinguishable from oleic acid by MS in full scan mode. Malvalic acid can be distinguished in derivatized FA profiles by GC-MS (Bao et al., 2002), but we were unable to obtain any information on TAGs with malvalic acid by MALDI-MSI here. TAG molecular species were identified, and profiles were compared across analytical platforms at distinct tissue resolutions (Figures 6A and 6B): total lipid extracts (TLEs) from intact seeds, MALDI-MSI of seed sections, and direct organelle MS (DOMS) of purified cottonseed lipid droplets (Horn et al., 2011a). TLE and DOMS included quantitative standards and provided a reference basis for absolute quantification of TAG molecular species. TAG molecular species profiles were relatively similar across the different analytical platforms (Figures 6A and 6B), demonstrating the validity and utility of visualizing the lipid composition through MALDI-MSI. The cross and longitudinal sections revealed almost identical compositional profiles to each other, averaged from 20,000+ MS scans over entire embryo sections, and these were in good agreement with ESI-MS analyses.
The cyclic TAGs were more readily detectable in the longitudinal sections, but based on the optical images, it appears a slightly oblique cut was made that could lead to a larger portion of the embryonic axis being profiled. By comparison, cyclic TAGs appeared to be overestimated in direct-infusion ESI-MS of extracts. We suspect that this was due to the inability to resolve their m/z peaks with overlapping TAG species that appear as oxidized m/z artifacts. This overestimation of cyclic TAG in ESIMS was evident following conventional total FA analysis of seed lipid extracts by GC-MS (Figure 6C; see Supplemental Figure 2 online), which were consistent with values from the literature (Schmid and Patterson, 1988; Obert et al., 2007). Hence, because of the high resolution of the Orbitrap-MS, analyses by MALDI-MSI were able to resolve these oxidized species and exclude them from relative quantification calculations, making MALDI-MSI a better representation of cyclic TAG content in embryos than ESI-MS approaches in this case and emphasizing the importance of comparing multiple methods to verify lipidomics results. Stereospecific designations (i.e., sn-position of each FA) were not determined in our analyses but have been shown to be possible in ESI-MS/MS of TLEs (Han and Gross, 2001). The MALDI-MSI instrument used in this study has MS/MS capability, and we have previously shown structural isomers can be distinguished in MALDI-MS/MS imaging (Perdian and Lee, 2010). Here, however, molecular species were distinguished only by overall acyl composition (numbers of acyl carbons and numbers of double bonds).
Figure 5. Distribution of TAG Molecular Species Containing Sterculic and/or Dihydrosterculic (Cyclic) Fatty Acids. Distribution of selected cyclic TAG molecular species in mol %. Ion counts within 6 0.02 m/z units of each sodiated [M + Na]+ (labeled on figure) and potassiated [M + K]+ monoisotopic masses are normalized to the total TAG ion signals on each pixel. A red-green linear color scale is used with maximum mol % value corresponding to 3% of total TAG for all images. See Supplemental Table 1 online for all cyclic TAG species identified and m/z analysis for each species. Bar = 1 mm.
Lipid Imaging in Cottonseed Embryos
627
Figure 6. Comparison of TAG Molecular Species Profiles at Different Spatial Resolutions. (A) Individual noncyclic TAG species were quantified as mol % of total TAG content: (1) at tissue resolution – TLE of mature embryos sampled through direct-infusion ESI-MS (n = 3); or (2) at cellular resolution – MALDI-MSI longitudinal and cross sections. These data are in agreement with results from DOMS of small lipid droplet populations (n = 3 sets of 10 to 25 lipid droplets) (Horn et al., 2011a). See Supplemental Table 1 online for all noncyclic TAG species identified and m/z analysis for each species. (B) Mol % distribution of TAGs with one or more acyl cyclic FAs (sterculic and/or dihydrosterculic) normalized to total TAG content in MALDI-MSI sections. See Supplemental Table 1 online for all cyclic TAG species identified and m/z analysis for each species. (C) Comparison of total 19C cyclics quantified by MALDI-MSI and GC-MS. For MALDI sections, 19C cyclic TAGs (sterculic + dihydrosterculic) were normalized to total TAG content. For GC-MS analysis, TLEs were converted to FAMEs with total 19C cyclic FAs (sterculic + dihydrosterculic) normalized to total FA content (n = 3). See Supplemental Figure 2 online for total FA composition quantified by GC-MS.
Heterogeneous Distribution of Individual PC Molecular Species PC is one of the most frequently analyzed lipid classes in MALDIMSI due to its abundance, matrix compatibility, and ease of ionization (Zabrouskov et al., 2001). Total PC distribution (Figure 2C) in the cross and longitudinal sections of cotton embryos was relatively homogenous with a slight reduction in PC within the embryonic axis. However, individual PC molecular species showed some substantial differences in tissue distribution when calculated as a mol % of the total PC (Figure 7). The two most abundant PC molecular species, PC-36:4 (m/z 782.571,
Figure 7C) and PC-34:2 (m/z 758.571, Figure 7A), were enriched within the cotyledons compared with the embryonic axis. The difference in PC-36:4 (LL) distribution was more pronounced than PC-34:2 (PL), reminiscent of the patterns found in the major TAG molecular species, TAG-54:6 (LLL, Figure 4D) and TAG52:4 (PLL, Figure 4B). The presence of 18:1 within a PC molecular species reversed the relative distribution patterns to where the embryonic axis was more enriched: for example, PC-36:3 (LO, m/z 784.586, Figure 7D versus 7C) and to a lesser degree PC34:1 (PO, m/z 760.585, Figure 7B versus 7A). The same trend was also found in TAG; the replacement of L with O resulted in
628
The Plant Cell
PC and cyclic TAG molecular species reinforces the important ability with imaging MS to visualize the spatial relationships of metabolites, especially where engineering elevated levels of industrial lipids (like cyclic FAs) might be desirable (Liu et al., 2009). Graphical Representation of Lipid Distributions
Figure 7. Distribution of Selected PC Molecular Species. Distribution of selected PC molecular species in mol %. Ion counts within 6 0.02 m/z units of each protonated [M + H]+ (labeled on figure), sodiated [M + Na]+, and potassiated [M + K]+ monoisotopic masses are normalized to the total PC ion signals on each pixel. A red-green linear color scale is used with a maximum mol % value corresponding to 35% of total PC for all images. See Supplemental Table 2 online for all PC species identified and m/z analysis for each species. Bar = 1 mm.
reversed or even distribution patterns between the cotyledons and axis (PLL versus PLO and LLL versus LLO). The relative average quantities determined by MALDI-MSI of each molecular species of PC in both cross and longitudinal sections were similar to distributions quantified in TLEs by ESI-MS (Figure 8). Unlike cyclic TAGs, cyclic PCs were slightly more abundant in the cross sections compared with longitudinal sections relatively speaking, but in both cases, cyclic PCs were localized almost exclusively within the embryonic axis (Figure 9). A comprehensive list of PCs identified by MALDI-MSI is available in Supplemental Table 2 online. In Sterculia foetida, where cyclopropenoic FAs are found up to 65 to 78% in seeds, there is evidence that the cyclopropane FA synthase enzyme synthesizes dihydrosterculate by an addition of a methyl group (from S-adenosyl-L-Met) at the delta-9, 10 position of oleate esterified at the sn-1 position of a PC molecule (Bao et al., 2002). Desaturation of dihydrosterculate to produce sterculate then occurs by a cyclopropane FA desaturase that is less characterized (Bao et al., 2002). Therefore, 19C cyclic FA on PC serves as the precursor source for cyclic FA transferred to TAG molecules as for other acyl moieties. Similar to the cyclicTAG molecular species imaged in cottonseeds, the PC molecular species with a sterculic or dihydrosterculic FA were almost exclusively found in the embryonic axis of embryos (Figure 9) consistent with previous reports that radicle tips were enriched in cyclic FAs (Schmid and Patterson, 1988). Several cyclic PC molecular species were identified that contain one linoleic acid or palmitic acid and either a sterculic or dihydrosterulic acid (Figures 9A to 9E). The colocalization in the embryonic axis of cyclic
An alternative approach to visualizing the distribution of molecular species within a lipid class by MALDI-MSI was to plot the mol % values relative to their x and y position (i.e., Figures 4, 5, 7, and 9). Traversing across the tissue sections (Figure 10A) represented two distinct tracks through developmentally and functionally different tissues. TAG and PC molecular species showed remarkably variable distribution patterns across the x axis (Figures 10B and 10C), especially between cotyledons and the embryonic axis. Despite being sectioned in different orientations, cross and longitudinal sections showed similar distribution patterns of TAG and PC relative to one another. These graphical distribution-type profiles, obtained from individual scans averaged at each location, can be adapted to the analysis of other metabolites and will be valuable in other studies for showing metabolite changes as a result of developmental maturity, cell type differences, or responses to environmental stresses. Imaging Other Membrane and Signaling Lipids PE is a common membrane phospholipid that contains a free amino group at the polar end of the molecule, unlike PC. Acyl groups on PE molecular species are not direct substrates for TAGs, but PE and PC share a biosynthetic route and potential diacylglycerol precursors in the ER. We were curious if this lipid class could be ionized and imaged in MALDI-MSI, given that embryos had been lightly fixed prior to sectioning. Indeed, PE molecular species distributions in embryos were profiled readily
Figure 8. Comparison of PC Molecular Species from MALDI-MSI Sections and TLEs. Individual PC species were quantified as mol % of total PC content for MALDI-MSI sections and by direct-infusion ESI-MS of the polar lipid fraction (purified through solid-phase extraction) of total embryo lipid extracts (n = 3).
Lipid Imaging in Cottonseed Embryos
629
by MALDI-MSI (Figure 11), and profiles were in reasonably good agreement with those obtained by quantitative, shotgun ESI-MS (Figure 11C). Although fewer major molecular species of PE were identified than for PC (cf. Supplemental Tables 2 and 3 online), some of the major species corresponding to the dominant PE species could be identified. Molecular species profiles of PE displayed a heterogeneous distribution (Figure 11) but different than might be predicted if PC and PE biosynthesis were coincident. PE-34:2 and PE-36:4 were distributed different from one another (Figure 11), demonstrating heterogeneity within the PE lipid class like that for other glycerolipids. Interestingly, PE-34:2 was distributed coincident with PC-34:2, more enriched in cotyledons than the axis. On the other hand, PE 36:4 was enriched in interior tissues of embryos, opposite the distribution of PC-36:4 (cf. Figures 7C and 11C), suggesting that there is an unequal utilization of DAG-36:4 precursors for these two membrane lipids in these two different tissues of the embryo, a concept that might have gone unrecognized without the ability to localize specific membrane lipid species together in situ. PC and PE are abundant membrane lipids, but some membrane lipids occur in much lower concentrations like PA, which functions as both an intermediate in TAG biosynthesis and an important signaling molecule in various stress responses (Testerink and Munnik, 2005; Wang et al., 2006). Here, we imaged the prevalent PA molecular species in cottonseeds (Figure 12). The major molecular species of PA was PA-36:3 (see Supplemental
Figure 10. Distribution of TAG, PC, and Corresponding FA Species across MALDI-MSI Sections.
Figure 9. Distribution of PCs Containing Sterculic and/or Dihydrosterculic FAs. Distribution of selected cyclic PC molecular species in mol %. The embryonic axis is outlined in the longitudinal sections to emphasize the localization of cyclic PCs. Ion counts within 6 0.02 m/z units of each sodiated [M + Na]+ (labeled on figure) and potassiated [M + K]+ monoisotopic masses are normalized to the total PC ion signals on each pixel. A red-green linear color scale is used with a maximum mol % value corresponding to 1% of total PC for all images. See Supplemental Table 2 online for all cyclic PC species identified and m/z analysis for each species. Bar = 1 mm.
(A) TIC distribution of cross and longitudinal sections. The line drawn through the sections represents the set of x, y coordinates analyzed for their TAG and PC relative molecular distributions (i.e., each pixel traversed across will have a MALDI-MSI spectrum associated with it). Bars = 1 mm. (B) Distribution of selected TAG species across the center of the crosssection plotted relative to their x axis location. Thin lines represent the individual mol % values at that x, y position for a particular species (purple, TAG-52:4 PLL; red, TAG-54:6 LLL; green, TAG-50:2 PPL; yellow, TAG-52:3 PLO; light blue, TAG-54:5 LLO; dark blue, combined sterculic/ dihydrosterculic cyclic TAGs). Thick lines represent a polynomial fit using Microsoft Excel to aid visualization of changes across the section. (C) Distribution of selected PC species across the center of the cross section plotted relative to their x axis location. Thin lines represent the individual mol % values at that x, y position for a particular species (purple, PC-34:2 PL; red, PC-36:4 LL; green, PC-36:3 LO; yellow, PC36:2 LS/OO; light blue, PC-34:1 PO; dark blue, combined sterculic/ dihydrosterculic cyclic PCs). Thick lines represent a polynomial fit using Microsoft Excel to aid visualization of changes across the section. (D) Summary of FA distribution patterns relative to their mol % contribution of the cross and longitudinal sections. Four distinct distributions patterns were present throughout the seed sections. Pattern strokes represent relative abundances for identified FAs: P-16:0, palmitic; Po16:1, palmitoleic, Ln-18:3, linolenic; L-18:2, linoleic; O-18:1, oleic acid; S-18:0, stearic, A-20:0: arachidic; Sc-19:1 sterculic acid; Dsc-19:0-dihydrosterculic acid; as well as those without identification (No ID).
630
The Plant Cell
Figure 11. Distribution of Selected PE Molecular Species. (A) to (C) Distribution of selected PE molecular species in mol %. Ion counts within 6 0.02 m/z units of each potassiated [M + K]+ (labeled on figure), protonated [M + H]+, and sodiated [M + Na]+ monoisotopic masses are normalized to the total PE ion signals on each pixel. A red-green linear color scale is used with a maximum mol % value corresponding to 50% of total PE for all images. See Supplemental Table 3 online for all PE species identified and m/z analysis for each species. Bar = 1 mm. (D) Comparison of PE molecular species from MALDI-MSI sections and polar lipid fractions (purified through solid-phase extraction) of TLEs analyzed by direct infusion (n = 3).
Table 4 online for all PA species identified), and it was distributed throughout the embryo with a greater relative percentage in the cotyledons. This acyl composition of the major PA species in embryos was not a reflection of the major TAG species in the cotyledon regions (LLL and PLL; Figure 4) and was opposite the distribution of PC-36:3 (potential precursor; Figure 7), which was more concentrated in the axis of the embryo. Several of the minor PA species showed some interesting apical/basal polarity in distribution within the embryo (Figure 12). For example, the PA 34:2 in longitudinal sections appeared to be enriched in micropylar regions of the embryo (Figure 12A, bottom right). While the functional significance of differences in PA species distributions remains to be elucidated, it appears from the species imaged here that the PA connection in these desiccated seeds is not one to TAG metabolism (which is most active during the embryo maturation stage) but rather may be linked to signaling functions of PA related to seed germination. These results indicate that lipids with known signaling functions can be imaged by MALDI-MSI and open the possibility of studying lipid signaling within a cellular context. DISCUSSION Visualizing the dynamic complexity of lipid metabolism at cellular resolution is not currently achievable with conventional, extraction-
based lipidomics. In this study, we adapted MALDI-MSI to uncover the detailed molecular distribution of major storage and membrane lipid classes in tissues of mature cotton embryos. Even minor membrane lipids and other types of lipid-soluble metabolites were able to be imaged by MALDI-MSI. Remarkable cell-type/tissue-specific variation was observed throughout the embryo in the composition of TAG, PC, PE, and PA molecular species, but there were discernible, apparently related, patterns based on acyl moieties in PC and TAG (Figures 4, 5, 7, 9, and 10). Individual TAG and PC molecular species with similar FA compositions had similar MALDI-MSI distribution profiles (Figure 10), which is not surprising given the metabolic relationship between PC and TAG (Chapman and Ohlrogge, 2012). More unexpectedly, we found that species with polyunsaturated FAs (almost all linoleic in cottonseed) were found at higher relative abundances in the cotyledon regions of the embryo relative to the embryonic axis (see Supplemental Figure 2 online). This was opposite for palmitic and oleic acids, which contributed proportionally more to glycerolipid species found within the embryonic axis. Lipids containing the less abundant stearic, arachidic (20:0), and palmitoleic (16:1) FAs were found uniformly distributed throughout the embryo (Figure 10D). Finally, sterculic and dihydrosterulic acids (cyclic FAs) were localized almost exclusively in the embryonic axis (see Supplemental Figure 2 online). The differences
Lipid Imaging in Cottonseed Embryos
Figure 12. Distribution of Selected PA Molecular Species. (A) to (D) Distribution of selected PA molecular species in mol %. Ion counts within 6 0.02 m/z units of each potassiated [M + K]+ (labeled on figure) and sodiated [M + Na]+ monoisotopic masses are normalized to the total PA ion signals on each pixel. A red-green linear color scale is used with a maximum mol % value corresponding to 60% of total PA for all images. See Supplemental Table 4 online for all PA species identified and m/z analysis for each species. Bar = 1 mm. (E) Comparison of PA molecular species from MALDI-MSI sections.
in molecular distribution of lipids are most certainly a consequence of differential gene expression and enzyme localization but also may imply differences in localized function beyond metabolic precursor/product relationships (i.e., PC-36:3 versus PC-36:4 or PA-36:3 versus PA-34:2). The information here about the heterogeneous distribution of lipids in cotton embryos is surprising but is consistent with the results from recent work with organellar lipidomics from cotton embryos (DOMS). DOMS of individual lipid droplets revealed that lipid droplets in cottonseed embryos displayed a remarkable organelle-to-organelle difference in TAG composition, yet when these different compositions were averaged together, they resembled the overall composition of cottonseed oil (Horn and Chapman, 2011; Horn et al., 2011a). Individual lipid droplets showed distinctly different compositions of TAG molecular species. Now these compositions of individual droplets can be explained at the level of regional heterogeneity within the embryos. For example, one droplet contained 17% PPL, 26%, PLL, 14% PLO, 12% LLL, and 10% LLO. This composition is consistent with the TAG molecular species composition range imaged by MALDI-MSI in the embryonic axis region (Figure 10). Hence, heterogeneity at the subcellular organelle level in lipid droplets from cottonseeds likely is contributed to by the regional differences in TAG synthesis and packaging in cottonseed embryos. The overall concept of cellular heterogeneity presents new challenges when considering cellular biochemistry in multicellu-
631
lar organisms. Further work will be needed to understand the precise mechanisms regulating these compositional differences at the cellular level, but this type of information may be important to predicting and defining limitations in metabolic engineering strategies. The assembly of TAGs in oilseeds involves multiple pathways and subcellular compartments (Bates et al., 2009; Chapman and Ohlrogge, 2012). FAs destined for incorporation into TAGs are synthesized in the plastid and exported (mostly as 16:0 and 18:1 FA) to the ER as part of an acyl-CoA pool. Acyl groups are used for glycerolipid synthesis in the ER by enzymes of the Kennedy pathway that provide DAG backbones for PC synthesis or for TAG synthesis. Alternatively, acyl-CoAs can be incorporated rapidly into PC independent of the Kennedy pathway (Bates et al., 2009). Acyl modification, including desaturation and cyclopropane addition, occurs in FAs esterified to PC (Sperling et al., 1993; Bao et al., 2002), so there is a dynamic and close relationship between acyl groups on PC and acyl groups in TAG. FA can be shuttled to TAGs through a number of different pathways: (1) acyl-CoA–dependent acyltransferases that assemble TAG on the glycerol backbone (Stymne and Stobart, 1987); (2) an acyl-CoA–independent mechanism for synthesizing TAGs (especially with usually FAs) through phospholipid:DAG acyltransferase (Dahlqvist et al., 2000); (3) an acyl editing mechanism between the acyl-CoA pool and PC via lysoPC acyltransferase or phospholipase A (Stymne and Stobart, 1984); and/or (4) the transfer of the phosphocholine head group between PC and DAG by PC:DAG cholinephosphotransferase to supply unsaturated DAG for TAG synthesis (Lu et al., 2009). Consequently, molecular species information for PC and TAG in cotton embryo tissues may help to predict unforeseen spatial differences in the pathways, genes, and enzymes responsible for the assembly of cottonseed TAG. For example, the identification of PC-36:3 with one 18:1 acyl chain in the embryonic axis suggests that this species is the source of 18:1 for the cyclopropane FA synthase and desaturase that is then transferred as cyclic FA to TAG. Also, the higher levels of linoleic acid in PC and TAG in the cotyledon tissues suggests there is a difference in delta-12 desaturase (FAD2) enzyme distribution with cottonseeds, and it is likely that a PC:DAG cholinephosphotransferase activity also functions in these tissues to enrich polyunsaturated FA in TAG (e.g., LLL and PLL). Addressing these types of questions at different stages of development or in combination with transgenic experiments and expression studies will lead to new insights into the cellular regulation of lipid synthesis in oilseeds. By extrapolation, studies of lipid metabolism by MALDI-MSI in other plant tissues or in different environmental conditions will extend a new perspective to the importance of lipid localization and function. The major molecular species of PE and PC are not exactly similar in cottonseeds (Figures 8 and 10). However, curiously, even the mol % distributions were differentially localized between the two major molecular species of PE and PC that had the same diacylglycerol moiety. For PC-36:4 and PE-36:4 (both di18:2), the distributions were opposite; PC-36:4 made up a larger mol fraction of total PC in the cotyledons than in the axis, whereas PE-36:4, although distributed throughout the embryo, appeared to make up a larger proportion of the total PE class
632
The Plant Cell
within regions of the embryonic axis. By contrast, PC-34:2 and PE-34:2 (both 16:0/18:2) appeared to have a similar, somewhat uniform, distribution to one another, although PC-34:2 was slightly more concentrated in cotyledonary tissues than in the axis tissues, relatively speaking. These differences in location may imply differences in function, but they are perplexing in terms of our views of PC/PE biosynthesis, since the diacylglycerol moieties for both of these phospholipid classes are believed to be assembled in the same subcellular compartment. Does this reflect differences in substrate preferences between cholineand ethanolamine-phosphotransferases? Why is so little PE36:3 made at all when PC-36:3 is a major PC molecular species concentrated within the embryonic axis? These results seem to point to an unknown level of compartmentation (and perhaps enzyme distribution/specificity) for membrane lipid biosynthesis that only now can be appreciated. The mass accuracy and dynamic range of the LTQ-Orbitrap mass spectrometer interfaced with MALDI ionization supported the identification and characterization of a large number of lipid compounds in cotton embryos. There remains a wealth of chemical information to be mined from MS imaging data. In typical MALDI-MSI spectra, there were multiple adducts (i.e., H+, K+, and Na+) for each lipid molecular species that substantially increased the number of detectable compounds 2 to 3 times that of direct-infusion ESI-MS with a single adduct. For PC and TAG species, most of these peaks could be separated from the surrounding other peaks by accurate mass measurements. The comparisons of spectra from MALDI-MSI with those from traditional chemical-based extracts analyzed by ESI-MS/MS were extremely valuable for compound identifications and should be employed in the analysis of other plant tissues by MALDI-MSI. MALDI-MSI yielded spectra with many peaks that have yet to be identified, indicating the need for algorithms to identify novel compound candidates that, because of their stability, localization, or concentration, are not otherwise possible to identify by ESI-MS/MS. The wide dynamic range of the instruments used permitted the detection of low-abundance cyclic FAs esterified to PC (e.g., most abundant cyclic PC is 1% of total PC, which itself is only ;2% of total lipid, which itself is ;20% oil of total seed weight or ;0.0004% of the total seed weight). Detection of minor lipid species makes it likely that lipids functioning as signaling molecules may be able to be localized by MALDI-MSI in the future. By way of example, the profiles of PA were determined in cottonseed sections. Amounts of PA are normally low in plant tissues, and this lipid can serve as an intermediate in TAG biosynthesis or as a central lipid mediator in signal transduction pathways (Testerink and Munnik, 2005; Wang et al., 2006). The distribution of PA species in embryos was intriguing, and based on comparisons of acyl composition of PA, PC, and TAG, the PA in desiccated seeds did not appear to be a reflection of metabolic flux to TAG. PA molecular species composition was dominated by PA 36:3, and this was distributed throughout the cotyledonary and embryonic axis tissues, with perhaps less relative representation in the axis region (based on mol % of total PA). This is in sharp contrast with the distribution of TAG and PC species that contain the combinations of 18:1 and 18:2 FA (Figures 4, 7, and 10). It is likely that direct-infusion lipidomics analysis of total seed
extracts would have revealed this same information, but what would be entirely obscured in tissue extractions is the apparent polar distributions of certain PA molecular species. The PA composition within the hypocotyl-root axis and the micropylar regions of the cotyledonary tissues of the embryo were very different from the rest of the embryo. Several relatively minor species were much more concentrated in these regions. PA has been shown to interact with the abscisic acid regulation of seed germination and postgerminative growth (Katagiri et al., 2005), and these PA species and their distribution in the radicle near the location of radicle protrusion may indicate a role in seed biology more related to signaling than TAG metabolism. Of course this speculation remains to be tested experimentally, but questions would not have been considered without knowing the heterogeneous localization of PA molecular species. Furthermore, these results point to the realistic possibility of imaging other signaling lipids and molecules for localized effects in plant tissues, opening up a new approach to visualizing signal transduction directly at the chemical and cellular levels. Several considerations were addressed when evaluating the veracity of the MALDI-MSI approach in seed sections. Analysis of PC and TAG (and other lipid classes) together by MS is known to be difficult due to ion suppression phenomena (Emerson et al., 2010). Ion suppression makes quantitative conclusions tenable without the addition of internal standards, as is routine in directinfusion lipidomic analyses. Here, we observed clear evidence of ion suppression in MALDI-MSI where ion intensities for TAG species were much less overall than for PC species despite the fact that there is ;50 times more TAG than PC in cottonseeds. Therefore, it is not prudent to interpret quantities of lipid classes directly from ion intensities in these MALDI-MSI spectra. This caution is reinforced when comparing the images from total ion distribution (Figure 2) to images of total lipid distribution by 1HNMR (Figure 3). NMR-derived images of cottonseed lipids, like those for soybean (Neuberger et al., 2008), showed most of the seed oil in cotyledon tissues relative to the embryonic axis (Figure 3). This appeared to be the reverse in ion intensity profiles by MALDI-MSI (Figure 2B). However, PC was relatively more abundant in cotyledon tissues of cotton embryos (Figure 2C), and we presume that signals from TAG were relatively more suppressed by PC in these regions. The future development of methods to include internal standards within the sample matrix may help to improve the quantitative nature of imaging in situ. Nonetheless, it was still possible to obtain relative composition information within lipid classes by MALDI-MSI. This was confirmed by comparing MS scans averaged across sections where mol percentages of TAG molecular species (Figure 7) were in excellent agreement with those obtained by quantitative, directinfusion ESI-MS/MS of lipid extracts, or by DOMS of isolated cottonseed lipid droplets (Horn et al., 2011a). Similar results were observed for PC species profiles (Figure 10). There may be an overrepresentation of cyclic FA species in ESI-MS, but, in general, the TAG and PC lipid compositions by MALDI-MSI were similar to those obtained by conventional quantitative techniques, and these were all in good agreement with values reported in the literature for cottonseed lipid species quantified by other methods (e.g., high performance liquid chromatography/ thin layer chromatography/GC; Lı´ sa and Holcapek, 2008;
Lipid Imaging in Cottonseed Embryos
Dowd et al., 2010; Dowd, 2011). It should be noted that the same approach has been taken by Murphy and coworkers in comparison of each PC molecular species of rat brain cross sections between MALDI-MSI and liquid chromatography–MS/MS analysis, and quantitative agreement was found regardless of the tissue type (Hankin and Murphy, 2010). We conclude that by examining the mol fraction of individual species within lipid classes, MALDI-MSI is an accurate representation of lipid distribution within sections of plant tissues. In expanding applications of MALDI-MSI to other types of plant tissues, attention will need to be placed on sample preparation and the balance between structural and chemical integrity. First of all, according to our and others’ experiences, polymer embedding materials cannot be used for soft plant tissues in cryosectioning because they penetrate into the tissues and produce significant polymer contaminations in MS measurements. Other materials, such as ice and gelatins, are suggested in those cases (Chughtai and Heeren, 2010). We could still use optimal cutting temperature polymers in hard tissues like cottonseeds, but we had another issue of surface smearing during the cryosectioning. Hence, we fixed the embryos with paraformaldehyde before cryosectioning to preserve the tissue integrity. It should be emphasized here that chemical profiles for lipids were not different between unfixed and lightly fixed seed tissues. Also, lipid molecular species profiles by MALDI-MSI were in good agreement with those obtained from TLEs by ESI-MS. This was even the case for PE, which has a free amino group and might be expected to be susceptible to fixation by formaldehyde. So while fixation might present a problem in the profiling of proteins, we do not consider this to be a major issue for lipid imaging by MALDI-MSI. However, it is possible that other targeted lipid classes or species may be impacted adversely by chemical fixation or embedding procedures, and suitable methods may need to be developed to broaden the range of compounds that can be imaged by MALDI-MSI. In any case, the major value of knowing the spatial distribution of chemical compositions in plants will likely drive development of new approaches that combine MS-based analysis with cellular and even subcellular imaging, and these efforts will form the basis for improved understanding of plant biochemistry at higher resolution. METHODS Cottonseed Material Cotton (Gossypium hirsutum cv Coker 312) plants grown in soil were maintained at 308C in an air-conditioned greenhouse supplemented with Na-vapor lamps for an extended daylength of 16 h. Seeds were harvested from mature bolls and delinted in a tabletop, 10-saw laboratory gin. Intact mature embryos were excised from the seed coat with a standard razor blade in preparation for sectioning or chemical extraction. Sample Preparation for MALDI-MS Imaging Mature cotton embryos were either unfixed or lightly fixed with 4% paraformaldehyde for 30 min to preserve structural characteristics during sectioning. Excess fixative was washed off the seeds with three successive 5-min washes in 50 mM PIPES-NaOH, pH 7.2. Seeds were mounted
633
on a minimal amount of optimal cutting temperature polymer (Sakura Finetek) and then covered with the optimal cutting temperature polymer completely. The samples were flash frozen with powdered dry ice on a cryostat holder, covered with an aluminum foil, and maintained at 2808C for 10 to 15 min. Seeds were sectioned in a cryostat (Leica 1800 cryocut) at 2208C, and 30-mm sections in cross-orientation or longitudinal orientation relative to the embryonic axis were collected on glass slides and placed in evacuated desiccators at room temperature until ready for shipment to Iowa State University for analysis. Samples were stored in desiccators at Iowa State University until ready for MSI analysis. MSI The 2,5-Dihydroxybenzoic acid (Sigma-Aldrich) was applied by sublimation, using a procedure adapted from Hankin et al. (2007). MS imaging was conducted using a MALDI linear ion trap-Orbitrap hybrid mass spectrometer (MALDI LTQ Orbitrap-Discovery; Thermo Fisher Scientific). Spectra were collected using the Orbitrap analyzer with Xcalibur (v.2.0.7) data acquisition software. The instrument was equipped with an intermediate pressure (75 mTorr) MALDI source using a nitrogen laser (MNL 100; Lasertechnik Berlin), providing an output at 337 nm with a maximum energy of 80 mJ per pulse and a repetition rate of 60 Hz (Strupat et al., 2009). A 3-mm aperture was placed in the beam path to reduce the spot size at the sample surface to 35 to 40 mm, as measured by inspection of burn marks on a thin film of a-cyano-hydroxycinnamic acid (Qiao et al., 2008). MS images were collected for the selected area in the positive ion mode with a 50-mm raster step size. The Orbitrap analyzer was used for MS data acquisition at the nominal resolution of 30,000. Automatic gain control was turned off, and other data acquisition conditions were optimized each time. Typical experimental conditions were as follows: laser power per pulse of 5 to 10 mJ, the number of laser pulse per spectra of one to five, and the number of scans averaged per pixel of 3 to 10. To avoid damage to tissue sections used for imaging, sections prepared in parallel to those imaged were used for this optimization. Processing for MSI Raw spectra files acquired from the Orbitrap analyzer were converted to . txt files using the Xcalibur 2.0.7 conversion feature for further processing with a custom, in-house Java MALDI-imaging analysis application, LipidImager. The text version retains all spectral information in a format suitable for further analysis with LipidImager. Each MALDI mass scan (or set of scans) represents an absolute position (i.e., with x, y coordinates) analyzed within the seed section. Individual scans, or an averaged set of scans, at a particular x, y position were processed to search for compounds of a desired m/z within tolerance limits of 0.02 D. This tolerance was selected based on the high resolving power of the Orbitrap analyzer and refined through rounds of m/z analysis of peaks identified (see Supplemental Tables 1 to 4 online). Several adducts were found for each lipid class analyzed (see Supplemental Tables 1 to 4 online). TAGs were detected as both sodium and potassium adducts with both being used to generate chemical images of TAGs. Mol percentages within a particular lipid class at an x, y position were calculated based on absolute intensities of identified compounds relative to the total ion intensity summed for the lipid class (see example calculation in Supplemental Figure 1 online). Since no internal standards were able to be added, absolute quantities (e.g., mg) were not calculated. MALDI-MS images were generated in Java by converting the x, y coordinates associated with each scan and the corresponding mol % of a particular compound at that location into a colored-square pixel according to a gray or green-to-red color scale (see example in Supplemental Figure 1 online). Distribution profiles of sections were generated from a known absolute x, y position of a scan (or set of scans) and the pixels representing the mol % (or TIC) at that point. Scale bars were
634
The Plant Cell
automatically generated by converting the absolute size of the pixel representation used for each image. Using an optical image from each type of section, an outlined template was overlaid onto each MALDI image in Adobe Photoshop CS4.
capillary voltage of 3.5 kV, cone voltage of 40 V, hexapole two voltage of 1.0 V, source/desolvation temperatures of 80/2008C, and cone/desolvation gas flows of 75/200 L/Hr. All solvents were optima grade from ThermoFisher Scientific.
Total Lipid Determination by Magnetic Resonance Imaging
Supplemental Data
The NMR imaging experiments were performed using a Bruker 750 WB Micro Imaging System (Bruker) equipped with a 20-mm birdcage coil. To visualize the lipids within the seed, a spin-echo sequence with selective excitation of the lipid resonance was applied. To avoid noise due to relaxation, the echo time was minimized (4.5 ms) and a long repetition time of 3.5 s was chosen. During the 19.5-h measurement, an isotropic resolution of 80 mm was achieved. The images were quantified based on the total seed lipid content, determined using a Bruker minispec mq60.
The following materials are available in the online version of this article.
Lipid Extraction Total lipids were extracted from seeds as described (Chapman and Moore, 1993), except that seeds were flash frozen in liquid nitrogen and powdered with a mortar and pestle. Powdered seed material, while still frozen, was transferred to hot (708C) isopropanol and incubated for 30 min to inactivate endogenous phospholipases. Chloroform was added at a ratio 2:1:0.45 (v/v/w) isopropanol:chloroform tissue to form a monophasic extraction solution that was incubated overnight at 48C. Lipids were purified by two-phase partitioning with chloroform and 1 M KCl, and the organic layer was washed three times with 1 M KCl. Lipid samples were dried under N2 and resuspended in chloroform and stored at 2208C under N2 until MS or GC-MS analysis. Polar lipids were fractionated from TLEs by silica gel column chromatography in methanol (Supelco Discovery DSC-Si; 6 mL, 500-mg solid phase extraction cartridges) after eluting neutral lipids in two steps with hexane:diethyl ether at 4:1 and 1:1 by volume. GC-MS Analysis of FA Composition TLEs subjected to GC-MS analysis were dried under N2 and resuspended in toluene. FA methyl esters (FAMEs) were prepared via base-catalyzed transesterification essentially as described by Christie (1989). Briefly, 0.5 M sodium methoxide in anhydrous methanol (Sigma-Aldrich) was added to TLEs and maintained at 508C for 10 min. After addition of acetic acid and water, FAMEs were extracted into hexane. FAMEs were separated on an Agilent model 6890 GC with a DB-5 column and analyzed with a 5973 mass selective detector. A multiramp temperature program was applied for optimal separation with an initial 3-min initial hold at 1508C, increasing to 2108C at 108C/min, increasing to 2158C at 0.88C/min, increasing to 2508C at 58C/min, increasing to 2808C at 158C/min, and a final 2 min hold at 2808C. Direct-Infusion ESI-MS TLEs were analyzed by direct-infusion ESI-MS/MS (Bartz et al., 2007) on a Waters Micromass Quattro Ultima triple quadrupole mass spectrometer. Samples were evaporated to dryness and resuspended in 1:1 (v/v) chloroform:methanol plus 10 mM ammonium acetate for MS. TAGs were identified as ammonium adducts in positive ion mode with acyl composition determined through neutral loss fragmentation scans (collision energy 30) for individual acyl chains. TAGs were quantified in full scan mode. PCs were identified and quantified as hydrogen adducts in positive ion mode (collision energy 35) with a precursor loss of the phosphocholine head group (+184 m/z). PEs were identified and quantified as hydrogen adducts in positive ion mode (collision energy 30) with a neutral loss of the phosphoethanolamine head group (+141 m/z). Typical scanning conditions included a direct-infusion flow rate of 15 mL/min,
Supplemental Figure 1. Example Conversion of Raw MS Data to a Set of MS Images on an Absolute and Relative Scale. Supplemental Figure 2. Fatty Acid Composition of Total Cottonseed Lipid Extracts. Supplemental Table 1. Triacylglycerol Molecular Species Analyzed by MALDI-MSI. Supplemental Table 2. Phosphatidylcholine Molecular Species Analyzed by MALDI-MSI. Supplemental Table 3. Phosphatidylethanolamine Molecular Species Analyzed by MALDI-MSI. Supplemental Table 4. Phosphatidic Acid Molecular Species Analyzed by MALDI-MSI. Supplemental Movie 1. Video Reconstruction of the Distribution of Total Seed Lipid Content by Nuclear Magnetic Resonance.
ACKNOWLEDGMENTS This research was supported in part by grants from Cotton Incorporated (Agreement 08-395) and from the U.S. Department of Energy (US-DOE), Office of Science, Biological and Environmental Research (DESC0000797) and Basic Energy Sciences (DE-FG02-05ER15647) to K.D.C. P.J.H. was supported through the University of North Texas Doctoral Fellowship program. The MSI measurements were conducted at the Ames Laboratory and supported by the US-DOE, Office of Basic Energy Sciences, Division of Chemical Sciences, Geosciences, and Biosciences through the Ames Laboratory. The Ames Laboratory is operated for the US-DOE by Iowa State University under Contract DEAC02-07CH11358. We thank the Jannon L. Fuchs laboratory for access to the cryostat and assistance in preparing sections. We thank Duane Huggett for access to his Waters Micromass Quattro Ultima triple quadrupole mass spectrometer for direct-infusion ESI-MS/MS measurements. AUTHOR CONTRIBUTIONS K.D.C., Y.-J.L., P.J.H., P.B.N., V.S., and K.S. designed the research. A.R.K., P.B.N., P.J.H., J.F., L.B., E.L., and K.S. performed the research. P.J.H. wrote the lipidomics imaging software. All authors analyzed the data. P.J.H., K.D.C., and Y.-J.L. wrote the article with editorial assistance from others.
Received December 7, 2011; revised January 23, 2012; accepted February 1, 2012; published February 14, 2012.
REFERENCES Adams, R., Geissman, T.A., and Edwards, J.D. (1960). Gossypol, a pigment of cottonseed. Chem. Rev. 60: 555–574. Bao, X., Katz, S., Pollard, M., and Ohlrogge, J. (2002). Carbocyclic fatty acids in plants: biochemical and molecular genetic characterization of cyclopropane fatty acid synthesis of Sterculiafoetida. Proc. Natl. Acad. Sci. USA 99: 7172–7177.
Lipid Imaging in Cottonseed Embryos
Bartz, R., Li, W.-H., Venables, B., Zehmer, J.K., Roth, M.R., Welti, R., Anderson, R.G.W., Liu, P., and Chapman, K.D. (2007). Lipidomics reveals that adiposomes store ether lipids and mediate phospholipid traffic. J. Lipid Res. 48: 837–847. Bates, P.D., Durrett, T.P., Ohlrogge, J.B., and Pollard, M. (2009). Analysis of acyl fluxes through multiple pathways of triacylglycerol synthesis in developing soybean embryos. Plant Physiol. 150: 55–72. Berry, K.A.Z., Li, B., Reynolds, S.D., Barkley, R.M., Gijo´n, M.A., Hankin, J.A., Henson, P.M., and Murphy, R.C. (2011). MALDI imaging MS of phospholipids in the mouse lung. J. Lipid Res. 52: 1551–1560. Burrell, M., Earnshaw, C., and Clench, M. (2007). Imaging Matrix Assisted Laser Desorption Ionization Mass Spectrometry: A technique to map plant metabolites within tissues at high spatial resolution. J. Exp. Bot. 58: 757–763. Cai, Y.-Z., Xing, J., Sun, M., and Corke, H. (2006). Rapid identification of betacyanins from Amaranthus tricolor, Gomphrena globosa, and Hylocereus polyrhizus by matrix-assisted laser desorption/ionization quadrupole ion trap time-of-flight mass spectrometry (MALDI-QITTOF MS). J. Agric. Food Chem. 54: 6520–6526. Cha, S., Zhang, H., Ilarslan, H.I., Wurtele, E.S., Brachova, L., Nikolau, B.J., and Yeung, E.S. (2008). Direct profiling and imaging of plant metabolites in intact tissues by using colloidal graphite-assisted laser desorption ionization mass spectrometry. Plant J. 55: 348–360. Chapman, K.D., and Moore, T.S., Jr. (1993). N-acylphosphatidylethanolamine synthesis in plants: Occurrence, molecular composition, and phospholipid origin. Arch. Biochem. Biophys. 301: 21–33. Chapman, K.D., Neogi, P.B., Hake, K.D., Stawska, A.A., Speed, T.R., Cotter, M.Q., Garrett, D.C., Kerby, T., Richardson, C.D., Ayre, B.G., Ghosh, S., and Kinney, A.J. (2008). Reduced oil accumulation in cottonseeds transformed with a nonfunctional allele of a delta-12 fatty acid desaturase (FAD2). Crop Sci. 48: 1470–1481. Chapman, K.D., and Ohlrogge, J.B. (2012). Compartmentation of triacylglycerol accumulation in plants. J. Biol. Chem. 287: 2288–2294. Chaurand, P., Cornett, D.S., Angel, P.M. and Caprioli, R.M. (2011). From whole-body sections down to cellular level, multiscale imaging of phospholipids by MALDI mass spectrometry. Mol. Cell. Proteomics 10: O110.004259. Chen, Y., Allegood, J., Liu, Y., Wang, E., Cacho´n-Gonzalez, B., Cox, T.M., Merrill, A.H., Jr., and Sullards, M.C. (2008). Imaging MALDI mass spectrometry using an oscillating capillary nebulizer matrix coating system and its application to analysis of lipids in brain from a mouse model of Tay-Sachs/Sandhoff disease. Anal. Chem. 80: 2780– 2788. Christie, W.W. (1989). Gas Chromatography and Lipids: A Practical Guide. (Dundee, Scotland: Oily Press). Chughtai, K., and Heeren, R.M.A. (2010). Mass spectrometric imaging for biomedical tissue analysis. Chem. Rev. 110: 3237–3277. Cornett, D.S., Reyzer, M.L., Chaurand, P., and Caprioli, R.M. (2007). MALDI imaging mass spectrometry: Molecular snapshots of biochemical systems. Nat. Methods 4: 828–833. Dahlqvist, A., Sta˚hl, U., Lenman, M., Banas, A., Lee, M., Sandager, L., Ronne, H., and Stymne, S. (2000). Phospholipid:diacylglycerol acyltransferase: An enzyme that catalyzes the acyl-CoA-independent formation of triacylglycerol in yeast and plants. Proc. Natl. Acad. Sci. USA 97: 6487–6492. Dowd, M.K. (2011). Cottonseed oil. In Vegetable Oils in Food Technology: Composition, Properties and Uses, 2nd ed, F.D. Gunstone, ed (Oxford, UK: Wiley-Blackwell), pp. 199–224. Dowd, M.K., Boykin, D.L., Meredith, W.R., Jr., Campbell, B.T., Bourland, F.M., Gannaway, J.R., Glass, K.M., and Zhang, J. (2010). Fatty acid profiles of cottonseed genotypes from the National Cotton Variety Trials. J. Cotton Sci. 14: 64–73.
635
Eggeling, C., Ringemann, C., Medda, R., Schwarzmann, G., Sandhoff, K., Polyakova, S., Belov, V.N., Hein, B., von Middendorff, C., Scho¨nle, A., and Hell, S.W. (2009). Direct observation of the nanoscale dynamics of membrane lipids in a living cell. Nature 457: 1159–1162. Emerson, B., Gidden, J., Lay, J.O., Jr., and Durham, B. (2010). A rapid separation technique for overcoming suppression of triacylglycerols by phosphatidylcholine using MALDI-TOF MS. J. Lipid Res. 51: 2428–2434. Fuchs, B., Su¨ss, R., and Schiller, J. (2010). An update of MALDI-TOF mass spectrometry in lipid research. Prog. Lipid Res. 49: 450–475. Gidden, J., Liyanage, R., Durham, B., and Lay, J.O., Jr. (2007). Reducing fragmentation observed in the matrix-assisted laser desorption/ionization time-of-flight mass spectrometric analysis of triacylglycerols in vegetable oils. Rapid Commun. Mass Spectrom. 21: 1951–1957. Han, X., and Gross, R.W. (2001). Quantitative analysis and molecular species fingerprinting of triacylglyceride molecular species directly from lipid extracts of biological samples by electrospray ionization tandem mass spectrometry. Anal. Biochem. 295: 88–100. Han, X., and Gross, R.W. (2005). Shotgun lipidomics: Electrospray ionization mass spectrometric analysis and quantitation of cellular lipidomes directly from crude extracts of biological samples. Mass Spectrom. Rev. 24: 367–412. Hankin, J.A., Barkley, R.M., and Murphy, R.C. (2007). Sublimation as a method of matrix application for mass spectrometric imaging. J. Am. Soc. Mass Spectrom. 18: 1646–1652. Hankin, J.A., and Murphy, R.C. (2010). Relationship between MALDI IMS intensity and measured quantity of selected phospholipids in rat brain sections. Anal. Chem. 82: 8476–8484. Hedin, P.A., Parrott, W.L., and Jenkins, J.N. (1992). Relationships of glands, cotton square terpenoid aldehydes, and other allelochemicals to larval growth of Heliothis virescens (Lepidoptera: Noctuidae). J. Econ. Entomol. 85: 359–364. Horn, P., Neogi, P., Tombokan, X., Ghosh, S., Campbell, B., and Chapman, K. (2011b). Simultaneous quantification of oil and protein in cottonseed by low-field time-domain nuclear magnetic resonance. J. Am. Oil Chem. Soc. 88: 1521–1529. Horn, P.J., and Chapman, K.D. (2011). Organellar lipidomics. Plant Signal. Behav. 6: 1594–1596. Horn, P.J., Ledbetter, N.R., James, C.N., Hoffman, W.D., Case, C.R., Verbeck, G.F., and Chapman, K.D. (2011a). Visualization of lipid droplet composition by direct organelle mass spectrometry. J. Biol. Chem. 286: 3298–3306. Hu, Q., Noll, R.J., Li, H., Makarov, A., Hardman, M., and Graham Cooks, R. (2005). The Orbitrap: A new mass spectrometer. J. Mass Spectrom. 40: 430–443. Jones, L.A., and King, C.C. (1996). Cottonseed oil. In Bailey’s Industrial Oil and Fat Products, Y. Hui, ed (New York: John Wiley & Sons), pp. 159–240. Jun, J.H., Song, Z., Liu, Z., Nikolau, B.J., Yeung, E.S., and Lee, Y.J. (2010). High-spatial and high-mass resolution imaging of surface metabolites of Arabidopsis thaliana by laser desorption-ionization mass spectrometry using colloidal silver. Anal. Chem. 82: 3255– 3265. Kaspar, S., Peukert, M., Svatos, A., Matros, A., and Mock, H.-P. (2011). MALDI-imaging mass spectrometry - An emerging technique in plant biology. Proteomics 11: 1840–1850. Katagiri, T., Ishiyama, K., Kato, T., Tabata, S., Kobayashi, M., and Shinozaki, K. (2005). An important role of phosphatidic acid in ABA signaling during germination in Arabidopsis thaliana. Plant J. 43: 107–117. Koestler, M., Kirsch, D., Hester, A., Leisner, A., Guenther, S., and Spengler, B. (2008). A high-resolution scanning microprobe matrixassisted laser desorption/ionization ion source for imaging analysis on
636
The Plant Cell
an ion trap/Fourier transform ion cyclotron resonance mass spectrometer. Rapid Commun. Mass Spectrom. 22: 3275–3285. Lee, Y.J., Perdian, D.C., Song, Z., Yeung, E., and Nikolau, B. (2012). Use of mass-spectrometry for imaging metabolites in plants. Plant J., in press. Lı´sa, M., and Holcapek, M. (2008). Triacylglycerols profiling in plant oils important in food industry, dietetics and cosmetics using high-performance liquid chromatography-atmospheric pressure chemical ionization mass spectrometry. J. Chromatogr. A 1198-1199: 115–130. Liu, Q., Singh, S., Chapman, K., and Green, A. (2009). Bridging traditional and molecular genetics in modifying cottonseed oil. In Genetics and Genomics of Cotton, A.H. Paterson, ed (New York: Springer), pp. 1–30. Lu, C., Xin, Z., Ren, Z., Miquel, M., and Browse, J. (2009). An enzyme regulating triacylglycerol composition is encoded by the ROD1 gene of Arabidopsis. Proc. Natl. Acad. Sci. USA 106: 18837–18842. Murphy, R.C., Hankin, J.A., and Barkley, R.M. (2009). Imaging of lipid species by MALDI mass spectrometry. J. Lipid Res. 50 (suppl.): S317– S322. Neuberger, T., Sreenivasulu, N., Rokitta, M., Rolletschek, H., Go¨bel, C., Rutten, T., Radchuk, V., Feussner, I., Wobus, U., Jakob, P., Webb, A., and Borisjuk, L. (2008). Quantitative imaging of oil storage in developing crop seeds. Plant Biotechnol. J. 6: 31–45. Obert, J.C., Hughes, D., Sorenson, W.R., McCann, M., and Ridley, W.P. (2007). A quantitative method for the determination of cyclopropenoid fatty acids in cottonseed, cottonseed meal, and cottonseed oil (Gossypium hirsutum) by high-performance liquid chromatography. J. Agric. Food Chem. 55: 2062–2067. Perdian, D.C., and Lee, Y.J. (2010). Imaging MS methodology for more chemical information in less data acquisition time utilizing a hybrid linear ion trap-orbitrap mass spectrometer. Anal. Chem. 82: 9393–9400. Qiao, H., Spicer, V., and Ens, W. (2008). The effect of laser profile, fluence, and spot size on sensitivity in orthogonal-injection matrixassisted laser desorption/ionization time-of-flight mass spectrometry. Rapid Commun. Mass Spectrom. 22: 2779–2790. Schaub, T.M., Hendrickson, C.L., Horning, S., Quinn, J.P., Senko, M.W., and Marshall, A.G. (2008). High-performance mass spectrometry: Fourier transform ion cyclotron resonance at 14.5 Tesla. Anal. Chem. 80: 3985–3990. Schmelzer, K., Fahy, E., Subramaniam, S., and Dennis, E.A. (2007). The lipid maps initiative in lipidomics. In Methods in Enzymology, H.A. Brown, ed (San Diego, CA: Academic Press), pp. 171–183. Schmid, K.M., and Patterson, G.W. (1988). Distribution of cyclopropenoid fatty acids in malvaceous plant parts. Phytochemistry 27: 2831–2834. Sperling, P., Linscheid, M., Sto¨cker, S., Mu¨hlbach, H.P., and Heinz, E. (1993). In vivo desaturation of cis-delta 9-monounsaturated to cisdelta 9,12-diunsaturated alkenylether glycerolipids. J. Biol. Chem. 268: 26935–26940. Stipanovic, R.D., Bell, A.A., and Benedict, C.R. (1999). Cotton pest resistance: The role of pigment gland constituent. In Biologically Active Natural Products: Agrochemicals, H.G. Cutler and S.J. Cutler, eds (Boca Raton, FL: CRC Press), pp. 211–220. Strupat, K., Kovtoun, V., Bui, H., Viner, R., Stafford, G., and Horning, S. (2009). MALDI produced ions inspected with a linear ion trap-
Orbitrap hybrid mass analyzer. J. Am. Soc. Mass Spectrom. 20: 1451–1463. Stymne, S., and Stobart, A. (1987). Triacylglycerol biosynthesis. In The Biochemistry of Plants: A Comprehensive Treatise, P. Stumpf, ed (New York: Academic Press), pp. 175–214. Stymne, S., and Stobart, A.K. (1984). Evidence for the reversibility of the acyl-CoA:lysophosphatidylcholine acyltransferase in microsomal preparations from developing safflower (Carthamus tinctorius L.) cotyledons and rat liver. Biochem. J. 223: 305–314. Sunilkumar, G., Campbell, L.M., Puckhaber, L., Stipanovic, R.D., and Rathore, K.S. (2006). Engineering cottonseed for use in human nutrition by tissue-specific reduction of toxic gossypol. Proc. Natl. Acad. Sci. USA 103: 18054–18059. Suzuki, T., Midonoya, H., and Shioi, Y. (2009). Analysis of chlorophylls and their derivatives by matrix-assisted laser desorption/ionizationtime-of-flight mass spectrometry. Anal. Biochem. 390: 57–62. Testerink, C., and Munnik, T. (2005). Phosphatidic acid: A multifunctional stress signaling lipid in plants. Trends Plant Sci. 10: 368–375. Verleyen, T., Forcades, M., Verhe, R., Dewettinck, K., Huyghebaert, A., and De Greyt, W. (2002). Analysis of free and esterified sterols in vegetable oils. J. Am. Oil Chem. Soc. 79: 117–122. Vieler, A., Wilhelm, C., Goss, R., Su¨ss, R., and Schiller, J. (2007). The lipid composition of the unicellular green alga Chlamydomonas reinhardtii and the diatom Cyclotella meneghiniana investigated by MALDI-TOF MS and TLC. Chem. Phys. Lipids 150: 143–155. Vrkoslav, V., Muck, A., Cvacka, J., and Svatos, A. (2010). MALDI imaging of neutral cuticular lipids in insects and plants. J. Am. Soc. Mass Spectrom. 21: 220–231. Wang, X., Devaiah, S.P., Zhang, W., and Welti, R. (2006). Signaling functions of phosphatidic acid. Prog. Lipid Res. 45: 250–278. Welti, R., Shah, J., Li, W., Li, M., Chen, J., Burke, J.J., Fauconnier, M.-L., Chapman, K., Chye, M.L., and Wang, X. (2007). Plant lipidomics: Discerning biological function by profiling plant complex lipids using mass spectrometry. Front. Biosci. 12: 2494–2506. Wessels, J.T., Yamauchi, K., Hoffman, R.M., and Wouters, F.S. (2010). Advances in cellular, subcellular, and nanoscale imaging in vitro and in vivo. Cytometry A 77: 667–676. Wiesman, Z., and Chapagain, B.P. (2009). Determination of fatty acid profiles and TAGs in vegetable oils by MALDI-TOF/MS fingerprinting. Methods Mol. Biol. 579: 315–336. Yunusova, S.G., Gusakova, S.D., and Umarov, A.U. (1982). Stereospecific analysis of the triacylglycerols of cottonseed oil. Chem. Nat. Compd. 18: 396–399. Zabrouskov, V., Al-Saad, K.A., Siems, W.F., Hill, H.H., Jr., and Knowles, N.R. (2001). Analysis of plant phosphatidylcholines by matrix-assisted laser desorption/ionization time-of-flight mass spectrometry. Rapid Commun. Mass Spectrom. 15: 935–940. Zaima, N., Goto-Inoue, N., Hayasaka, T., and Setou, M. (2010). Application of imaging mass spectrometry for the analysis of Oryza sativa rice. Rapid Commun. Mass Spectrom. 24: 2723–2729. Zhang, H., Cha, S., and Yeung, E.S. (2007). Colloidal graphite-assisted laser desorption/ionization MS and MS(n) of small molecules. 2. Direct profiling and MS imaging of small metabolites from fruits. Anal. Chem. 79: 6575–6584.
Supplemental Data. Horn et al. (2012). Plant Cell 10.1105/tpc.111.094581
Supplemental Data. Horn et al. (2012). Plant Cell 10.1105/tpc.111.094581
Supplemental Figure 1. Example conversion of raw MS data to a set of MS images on an absolute and relative scale. (A) Imaging setup: MALDI-MS spectra are acquired at each x, y position within a 3 x 3 square for a total of 9 spectra (#19). Each spectrum will have an absolute x, y position associated with it as the laser rasterizes across each individual position. For example, in spectrum #1 the x, y position is {0, 0} and for spectrum #6 the x, y position is {1, 2}. (B) Data Acquisition: Within each spectrum the absolute intensity (in counts) of 3 compounds (Compound A, Compound B, and Compound C) is acquired (see column Absolute Intensity (Counts)). For example, in spectra #5: Compound A’s intensity was 0 counts, Compound B’s intensity was 50 counts, and Compound C’s intensity was 75 counts. (C) Calculation of relative compound values: For each individual spectrum the relative units of each compound can be calculated as follows: 1) Determine the absolute intensity units of selected compounds within a spectrum: In spectrum #3 Compound A has 100 counts, Compound B has 50 counts, and Compound C has 50 counts 2) Calculate the sum of the total counts for the selected spectrum: In spectrum #3 the total counts are 200 counts (Compound A counts + Compound B counts + Compound C counts = 100 counts + 50 counts + 50 counts). 3) Divide a compound’s absolute units by the total units within that spectrum. In spectrum #3 Compound A = 100 counts with the total counts for that spectrum 200 counts. Therefore Compound A is 50 mol % (100 counts / 200 counts * 100% = 50 mol %). The counts can be converted to mol % since these are relative amounts calculated within a spectrum and are not absolute quantities. For Compounds B and C a similar calculation can be made to get 25 and 25 mol %, respectively. Therefore the maximum and minimum mol % a compound can be is 100 and 0%, respectively for a particular spectra. (D) Convert absolute counts into pixel RGB values: To create a MS image representing the absolute distribution of a compound within the 3 x 3 area we need to convert the absolute intensity (in counts) into a Red-Green-Blue (RGB) value that can visually represent the absolute intensity. 1) Determine the maximum absolute intensity for a compound. For example, Compound A, B, and C’s maximum intensities are 1000, 1000, and 500 counts respectively. 2) Greyscale colors are generated by setting the Red = Green = Blue value with an 8-bit color system (0-255) (e.g. white = {255, 255, 255} and black {0, 0, 0}). The formula to convert an absolute intensity into a linear greyscale RGB value is: greyscale value = 255 – 255 * absolute intensity / maximum absolute intensity. The final greyscale value should be rounded to an integer before image generation. For example for spectrum #1, Compound A: the greyscale value will equal 242 where the absolute intensity is 50 counts and the maximum intensity is 1000 counts
Supplemental Data. Horn et al. (2012). Plant Cell 10.1105/tpc.111.094581
(= 255 – 255 * 50 counts / 1000 counts). This will correspond to a very light grey RGB representation {242, 242, 242}. 3) A similar image could be created (as done in the manuscript) by normalizing the counts for each compound relative to the total counts acquired for entire spectrum (i.e. including all other compounds identified and non-identified). (E) Convert relative mol % values into pixel RGB values: To create an MS image representing the relative distribution of a compound within the 3 x 3 area we need to convert the relative intensity (in mol %) into a RGB value that can visually represent the relative units (in mol %). 1) Find the maximum value within all spectra across all compounds. While one could use a separate maximum mol % value for each compound this would not normalize the images to each other. Therefore in this case we choose a value that is either the maximum for all compounds over the entire area sampled. For example in this case the maximum mol % value is 80 (found in spectrum #8 of Compound B). 2) Convert each relative value as shown in Part D step 2 above into a greyscale value (= 255 – 255 * relative units / maximum relative units). In example, for spectrum #1 for Compound A, the greyscale value is 96 where the relative units for this compound 50 mol % and the maximum mol % is 80 (= 255 – 255 * 50 units / 80 units). (F) Imaging position setup: Now that we have greyscale values for each x, y position we can create a 3 x 3 image using these values. Shown here is how each pixel of the box will correspond to the absolute x, y position. (G) Absolute intensity and relative intensity profiles can be generated using the greyscale values for each individual x, y position. These images were generated using Microsoft Excel while images in the manuscript were generated using the LipidImager application using identical principles.
Supplemental Data. Horn et al. (2012). Plant Cell 10.1105/tpc.111.094581
Supplemental Figure 2. Fatty acid composition of total cottonseed lipid extracts. (A) Fatty acid composition of total lipids extracted separately from mature (complete) cotton embryos in addition to hand-dissected embryonic axis and cotyledon tissues. The basecatalyzed, fatty acids methyl esters were analyzed by gas chromatography-mass spectrometry. The inset demonstrates the exclusive localization of cyclic fatty acids in the embryonic axis. Fatty acid abbreviations: myristic (14:0), palmitoleic (16:1), palmitic (16:0), linolenic (18:3), linoleic (18:2), oleic (18:1), stearic (18:0), arachidic (20:0), malvalic (18:1-Cyc), sterculic (19:1-Cyc), dihydrosterculic (19:0-Cyc). (B) Table of results from part (A) presented as mean and standard deviation (StDev) mol % of total seed fatty acids (n = 3 to 4 sample replicates with each replicate representing pooled lipid extracts of 5 to 10 embryos or hand-dissected tissues). A student’s t-test (two-tailed, unpaired) confirms the embryonic axis and cotyledon tissue comprise of significantly different fatty acid compositions.
Supplemental Data. Horn et al. (2012). Plant Cell 10.1105/tpc.111.094581
Supplemental Table 1. Triacylglycerol molecular species analyzed by MALDI-MSI Cross Section (Na+ Adducts)
Measured mean m/z
Measured standard deviation m/z
Mean error of measured vs. theoretical m/z (in ppm)3
+
[M + Na] Theoretical monoisotopic m/z Abbreviated Name
Formula
Adduct(s) +
Common Name1,2
Longitudinal Section (Na+ Adducts)
Measured standard Measured mean m/z deviation m/z
Cross Section (K+ Adducts)
Longitudinal Section (K+ Adducts)
Mean error of measured vs. theoretical m/z (in ppm)3
[M + K] Theoretical monoisotopic m/z
Measured mean m/z
Measured standard deviation m/z
Mean error of measured vs. theoretical m/z (in ppm)3
Measured mean m/z
Measured standard deviation m/z
Mean error of measured vs. theoretical m/z (in 3 ppm)
+
+
TAG-MPL-(14:0/16:0/18:2)
825.695
825.696
0.003
1.0
825.693
0.004
1.6
841.669
841.669
0.006
0.6
841.670
0.010
1.9
TAG-MPO-(14:0/16:0/18:1)
827.710
827.709
0.006
1.2
827.709
0.008
1.7
843.684
843.679
0.011
6.0
843.681
0.014
4.3
TAG-48:2
C51H94O6
Na , K
TAG-48:1
C51H96O6
Na+, K+
C51H98O6
+
Na , K
+
TAG-PPP-(16:0/16:0/16:0)
829.726
829.730
0.004
5.2
829.726
0.005
0.2
845.700
845.697
0.013
3.9
845.702
0.013
1.8
TAG-50:4
C53H94O6
+
Na , K
+
TAG-MLL-(14:0/18:2/18:2)
849.695
849.696
0.002
1.1
849.693
0.004
1.8
865.669
865.666
0.007
2.8
865.677
0.012
9.4
TAG-50:3
C53H96O6
Na+, K+
TAG-MLO-(14:0/18:2/18:1)
851.710
851.712
0.002
2.1
851.710
0.003
0.4
867.684
867.681
0.009
3.9
867.692
0.011
9.0
TAG-50:2
C53H98O6
Na+, K+
TAG-PPL-(16:0/16:0/18:2)
853.726
853.728
0.002
2.0
853.726
0.001
0.7
869.700
869.695
0.006
6.0
869.695
0.005
5.8
TAG-50:1
C53H100O6
Na+, K+
TAG-PPO-(16:0/16:0/18:1)
855.742
855.739
0.003
3.5
855.738
0.003
4.7
871.716
871.715
0.012
0.4
871.714
0.011
1.4
TAG-52:5
C55H96O6
Na+, K+
TAG-48:0
+
TAG-PLLn-(16:0/18:2/18:3)
875.710
875.712
0.002
1.7
875.710
0.003
0.0
891.684
891.676
0.007
9.5
891.699
0.009
16.3
+
TAG-52:4
C55H98O6
Na , K
TAG-PLL-(16:0/18:2/18:2)
877.726
877.728
0.002
2.3
877.725
0.001
0.8
893.700
893.693
0.007
8.1
893.691
0.007
9.9
TAG-52:3
C55H100O6
Na+, K+
TAG-PLO-(16:0/18:2/18:1)
879.742
879.741
0.002
0.4
879.740
0.002
2.3
895.716
895.715
0.013
0.7
895.711
0.011
4.8
TAG-52:2
C55H102O6
Na+, K+
TAG-POO-(16:0/18:1/18:1) > TAG-SLP-(18:0/18:2/16:0)
881.757
881.755
0.003
2.4
881.754
0.003
4.1
897.731
897.735
0.012
4.0
897.729
0.010
2.5
TAG-54:7
C57H96O6
Na+, K+
TAG-LLLn-(18:2/18:2/18:3)
899.710
899.711
0.004
0.5
899.709
0.006
1.4
915.684
915.677
0.009
7.6
915.702
0.004
19.3
TAG-54:6
C57H98O6
Na+, K+
TAG-LLL-(18:2/18:2/18:2)
901.726
901.727
0.002
1.4
901.724
0.001
1.9
917.700
917.691
0.008
9.4
917.689
0.007
11.7
TAG-54:5
C57H100O6
Na+, K+
TAG-LLO-(18:2/18:2/18:1)
903.742
903.742
0.002
0.3
903.739
0.001
2.9
919.716
919.713
0.012
2.6
919.707
0.009
9.1
C57H102O6
+
Na , K
+
TAG-LOO-(18:2/18:1/18:1) > TAG-SLL-(18:0/18:2/18:2)
905.757
905.756
0.002
1.2
905.754
0.002
3.7
921.731
921.735
0.013
3.5
921.728
0.011
3.6
C57H104O6
+
Na , K
+
TAG-OOO-(18:1/18:1/18:1) > TAG-SLO-(18:0/18:2/18:1)
907.773
907.770
0.004
3.7
907.768
0.004
5.3
923.747
923.752
0.011
5.0
923.746
0.010
1.6
TAG-54:2
C57H106O6
+
Na , K
+
TAG-SOO-(18:0/18:1/18:1) > TAG-ALP-(20:0/18:2/16:0) > TAG-SSL-(18:0/18:0/18:2)
909.789
909.783
0.005
6.1
909.783
0.006
6.1
925.763
925.759
0.010
4.1
925.760
0.010
2.8
TAG-54:1
C57H108O6
Na+, K+
TAG-SSO-(18:0/18:0/18:1)
911.804
911.799
0.007
5.5
911.803
0.010
1.4
927.778
927.773
0.011
5.4
927.778
0.011
0.8
TAG-56:4
C59H106O6
Na+, K+
TAG-ALL-(20:0/18:2/18:2)/GLO-(20:1/18:2/18:1)
933.789
933.785
0.004
4.4
933.785
0.007
4.0
949.763
949.761
0.015
1.4
949.765
0.011
2.2
TAG-56:3
C59H108O6
Na+, K+
TAG-54:4 TAG-54:3
TAG-ALO-(20:0/18:2/18:1)
935.804
935.797
0.006
7.7
935.801
0.009
3.4
951.778
951.774
0.013
4.6
951.780
0.012
1.9
C59H110O6
+
Na , K
+
TAG-AOO-(20:0/18:1/18:1)
937.820
937.818
0.006
2.2
937.817
0.010
3.0
953.794
953.792
0.009
2.4
953.793
0.011
0.8
C61H110O6
+
Na , K
+
TAG-BLL-(22:0/18:2/18:2)
961.820
961.821
0.006
1.2
961.819
0.010
1.5
977.794
977.792
0.011
2.0
977.791
0.012
2.7
TAG-53:3-Cyc
C56H100O6
+
Na , K
+
TAG-LScP
891.742
891.739
0.005
3.0
891.739
0.005
2.6
907.716
907.709
0.006
6.9
907.707
0.006
10.1
TAG-53:2-Cyc
C56H102O6
Na+, K+
TAG-LDscP (OScP)
893.757
893.748
0.006
10.3
893.747
0.006
11.4
909.731
909.726
0.008
5.4
909.725
0.004
7.3
TAG-53:1-Cyc
C56H104O6
Na+, K+
TAG-ODScP
895.773
895.764
0.007
9.8
895.762
0.006
12.1
911.747
911.738
0.007
9.4
911.735
0.004
13.6
TAG-55:5-Cyc
C58H100O6
Na+, K+
TAG-LLSc
11.1
TAG-55:4-Cyc
C58H102O6
Na+, K+
TAG-56:2 TAG-58:4
915.742
915.738
0.008
4.3
915.737
0.007
5.2
931.716
931.709
0.007
7.0
931.705
0.006
TAG-LLDsc > OLSc
917.757
917.749
0.007
9.7
917.741
0.004
18.2
933.731
933.725
0.007
6.5
933.725
0.004
7.0
C58H104O6
+
Na , K
+
TAG-LODsc > OOSc
919.773
919.761
0.003
13.4
919.758
0.006
16.1
935.747
935.739
0.008
8.2
935.738
0.004
10.0
TAG-56:5-Cyc
C59H102O6
+
Na , K
+
TAG-LScSc >> LnDScSc
929.757
929.747
0.004
11.7
929.746
0.009
12.2
945.731
945.723
0.010
8.8
945.730
0.011
1.9
TAG-56:4-Cyc
C59H104O6
Na+, K+
LDscSc > LnDscDsc
931.773
931.771
0.008
2.6
931.772
0.010
1.3
947.747
947.754
0.011
7.5
947.749
0.012
1.8
TAG-56:3-Cyc
C59H106O6
Na+, K+
LDscDsc
933.789
933.785
0.004
4.4
933.785
0.007
4.0
949.763
949.761
0.015
1.4
949.765
0.011
2.2
TAG-55:3-Cyc
1
Determined from ESI-MS/MS and literature
2
Fatty Acid Abbreviations: M-14:0 Myristic; P-16:0 palmitic; Po-16:1 palmitoleic, Ln-18:3 linolenic; L-18:2 linoleic; O-18:1 oleic acid; S-18:0 stearic; A-20:0 arachidic; B-22:0 behenic; Sc-19:1 sterculic; Dsc-19:0 dihydrosterculic acid
3
PPM = parts per million; ( |measured mean m/z - theoretical monoisotopic m/z | / theoreticalmonisotopic m/z * 106)
Supplemental Data. Horn et al. (2012). Plant Cell 10.1105/tpc.111.094581
Supplemental Table 2. Phosphatidylcholine molecular species analyzed by MALDI-MSI Cross Section (H+ Adducts)
Common Name 1,2
Formula
Adduct(s)
LysoPC-16:1
C24H48O7PN
+ + + H , Na , K
Measured mean m/z
Measured standard deviation m/z
Mean error of measured vs. theoretical m/z (in 3 ppm)
Measured mean m/z
Measured standard deviation m/z
Mean error of measured vs. theoretical m/z (in ppm)3
[M + K] Theoretical monoisotopic m/z
Measured mean m/z
Measured standard deviation m/z
Cross Section (Na+ Adducts)
Longitudinal Section (Na+ Adducts)
Mean error of measured vs. theoretical m/z (in 3 ppm)
Measured mean m/z
Measured standard deviation m/z
Mean error of measured vs. theoretical m/z (in ppm)3
[M + Na] Theoretical monoisotopic m/z
Measured mean m/z
Measured standard deviation m/z
Mean error of measured vs. theoretical m/z (in 3 ppm)
Measured mean m/z
Measured standard deviation m/z
Mean error of measured vs. theoretical m/z (in ppm)3
+
494.325
494.324
0.002
1.5
494.323
0.009
3.0
532.281
532.280
0.004
1.0
532.279
0.008
3.4
516.307
516.305
0.005
2.4
516.304
0.008
4.6
C24H50O7PN
H , Na , K
PC(16:0/0:0)
496.340
496.340
0.001
1.4
496.338
0.001
3.6
534.296
534.296
0.001
1.2
534.296
0.005
0.6
518.322
518.322
0.001
0.7
518.321
0.005
3.4
LysoPC-18:3
C26H48O7PN
+ + + H , Na , K
PC(18:3/0:0)
518.325
518.322
0.001
5.4
518.321
0.005
6.7
556.281
556.272
0.006
15.1
556.280
0.008
0.9
540.307
540.304
0.007
5.4
540.308
0.007
1.9
LysoPC-18:2
C26H50O7PN
+ + + H , Na , K
PC(18:2/0:0)
520.340
520.340
0.001
1.3
520.338
0.001
3.5
558.296
558.296
0.001
1.2
558.294
0.004
3.2
542.322
542.321
0.001
1.5
542.320
0.004
3.8
+
PC(18:1/0:0)
522.356
522.356
0.001
0.3
522.355
0.001
2.6
560.312
560.312
0.002
0.2
560.310
0.007
3.9
544.338
544.338
0.001
0.2
544.336
0.006
4.0
PC(18:0/0:0)
524.372
524.372
0.002
0.8
524.370
0.005
2.9
562.328
562.330
0.006
3.6
562.329
0.009
3.2
546.354
546.353
0.003
0.3
546.353
0.009
0.1
+
+
+
PC(16:1/0:0)
+
Longitudinal Section (K+ Adducts)
LysoPC-16:0
+
+
Cross Section (K+ Adducts)
[M + H] Theoretical monoisotopic m/z
+
Abbreviated Name
Longitudinal Section (H+ Adducts)
LysoPC-18:1
C26H52O7PN
H , Na , K
LysoPC-18:0
C26H54O7PN
+ + + H , Na , K
PC-32:2
C40H76O8PN
H , Na , K
+
PC(14:0/18:2)
730.539
730.539
0.002
0.2
730.537
0.003
2.2
768.495
768.495
0.002
0.2
768.495
0.007
0.1
752.521
752.519
0.002
1.5
752.517
0.003
4.9
PC-32:1
C40H78O8PN
+ + + H , Na , K
PC(14:0/18:1)
732.554
732.555
0.002
1.0
732.552
0.005
2.5
770.510
770.512
0.003
2.3
770.519
0.007
11.9
754.536
754.536
0.003
0.7
754.533
0.005
4.2
PC-32:0
C40H80O8PN
+ + + H , Na , K
Not Identified
734.570
734.571
0.002
1.0
734.569
0.005
1.7
772.526
772.528
0.002
2.2
772.525
0.007
0.9
756.552
756.555
0.002
3.5
756.552
0.003
0.6
PC-34:3
C42H78O8PN
+ + + H , Na , K
PC(16:0/18:3)
756.554
756.555
0.002
0.3
756.552
0.003
2.5
794.510
794.510
0.002
0.3
794.509
0.007
0.9
778.536
778.536
0.002
0.8
778.535
0.006
2.0
PC-34:2
C42H80O8PN
+ + + H , Na , K
PC(16:0/18:2)
758.570
758.571
0.001
1.4
758.568
0.001
2.2
796.526
796.527
0.001
1.4
796.524
0.001
2.0
780.552
780.553
0.001
2.0
780.551
0.001
1.7
PC-34:1
C42H82O8PN
H , Na , K
PC(16:0/18:1)
760.586
760.585
0.002
1.4
760.584
0.001
2.2
798.542
798.542
0.002
0.2
798.542
0.002
0.0
782.568
782.571
0.002
3.8
782.568
0.001
0.8
PC-35:1-Cyc
C43H82O8PN
+ + + H , Na , K
PC-Cyc-PSc
772.586
772.586
0.001
0.9
772.585
0.004
1.3
810.542
810.544
0.003
2.5
810.540
0.007
2.3
794.568
794.569
0.005
1.9
794.566
0.007
2.3
PC-35:0-Cyc
C43H84O8PN
+ + + H , Na , K
PC-Cyc-PDSc
774.601
774.600
0.004
1.2
774.600
0.006
2.1
812.557
812.559
0.005
2.0
812.557
0.008
0.5
796.583
796.582
0.002
1.8
796.584
0.005
0.4
PC-36:6
C44H76O8PN
+ + + H , Na , K
PC(18:3/18:3)
778.539
778.536
0.002
3.9
778.536
0.006
3.8
816.495
816.493
0.009
2.3
816.493
0.009
1.7
800.521
800.524
0.008
4.5
800.528
0.007
9.4
PC-36:5
C44H78O8PN
+ + + H , Na , K
PC(18:3/18:2)
780.554
780.553
0.001
1.1
780.551
0.001
4.8
818.510
818.510
0.002
0.4
818.511
0.009
0.7
802.536
802.537
0.004
0.3
802.536
0.008
0.2
PC-36:4
C44H80O8PN
H , Na , K
PC-36:3
C44H82O8PN
H , Na , K
PC-36:2 PC-36:1
+
+
+
+
+
+
+
+
PC(18:2/18:2),PC(18:1/18:3)
782.570
782.571
0.002
0.7
782.568
0.001
2.2
820.526
820.527
0.001
0.9
820.524
0.001
2.1
804.552
804.553
0.001
1.1
804.550
0.001
2.0
+
+
+
PC(18:1/18:2),PC(18:0/18:3)
784.586
784.586
0.002
0.1
784.584
0.001
1.9
822.542
822.541
0.001
0.1
822.541
0.001
0.9
806.568
806.567
0.003
0.9
806.566
0.001
2.0
C44H84O8PN
+ + + H , Na , K
PC(18:0/18:2),PC(18:1/18:1)
786.601
786.600
0.002
1.2
786.600
0.001
2.2
824.557
824.557
0.002
0.0
824.557
0.002
0.2
808.583
808.582
0.003
2.0
808.581
0.002
2.3
C44H86O8PN
H , Na , K
+
+
+
PC(18:1/18:0)
788.617
788.612
0.002
5.7
788.612
0.004
6.1
826.573
826.569
0.004
4.1
826.570
0.006
3.7
810.599
810.596
0.004
3.4
810.595
0.005
4.2
+
+
+
PC-Cyc-LSc
796.586
796.582
0.002
4.8
796.584
0.005
2.1
834.542
834.542
0.003
0.5
834.540
0.007
1.5
818.568
818.568
0.004
0.2
818.569
0.008
2.2
+
+
+
PC-Cyc-LDsc,OSc
798.601
798.597
0.003
5.2
798.599
0.004
2.3
836.557
836.557
0.003
0.3
836.556
0.005
1.6
820.583
820.580
0.011
4.0
820.583
0.006
0.5 1.9
PC-37:3-Cyc
C45H82O8PN
H , Na , K
PC-37:2-Cyc
C45H84O8PN
H , Na , K
PC-37:1-Cyc
C45H86O8PN
+ + + H , Na , K
PC-Cyc-ODsc
800.617
800.614
0.004
4.2
800.615
0.005
2.4
838.573
838.574
0.005
1.3
838.572
0.007
1.5
822.599
822.597
0.007
2.3
822.597
0.008
PC-38:4/PC-38:2-Cyc
C46H84O8PN
+ + + H , Na , K
PC(20:1/18:3), PC(20:2/18:2), PC-Cyc-ScSc
810.601
810.596
0.004
6.3
810.596
0.005
6.7
848.557
848.555
0.008
2.4
848.552
0.007
6.4
832.583
832.572
0.003
13.7
832.583
0.008
PC-38:3/PC-38:1-Cyc
C46H86O8PN
+ + + H , Na , K
PC(20:1/18:2), PC(20:0/18:3), PC-Cyc-ScDsc
812.617
812.617
0.005
0.3
812.617
0.007
0.1
850.573
850.573
0.004
0.1
850.576
0.007
3.3
834.599
834.600
0.007
0.8
834.600
0.010
1.9
PC-38:2/PC-38:0-Cyc
C46H88O8PN
+ + + H , Na , K
Not Identified ,PC-Cyc-DscDsc
814.633
814.632
0.002
0.3
814.631
0.005
2.1
852.588
852.589
0.003
0.2
852.586
0.009
3.3
836.615
836.616
0.004
1.5
836.616
0.007
1.2
1
Determined from ESI-MS/MS and literature
2
Fatty Acid Abbreviations: M-14:0 Myristic; P-16:0 palmitic; Po-16:1 palmitoleic, Ln-18:3 linolenic; L-18:2 linoleic; O-18:1 oleic acid; S-18:0 stearic; A-20:0 arachidic; B-22:0 behenic; Sc-19:1 sterculic; Dsc-19:0 dihydrosterculic acid
3
PPM = parts per million; ( |measured meanm/z - theoretical monoisotopic m/z | / theoreticalmonisotopic m/z * 106)
0.8
Supplemental Data. Horn et al. (2012). Plant Cell 10.1105/tpc.111.094581
Supplemental Table 3. Phosphatidylethanolamine molecular species analyzed by MALDI-MSI Cross Section (H+ Adducts)
Common Name 1,2
Formula
Adduct(s)
LysoPE-16:0
C21H44O7PN
+ + + H , K , Na
Measured mean m/z
Measured standard deviation m/z
Mean error of measured vs. theoretical m/z (in 3 ppm)
Measured mean m/z
Measured standard deviation m/z
Mean error of measured vs. theoretical m/z (in ppm)3
[M + K] Theoretical monoisotopic m/z
Measured mean m/z
Measured standard deviation m/z
Cross Section (Na+ Adducts)
Longitudinal Section (Na+ Adducts)
Mean error of measured vs. theoretical m/z (in 3 ppm)
Measured mean m/z
Measured standard deviation m/z
Mean error of measured vs. theoretical m/z (in ppm)3
[M + Na] Theoretical monoisotopic m/z
Measured mean m/z
Measured standard deviation m/z
Mean error of measured vs. theoretical m/z (in 3 ppm)
Measured mean m/z
Measured standard deviation m/z
Mean error of measured vs. theoretical m/z (in ppm)3
+
454.293
454.297
0.006
7.3
454.292
0.009
3.4
492.249
492.247
0.007
3.8
492.249
0.011
1.2
476.275
476.275
0.005
1.2
476.274
0.011
2.2
C23H42O7PN
H , K , Na
PE(18:3/0:0)
476.278
476.275
0.005
5.4
476.277
0.012
2.2
514.234
514.226
0.009
14.9
514.229
0.012
9.5
498.260
498.256
0.009
6.7
498.262
0.011
4.6
LysoPE-18:2
C23H44O7PN
+ + + H , K , Na
PE(18:2/0:0)
478.293
478.293
0.002
1.0
478.292
0.008
2.3
516.249
516.248
0.007
1.5
516.248
0.012
1.7
500.275
500.275
0.004
1.5
500.275
0.013
1.5
LysoPE-18:1
C23H46O7PN
+ + + H , K , Na
PE(18:1/0:0)
480.309
480.309
0.007
0.8
480.309
0.011
1.0
518.265
518.270
0.012
10.4
518.263
0.012
3.9
502.291
502.294
0.011
6.4
502.292
0.011
2.8
+
PE(18:2/16:0)
716.523
716.523
0.001
0.3
716.521
0.002
2.3
754.479
754.480
0.001
1.3
754.477
0.002
1.9
738.505
738.505
0.001
0.3
738.504
0.002
2.0
PE(18:1/16:0)
718.539
718.536
0.006
4.4
718.536
0.007
4.1
756.495
756.493
0.008
1.9
756.493
0.008
1.8
740.521
740.524
0.002
4.1
740.522
0.003
1.3
+
+
+
PE(16:0/0:0)
+
Longitudinal Section (K+ Adducts)
LysoPE-18:3
+
+
Cross Section (K+ Adducts)
[M + H] Theoretical monoisotopic m/z
+
Abbreviated Name
Longitudinal Section (H+ Adducts)
PE-34:2
C39H74O8PN
H , K , Na
PE-34:1
C39H76O8PN
+ + + H , K , Na
PE-36:5
C41H72O8PN
H , K , Na
+
PE(18:3/18:2)
738.507
738.505
0.002
3.0
738.504
0.002
5.2
776.463
776.462
0.002
1.5
776.460
0.004
4.7
760.489
760.489
0.002
0.4
760.486
0.005
3.8
PE-36:4
C41H74O8PN
+ + + H , K , Na
PE(18:2/18:2)
740.523
740.524
0.002
0.8
740.522
0.003
1.9
778.479
778.480
0.001
1.7
778.477
0.003
1.9
762.505
762.505
0.002
0.2
762.503
0.003
2.1
PE-36:3
C41H76O8PN
+ + + H , K , Na
PE(18:2/18:1)
742.539
742.539
0.004
0.4
742.537
0.006
1.9
780.495
780.500
0.004
6.7
780.493
0.005
1.5
764.521
764.519
0.003
1.5
764.519
0.006
2.4
PE-36:2
C41H78O8PN
+ + + H , K , Na
PE(18:1/18:1, 18:2/18:0)
744.554
744.555
0.004
0.9
744.552
0.009
3.6
782.510
782.518
0.007
10.2
782.511
0.011
1.2
766.536
766.536
0.006
0.1
766.534
0.010
2.8
PE-36:1
C41H80O8PN
+ + + H , K , Na
PE(18:1/18:0)
746.570
746.572
0.007
2.6
746.573
0.013
3.7
784.526
784.532
0.005
7.6
784.524
0.011
2.2
768.552
768.554
0.005
2.7
768.550
0.011
2.7
1
+
+
Determined from ESI-MS/MS and literature
2
Fatty Acid Abbreviations: M-14:0 Myristic; P-16:0 palmitic; Po-16:1 palmitoleic, Ln-18:3 linolenic; L-18:2 linoleic; O-18:1 oleic acid; S-18:0 stearic; A-20:0 arachidic; B-22:0 behenic; Sc-19:1 sterculic; Dsc-19:0 dihydrosterculic acid
3
PPM = parts per million; ( |measured meanm/z - theoretical monoisotopic m/z | / theoreticalmonisotopic m/z * 106)
Supplemental Data. Horn et al. (2012). Plant Cell 10.1105/tpc.111.094581
Supplemental Table 4. Phosphatidic acid molecular species analyzed by MALDI-MSI + Cross Section (Na Adducts)
[M + Na] Theoretical monoisotopic m/z
Measured mean m/z
Measured standard deviation m/z
Mean error of measured vs. theoretical m/z (in ppm)3
+
Abbreviated Name
Formula
Adduct(s) +
PA(16:0/18:3)
PA-34:3
C37H67O8P
K , Na
PA-34:2
C37H69O8P
K+, Na+
PA-34:1
C37H71O8P
Common Name1,2
+
Longitudinal Section (Na+ Adducts)
Measured standard Measured mean m/z deviation m/z
Cross Section (K+ Adducts)
Longitudinal Section (K+ Adducts)
Mean error of measured vs. theoretical m/z (in ppm)3
[M + K] Theoretical monoisotopic m/z
Measured mean m/z
Measured standard deviation m/z
Mean error of measured vs. theoretical m/z (in ppm)3
Measured mean m/z
Measured standard deviation m/z
Mean error of measured vs. theoretical m/z (in 3 ppm)
+
693.447
693.447
0.005
0.5
693.448
0.010
0.6
709.421
709.421
0.003
0.4
709.422
0.011
0.7
PA(16:0/18:2)
695.463
695.463
0.002
0.6
695.461
0.002
2.1
711.437
711.437
0.002
0.9
711.435
0.002
2.0
+
+
PA(16:0/18:1)
697.478
697.479
0.004
0.9
697.477
0.008
1.5
713.452
713.455
0.003
4.1
713.451
0.008
2.2
+
+
PA(18:3/18:2)
717.447
717.446
0.003
2.1
717.445
0.006
3.6
733.421
733.420
0.002
1.3
733.418
0.006
3.7
K , Na
PA-36:5
C39H67O8P
K , Na
PA-36:4
C39H69O8P
K+, Na+
PA(18:2/18:2)
719.463
719.463
0.002
0.1
719.461
0.003
2.3
735.437
735.437
0.001
1.0
735.435
0.003
2.1
PA-36:3
C39H71O8P
K+, Na+
PA(18:2/18:1)
721.478
721.479
0.001
0.6
721.477
0.002
2.2
737.452
737.453
0.001
1.0
737.451
0.001
1.9
PA-36:2
C39H73O8P
K+, Na+
PA(18:1/18:1,18:2/18:0)
723.494
723.495
0.002
0.8
723.493
0.003
1.8
739.468
739.470
0.002
2.9
739.468
0.003
0.5
1
Determined from ESI-MS/MS and literature
2
Fatty Acid Abbreviations: M-14:0 Myristic; P-16:0 palmitic; Po-16:1 palmitoleic, Ln-18:3 linolenic; L-18:2 linoleic; O-18:1 oleic acid; S-18:0 stearic; A-20:0 arachidic; B-22:0 behenic; Sc-19:1 sterculic; Dsc-19:0 dihydrosterculic acid
3
PPM = parts per million; ( |measured mean m/z - theoretical monoisotopic m/z | / theoreticalmonisotopic m/z * 106)
Spatial Mapping of Lipids at Cellular Resolution in Embryos of Cotton Patrick J. Horn, Andrew R. Korte, Purnima B. Neogi, Ebony Love, Johannes Fuchs, Kerstin Strupat, Ljudmilla Borisjuk, Vladimir Shulaev, Young-Jin Lee and Kent D. Chapman Plant Cell 2012;24;622-636; originally published online February 14, 2012; DOI 10.1105/tpc.111.094581 This information is current as of May 25, 2012 Supplemental Data
http://www.plantcell.org/content/suppl/2012/02/13/tpc.111.094581.DC1.html http://www.plantcell.org/content/suppl/2012/02/13/tpc.111.094581.DC2.html
References
This article cites 59 articles, 13 of which can be accessed free at: http://www.plantcell.org/content/24/2/622.full.html#ref-list-1
Permissions
https://www.copyright.com/ccc/openurl.do?sid=pd_hw1532298X&issn=1532298X&WT.mc_id=pd_hw1532298X
eTOCs
Sign up for eTOCs at: http://www.plantcell.org/cgi/alerts/ctmain
CiteTrack Alerts
Sign up for CiteTrack Alerts at: http://www.plantcell.org/cgi/alerts/ctmain
Subscription Information
Subscription Information for The Plant Cell and Plant Physiology is available at: http://www.aspb.org/publications/subscriptions.cfm
© American Society of Plant Biologists ADVANCING THE SCIENCE OF PLANT BIOLOGY