~f~nsoctions in GtS, 1997, 4.2, no.
I, p. 73
Spatial understanding and decision support system: A prototype for public GIS PIOTR JANKOWSKI AND MILOSZ STASIK Department of Geography, University of Idaho, Moscow, Idaho 83843, USA. e-mail:
[email protected]
The idea of public participation GIS involves the use of GIS tools to help laypcople understand the spatial consequences of proposed projects, evaluate alternatives, and create new solutions. The widening use of information networks creates opportunities for making GIS a widely accessible decision-making tool, bypassing the constraints of location and time. This paper presents a prototype software that enables group collaboration across space and time using the Internet infrastructure. The prototype, called Spatial Understanding and Decision Support System (SUDSS), was designed to facilitate a controlled experiment in collaborative group work aimed at solving a realistic land-use planning problem. The paper discusses design considerations for a distributed public GIS and presents the functionality of SUDSS using the example of group participation in developing a land-use zoning plan.
1 introduction Public participation in local decision making has been advocated and practised in the democratic societies for a long time, albeit with mixed results. In the USA a popular venue for public participation has been town meetings. Meetings, by far the most popular form of intellectual group activity, suffer from many inherent problems, including overemphasis on social-emotional rather than task activities, failure to define adequately a problem before rushing to judgement, and the feeling of disconnection/alienation from the meeting (Nunamaker et a1 1993). Other problems hampering the effectiveness of meetings include: diversion from the subject, excessive length, failure to reach conclusion, poor organization, lack of goals or agenda, dominance by certain individuals, ineffective decision making, and rambling, redundant, or digressive discussion (Mosvick and Nelson 1987). Public/town meetings share these characteristics and yet there is a growing trend towards increasing public involvement in decisionmaking. Public participation in solving local 1361-1682/97/2-01-073
0 Pearson Professional Limited 1997
problems has its roots in the increasing influence of local initiatives, diminishing role of central government, ever more complex public policy, and the growing public awareness of local issues that affect quality of life in general. There is also a strong theoretical rationale for public participation in the decision making as the most important group behaviour (Poole and Roth 1989; Zey 1992). Research into developing methods of more effective public participation in decision making thus appears to be a fruitful direction of enquiry and one which addresses a relevant issue in a democratic society. Many issues involving public participation in decision making are shaped by geographic realities of location. Examples of such problems include not-in-my-back-yard (NIMBY) controversies such as landfill and hazardous waste facility siting (Couclelis and Monmonier 1 9 9 9 , polluted urban land use (so-called brownfield) developments (Buonicore 1996), and environmental restoration projects (Jankowski et al 1997). The spatial character of information about these problems creates special requirements for data presentation,
73
P Jankowski and M Stosik manipulation, and analysis tools. Many of these tools can be found in modern GIS software. This realization has led to recent interest in collaborative spatial decision making (CSDM) and public GIs, also called GIS 2 (Densham et al 1995). The ideas behind CSDM and GIS 2 involve the development and use of tools supporting both experts and laypeople in understanding the spatial consequences of locally important problems, developing alternative solutions to these problems, and resolving problems by choosing a consensual solution.
A model of public decision-making process that can be adopted to guide the development of public GIS is in principle no different from the three-phase model proposed by Simon and Associates (1992). According to Simon, decision making involves intelligence (argumentationldiscussion), design (structuring of decision problem), and choice (analysis and problem closure). The model of public participation in decision making, adopted in this paper, interlaces these three phases of decision making with social interaction. Nyerges and Jankowski (1 997) distinguished three forms of social interaction involved in group work collaboration, co-ordination, and co-operation. Collaboration occurs when participants agree to work on the same task. Co-operation takes place when participants agree to work on different tasks and share results. Co-ordination involves sequencing the results of co-operative work. We posit that all three forms can occur during public involvement in decision making. Hence, public GIS should provide an integrated work environment to support the participation of interested citizens in collaboration, co-ordination, and co-operation, transcending a recursive mesh of intelligence, design, and choice. A prototype public GIS called Spatial Understanding and Decision Support System (SUDSS), designed to accommodate public participation in the decision-malung process, is discussed in the remainder of this paper. In Section 2 we discuss several design considerations for a public GIS working in distributed space and time. SUDSS capabilities are presented in Section 3 using a land-use zoning problem. We conclude with a discussion of unresolved issues and prospects for future development.
74
2 Design considerations for public GIS under distributed space and time conditions The idea of public GIs, encompassing collaborative spatial decision making, comes from many divergent sources. They include critiques of GIS as a construction of positivist thinking constraining alternative views of reality that otherwise might broaden the decision-making discourse (Lake 1993; Sheppard 1995), work on GIS extensions aimed at improving its decision support capabilities (Densham 1991), and work on group support systems technology as well as theoretical and empirical studies of its use (Jessup and Valacich 1993). These sources bring various viewpoints of decision making that can be generalized as a collaborative and decision analytical approach. This collaborative approach views decision making as an evolutionary process that progresses from an unstructured discourse to a problem resolution (using discussion, argumentation, and voting). The analytical approach uses mathematical models to analyse structured parts of the decision problem leaving the unstructured parts for the decision makers’ judgement. We argue that both approaches are needed in public GIS and that in order to support effectively public participation in decision malung, collaboration and decision analysis tools must be integrated (Bhargava et a1 1994).
2.1 Software design considerations Our goal in developing a prototype for public GIS is to allow the use of software at different locations and at different times (distributed space and time) by people interested in local decision making. Public GIS is not intended to supersede the existing mechanisms of public involvement but to broaden them by creating new possibilities of participation. Many local decision making problems in a geographic domain deal with site selection and land-use allocation. These locational problems often instigate conflict because of differences in people’s values, motives, and/or perspectives about what is to be accomplished. In such situations, shared decision making is a fundamental concern in coming to consensus about choices to be made. Public meetings often restrict shared decision making because they do not facilitate creative exploration of potential solution options and limit
SUOSS: A prdoj.pe R6c public GIs people’s possibilities of participation. Hence, the basic functional requirement of public GIs software is to provide tools for enhanced citizen participation in locational problem solving and decision making. More specifically, the following requirements can be formulated:
1 The software should facilitate problem understanding allowing lay users to grasp the problem’s nature and help them formulate solutions.
2 The software should offer decisional guidance to users in the form of a problem-solving agenda, listing five major steps used in a decision choice problem: (a) problem exploration; (b) criteria selection; (c) criteria prioritization; (d) alternative evaluation; and (e) problem solution negotiations.
3 The system should be comprehensive within the realm of a locational decision problem, and thus offer a number of decision space exploration tools and evaluation techniques.
4 The interface should be both process-oriented and data-oriented allowing an equally easy access to task-solving techniques as well as maps and data visualization tools.
5 The software should support space- and timedistributed decision-making process participation by facilitating information exchange among citizens, electronic submission of solution options, and voting through the Internet. Different strategies of designing public GIs can be considered. While some are focused on a traditional development strategy based on standalone software, others are aimed at taking advantage of new, yet already widely accepted tools like the Internet. SUDSS is a software embracing both approaches. It is a separate tool, running as a traditional, stand-alone software that is fully Internet aware. It relies on the Internet network infrastructure without needing to use restrictive communication tools. The use of the Internet infrastructure is an inexpensive way to enable the use of public G I s across space and time. This may be accomplished by integrating GIs applications with the World-Wide Web (WWW) browsing software. Depending on how data is managed,
either a Web server or client s o h a r e (Web browser) is an active party in such an approach. In the first case, a Web server responds to a set of commands or queries that are sent from a user via client software. In the second case, a server acts as a passive data repository while a client software manages spatial data. There are two approaches that one can consider when designing the integration of GIS tools with Internet tools (Web server and Web browser). First, from the client software perspective (Web browser), an application may work as an applet (miniapplication) written in the Java programming language. Java applets are precompiled, working ‘inside’ a Web document, and provide enhancements to a static Web page content. Unfortunately, this approach does not provide effective means for GIS implementation. If an applet is downloaded from a Web server with the rest of the page content its security features prevent it from reading and writing to a file on the client’s computer. This very limitation hinders any serious implementation of GIs functions using Java applets as G I s data would have to be shipped back to the server every time the user needed to save data. This in turn would degrade the software performance and increase the chance of data loss through network failure. Another problem with Java is that although it is said to be a platform-independent, highly efficient programming language, in reality Java applets work well under higher end operating systems (e.g. Windows NT, Unix). Under a lowend operating system such as Windows 3.11, still being used on a number of personal compuers, large applets are inefficient, slow, and sometimes do not work at all. An alternative solution to the above problems involves creating a G I s software that functions like a Web browser component. Examples include numerous plug-ins to the Netscape Navigator Web browser. A plug-in is an independent program that works in the frame of a browser, placing itself between a browser and data to be accessed. A fundamental difference between a plug-in and a Java applet lies in how they are accessed by the user. A plug-in must be initially downloaded from a server to the user machine’s hard disk after which it is accessed from the hard disk. This enables a plug-in to access other files on the hard disk. A Java applet, in contrast to a plug-in, is loaded every time from a
75
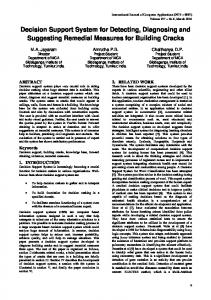
P Junkowski and M Skr~ik server and it exists only in the context of a specific Web page that uses it. The advantage of the plug-in solution over the Java applet is that in the case of complex software, such as GIs, the user does not have to send data manually to an external program. The Web browser does it automatically. Although a design of public GIS based on Web browser and plug-in architecture seems to be a promising solution, it is not free of limitations either. The most severe is the dependence on a Web browser software. A plug-in must be implemented specifically for a given Web browser. This means that there would have to be a separate plug-in for Netscape Navigator and for MS Explorer. If a new version of browser software becomes available, a plug-in must be updated. Restrictions on sending a large volume of data from a Web browser pose another limitation. At the time of writing, the best way to provide an easy-to-use, fast, and efficient prototype of public GIS is to create an independent, specialized software. The SUDDS prototype architecture is presented in Figure 1. SUDSS is based on a server-client architecture. The server component, working under the Windows N T 4.0 operating system, assumes the database management tasks. The client (user) component, working under the Windows 95
Oata Securitv Module verhes user identity venfies user status validates user input -1
,I
operating system, is a stand-alone application which communicates with the database on the server. The choice of the Windows 95 operating system for the client component was dictated by the functional capabilities of the 32-bit operating system and better application programming interface (AN) than under Windows 3.11. The higher-end operating system Windows 95 is already used in 30 percent of all personal computers in the USA. The data exchange between the SUDSS client software and SUDSS server is solely based on the TCP/IP protocol. TCP/IP-based communication provides a reliable client-server connectivity using a packet-switched data transmission. A potential weakness of the protocol comes from the fact that it may operate on top of lower level, less reliable protocols. This may present a problem in case of multi-media transmission (especially live). However, the TCPlIP service was sufficient for the SUDSS prototype that is discussed below.
2.2 Software implementation The SUDSS prototype was implemented using Microsoft Ksual Basic 4.0 Professional programming language and several third-party software, including Environmental Systems Research Institute’s Map Objects and Microsoft’s Internet Controls (beta version). Map Objects, a library of OLE-compliant
-.
~
Communication Modrile WWW serve) *Mail Server *News Server
--
,
/-
/---
/-
Data Maiiarietnent Modtile gets user data distributes projects calculates results
gets voting results
Figure 1. Design architecture of SUDSS.
76
SUDSS: A pmfojlpe for public GIs objects that can be interfaced with the Visual Basic or C++ programming languages, was used to allow the implementation of several GIS fimctions within the SUDSS prototype without needing to link SUDSS with a GIS software package. Using Map Objects helped to provide map display, editing capabilities, and database access while keeping the size of SUDSS relatively small. Microsoft Internet Controls eased the development process by allowing the use of Windows 95 sockets and access to network protocols. The use of Internet Controls significantly reduced the amount of code necessary to implement the network access. In addition, Internet Controls provide easy access to other network tools which may be used to extend the software functionality. The selection of this programming environment was influenced by the ease and speed of programming and high flexibility of development during the software prototyping stage. Since SUDSS is a prototype, frequent changes of user interface favoured a tool that would allow making such changes in a short time with minimal programming effort.
3 Overview of SUDSS capabilities In this section we describe the capabilities of SUDSS in the context of a group-work experiment with the use of the software. The experiment was conducted in the spring of 1997 at the University of Idaho, and involved student participants in a realistic situation of designing, evaluating, and voting on alternatives for the Latah County landuse zoning plan. The results of the experiment will be described in a separate paper. More information about the experiment can be found at the Web address: http://geogstu2.mines. uidaho. edu Earlier applications of group-work software including GIS and visualization tools have used the technology in various realistic decision situations involving decision makers (Faber et al 1994, 1995). Such an approach, though providing a good verification environment, is difficult to control and therefore makes it difficult to experiment with the s o h a r e . We have taken a different approach, developing first a prototype and using it as an experimental research tool, and then learning from the experiment and using the results to develop a production software.
3.1 Workflow scenario The experiment involved 50 students from the campus of the University of Idaho in Moscow, Idaho. Students are recruited through advertisements posted on campus and on the Internet. The criteria of participation include a basic familiarity with the use of personal computers running the MS Windows operating system and an interest in local land-use planning issues. Latah County in Northern Idaho has just undergone a process of developing a new comprehensive land-use zoning plan and the issue of land-use planning has received much publicity in the community. In order to participate in the experiment, every participant is assigned to an experimental decision group. Each group is an independent unit that deals with the problem without outside help. The experiment consists of four steps. Each step involves a different activity and allows the participants to focus on a different aspect of the decision-making process. The first step, data acquisition, allows the participant to develop an in-depth understanding of the land-use zoning problem and helps to explore constraints that should be taken into account when developing a land-use zoning plan. This step provides the participant with sufficient information, necessary to develop hislher own land-use zoning plan. Data provided to experiment participants are concerned with the Latah County land-use zoning plan. The data are intended to provide necessary information for developing a meaningful land-use zoning proposal in the form of map. The discussion of the present situation, planning constraints, and assumptions are provided to enable participants to engage fully in the design process. Each group is given three days to complete the first step and the following three steps of the task involving: creating individual land-use zoning plans, evaluating plans created by group members, and voting and submitting the group’s favourite land-use zoning plan. The three-day time-interval to complete the task is partially structured in that participants face some deadlines. During the first 24 hours each participant, working separately, is expected to create a map depicting an individual proposal for the county zoning plan. The actual time spent on creating the map in most cases does not exceed four hours, but participants have the flexibility of choosing the time of work during the
77
P Janbowsk; and M Sfosik 24-hour interval. The 24-hour interval allocated to the first two steps (data acquisition and proposal preparation) gives participants the comfort of individual work place and time. All participants are asked to create a zoning map based on individual interpretations of planning objectives and information provided in the first step of the experiment. Each participant has to designate three zones for land use: productive land (agriculture and forestry), low density residential, and commercial/ industrial/high density residential. All necessary tools to create a map are provided in the SUDSS s o h a r e . Participants are not limited to any specific areas or shapes of zones, nor are they prevented from creating discontinuous or scattered zone patterns. At the beginning of the task participants are asked to download from the server the SUDSS Figure 2. Main user interface window of SUDSS with software and data and store them on their personal tool buttons. computers or network accounts. In order to start using the software the participant must provide hislher user id and a password.
Figure 3. One visualization function offered in the Exploration tool is the split map window to facilitate the painvise comparison of maps. The map on the left shows a land-use map for Latah County while the map on the right shows watercourses in the county.
78
SUDSS: A p-
f;K p d k GtS
(left) Figure 4. The canvas of land-use map together with the land-use zone designation buttons are used to delineate new landuse zone boundaries. The buttons represent the following land-use categories: industrial/ commercial/high density residential (I/C/R), low density residential (Low-Den-Res), agriculturally productive land (Productive), and currently unspecified (Not Set).
(below) Figure 5. The Communication Chest window provides the necessary functions to synchronize timers, submit, and receive data.
3.2 Sohare tools A logical place to begin working with SUDSS is the Exploration button in the main menu (Figure 2), which opens the SUDSS Explore! window. The window offers a minimum number of necessary tools, represented by tool buttons, to create a map representation of the land-use zoning plan. The user can see plans created by other users but can edit only hidher plan. Line and polygon drawing tools are provided for the on-screen delineation of landuse zone boundaries. Since users are supposed to create polygon-shaped zones, a point tool was deemed to be unnecessary. In addition, users are provided with a typical set of tools to navigate within the map. These tools display the full extent of map, zoom-in, zoom-out, pan the map, and split the map window into a double map mode facilitating the viewing of two maps (Figure 3). Additionally, there is a tool which can be used to manage the display of maps. The selection of a land-use zone is controlled by the set of buttons which allow users to select one of three land-use zones to be drawn on the map canvas (Figure 4). In order to make the drawing process easier and facilitate the computation of the quality appraisal score for a zoning plan, the boundary lines of land-
use zones are automatically snapped to a grid. The grid is comprised of the quarter sections of the Public Land Survey System (PLSS) and overlaps with the map drawing canvas. Once the zoning plans are completed the participants are asked to submit them to the server which plays the role of group communication centre and plan repository. In order to submit a plan, the user has to select the Communication button in the SUDSS main window (Figure 2). The button’s action opens up the SUDSS Communication Chest window (Figure 5 ) .
79
P /unCavski and M Stosik
Figure 6. Working in the evaluation window the user can select evaluation criteria (lower left quadrant), assign criterion weights to the selected evaluation criteria (upper left quadrant), select alternative land-use zoning plans to be ranked (lower right quadrant), and view the ranking results (upper right quadrant). T h e names in the lower right quadrant represent the names of zoning plan alternatives. The names ‘alternative’ and ‘proposition’ are synonymous and denote a land-use zoning plan.
The buttons in this window perform a series of activities related to the server. Here the user can synchronize timers between hidher computer and the experiment server. The synchronization is necessary in order to receive an accurate reading of the time remaining to finish the task, submit the user’s plan to the server, and download from the server plans created by other group members. After the user has submitted a zoning plan, a button to download data with plans created by others is activated. The user can download alternative plans and compare them with hidher own plan. Once the plan is submitted to the server, however, the user cannot change it. The above activities comprise the first two steps of the experiment. During the third step the alternative plans can be evaluated both visually and quantitatively. A
quantitative evaluarion measures the performance of every plan on a number of evaluation criteria by expressing it in one summary score. The score, also called a final appraisal score, can be used to order alternative plans from best to worst. The basis for computing the score for each plan are evaluation criteria. One can think of evaluation criteria as the operational objectives of a comprehensive land-use plan. Each alternative plan receives a value representing its performance on every evaluation criterion. These values are computed automatically by SUDSS and their outcomes are affected by how well location and shape of land-use zones delineated by the user satisfies a given criterion. For example, the value of criterion ‘Compactness of area’ measures how well land-use zones compare with the ideal compact zone shape - in this case a square.
SUDSS: A plprcdype Ibr public G1s The more complex the boundary of a zone, the worse the value received by a given plan on the criterion ‘Compactness of area’. In order to calculate a final score for the entire plan, individual criterion scores are multiplied by weights representing the relative importance of each criterion. Finally, products of criterion values and weights are summarized. The sum of products yields the final appraisal score for the plan. Even though all computations involved in the evaluation of the zoning plan are carried out transparently by SUDSS, each user has to initiate the process by selecting the Evaluation button from the SUDSS main window (Figure 2). This action opens the SUDSS Evaluate! window (Figure 6). T h e upper left quadrant of the window provides sliders corresponding to the evaluation criteria. Users can move the sliders to select a weight for each criterion. Each weight represents a relative importance assigned to a given criterion. The weight sliders implement a simple technique of criterion preference elicitation called rating (Voogd 1983). This technique allows the user to assign weights explicitly to each criterion by redistributing 100 points, which is the sum of all weights. Since
the technique requires that all 100 points be allocated the software guarantees that this result will be achieved. If the user fails to allocate all 100 points the software will allocate the balance dividing the remaining points equally among the evaluation criteria. The user also controls which criteria to include in plan evaluation by checking the square boxes next to criteria names in the lower left quadrant of the Evaluate! window. Experiment participants have another 24 hours, following plan development, to complete the zoning plan evaluation. In practice, half an hour is usually enough to determine the best criteria weight settings and to select the winning plan. An important component of collaborative work is the fair evaluation of all plans developed by group members. Each group member can evaluate alternative plans, including hidher plan. Nothing obviously prevents the participants from tinkering with criterion weights and ultimately the results of the evaluation. A participant determined to put hidher plan at the top of ranking can do it without examining the reason why a different plan may be better than hidher alternative. Suppressing this possibility would force the participants to behave entirely ‘rationally’ which obviously is not always the case in decision making (Kahneman et 1986). Decision support tools built in SUDSS provide the participants with information and guidance to make rational choices. It is entirely up to participants whether or not they choose to do so. The results of individual evaluations are aggregated by way of participant voting during the final 24-hour period. Voting on the ranking of alternative
Figure 7. The Vote window allows the user to submit votes on evaluation criteria (which evaluation criteria should be used) and order of alternatives (land-use plans).
81
P Jankavsk;and M Stasik
Figure 8. The Results of Voting window provides the statistics about the frequency of votes on criteria (upper part) and the order of voted alternatives along with the measure of variance (lower part). The names ‘alternative’and ‘proposition’ are synonymous and denote a land-use zoning plan. land-use zoning plans is carried out with the Vote button in the SUDSS main window. The vote function allows the participant to submit the ranking of alternatives to the experiment server (Figure 7). Voting results can be visualized by the participants after downloading them from the server (Figure 8). The voting results are calculated by a rankedvote technique. The ranked-vote technique assigns ranks to alternatives based on the following rationale: the higher position of an alternative plan on the voter’s list the higher the rank assigned. The voting position of an alternative is determined by adding the ranks for each alternative from every voter using the Borda social preference function (Hwang and Lin 1987). This type of vote aggregation prevents a contentious candidate who ranks very high with some group members and very
low with others from winning, and promotes a consensus candidate. In the example of voting results presented in Figure 8, four out of five evaluation criteria were selected by a group. One can see this outcome in the top part of Figure 8 (Frequency of Criteria Selection) where four out of five criteria received the frequency of 1 . Looking at the lower part of Figure 8 (Order of Alternatives) one can notice that alternative 1 received the highest score based o n the ranked vote followed by proposition 1 and alternative 2 . The measure of variation divided into three intervals informs about the degree of unanimity in voting for a specific alternative or the lack thereof. Alternative 1 is clearly the favourite by not only having received the highest score but also high agreement among the voters. Ideally, a consensual zoning plan emerges from
SUDSS. A prototype for public GI5 voting as described in the example presented in Figure 8. In some groups, however, this may not be the case. In these instances group members may engage in a discussion arguing the merits of one’s favourite plan and trying to persuade others to change positions and ultimately voting results. Each group has its private news group, implemented in SUDSS, to communicate and negotiate. In this brief tour of SUDSS, we demonstrated the software functionality on the example of experiment with space- and time-distributed public participation in land-use planning. SUDSS is still in the stage of prototyping and will undergo additional experiments involving groups of stakeholders.
0
self updating software capability built-in user communication tools such as discussion groups and chat forums.
SUDSS may also include more sophisticated elements of network tools including real-time conferencing and video-conferencing shared data editing. This enhancement, however, will almost certainly require the use of a dedicated network line such as ISDN.
Acknowledgement This research has been supported by SRGP grant No. S 97-018 from the Idaho State Board of Education. The support is gratefully acknowledged.
4 Conclusions The idea of public GIS empowering communities to participate in the decision making concerning local issues has stimulated a number of interesting research questions, One of them is the way in which people interested in solving local problems can contribute to their resolution outside the confines of the traditional public meeting environment. A prototype software that enables group collaboration across space and time using the Internet infrastructure, called SUDSS, has been created as a step towards the development of public GIs. There are at least two dternative architectures of space- and time-distributed public GIs: one based on stand-alone software and the other based on integrating GIS applications with Web browsing sobare. The first alternative was adopted in SUDSS design for its flexibility and ease of implementation. SUDSS uses the Internet to move the results of work between the system users and the server, provides built-in Web browsing capability as well as network communication tools. There are several features that can be implemented in SUDSS to improve the current prototype. They include Web browsing capability allowing an easy navigation among data, especially: local- or server-based hypertext help Web access to provide distributed information dynamic server query capability. Additional capabilities utilizing the Internet infrastructure may include:
References Bhargava H K, Krishnan R, and Whinston A D 1994 O n integrating collaboration and decision analysis techniques. Journal of Organizational Computing, 4: 297-3 16 Buonicore A J 1996 Brownfields: A game of patience. Environmental Manager, March: 60-2 Coudelis H and Monmonier M 1995 Using SUSS to resolve NIMBY: How spatial understanding support systems can help with the ‘not in my back yard’ syndrome. Geographical System, 2: 83-101 Densham P J 1991 Spatial decision support systems. In Maguire D J, Goodchild M F, and Rhind D W (eds) Geographical Information Systems: Principles and Applications, volume 1. New York, John Wiley & Sons, Inc.: 403-12 Densham P J, Armstrong M P, and Kemp K 1995 Report from the specialist meeting on collaborative spatial decision making. Initiative 17. Santa Barbara, University of California, National Center for Geographic Information and Analysis Faber B, Wallace W, and Cuthbertson J 1995 Advances in collaborative GIS for land resource negotiation. Proceedings GIs 95 Vancouver, Marcb 1995, volume 1. Fort Collins, GIS World, Inc.: 183-9
83
P Janltowski and M Stwsik Faber B, Watts R, Hautaluoma J, Knutson J, Wallace W, and Wallace L 1994 A groupware-enabled GIs. Proceedings G I s 94, Vancouver, February 1994, volume 1. Fort Collins, GIS World, Inc.: 551-61 Hwang C-L, Lin M-J 1987 Group Decision Making Under Multiple Criteria. Berlin, Springer-Verlag Jankowski P, Nyerges T 1, Smith A, Moore T J, and Horvath E 1997 Spatial group choice: A SDSS tool for collaborative spatial decisionmaking. Internationaljournal of Geographical Information Science, 1 1: 577-602 Jessup L and Valacich J (eds) 1993 Group Support Systems: New Perspectives. New York, Macmillan Publishing Company Kahneman D, Slovic P, and Tversky A (eds) 1986 judgement Under Uncertainty: Heuristics and Biases. Cambridge, Cambridge University Press Lake R 1993 Planning and applied geography: positivism, ethics, and geographic information systems. Progress in Human Geography, 17: 40413 Mosvick R and Nelson R 1987 We’ve Got To Start Meeting Like This: A Guide To Successfil Business Meeting Management. Glenview, Scott, Foreman Nunamaker J D A, Valacich J, Vogel D, and George J 1993 Group support systems research: Experience from the lab and the field. In Jessup L and Valacich J (eds) Group Support Systems: New Perspectives. New York, Macmillan Publishing Company Nyerges T L and Jankowski P 1997 Enhanced adoptive structuration theory: A theory of GIs-supported collaborative decisionmaking. Geographical Systems [in press] Poole M S and Roth J 1989 Decision development in small groups IV:A typology of groups decision paths. Human Communication Research, 15: 323-56 Sheppard E 1995 GIS and society: Towards a research agenda. Cartography and Geographic Information Systems, 22: 25 1-317 Simon H and Associates 1992 Decision making and problem solving. In Zey M (ed) Decision making: Alternatives t o Rational Choice Models. Newbury Park, SAGE Publications: 32-53
84
Voogd H 1983 Multi-criteria Evaluation f o r Urban and Regional Planning. London, Pion Limited Zey M (ed) 1992 Decision making: Alternatives to Rational Choice Modeb Newbury Park, SAGE Publications