Spatio-Temporal Decision Support System for Natural Crisis Management with TweetComP1 Stuart E. Middleton1, Andrea Zielinski2, Öcal Necmioğlu3, Martin Hammitzsch4, 1 University of Southampton IT Innovation Centre, Gamma House, Enterprise Road, Southampton, SO16 7NS, UK,
[email protected] 2 Fraunhofer Institute of Optronics, System Technologies and Image Exploitation, Karlsruhe, Germany,
[email protected] 3 Kandilli Observatory and Earthquake Research Institute, Istanbul, Turkey,
[email protected] 4 GFZ German Research Centre for Geosciences, Potsdam, Germany,
[email protected]
Abstract. This paper discusses the design of a social media crisis mapping platform for decision making in natural disasters where tweets are analysed to achieve situational awareness during earthquake and tsunami events. A qualitative end user evaluation is undertaken on our first prototype system to get feedback from practitioners working in the field of hazard detection and early warning. Participating in our evaluation is the Kandilli Observatory and Earthquake Research Institute (KOERI) and the Portuguese Institute for the Sea and Atmosphere (IPMA). We conclude that social media crisis mapping is seen as a valuable data source by control room engineers, with update rates of 10-60 seconds and false positive rates of 10-20% (general public incident reports) needed. Filtering crisis maps and statistical reports by social media platform and user type is desirable as different report sources have different credibility and response times. Keywords: decision support, web 2.0, twitter, social media, crisis mapping, geoparsing, multilinguality, early event detection
1 Introduction In recent years vast amounts of Web 2.0 content has become available, such as Twitter messages, YouTube videos, blogs and RSS feeds. Such ‘unconventional’ social media sensors allow rapid in-situ crowd-sourced measurement by people actually experiencing a crisis event (e.g. via mobile devices). Social media can provide incident reports on tsunami wave arrival and inundation at coastal areas. This provides Tsunami simulation units and decision makers with observations on the wave's propagation and impact. In highly populated areas such as the Mediterranean region there can be a huge number of potential coastal areas at risk [11], so receiving timely incident reports could be of great benefit to a Tsunami warning centre. However, social media streams also bear risks: such data has variable quality and a high noise to signal ratio. Ultimately decision makers need a situation assessment
picture they can trust, is updated in real-time and offers the possibility to manually check and verify incident reports on demand. It is particularly important to find the right balance between responsive alerting and avoidance of time-wasting false positives. We have observed during our own monitoring of recent crisis events (e.g. New York hurricane Sandy 2012, Oklahoma tornado 2013, Philippines Tsunami 2012) keyword filtered Twitter Streaming API throughput of up to 20,000 tweets per hour [17]. Given the rapid adoption rate of social media around the world this throughput is only expected to get larger. On average about 1% of the tweets we observed during crisis periods contained a geotag, making the processing of tweet content important if we want access all available location information. Social media crisis mapping is the provision of situation assessments from real-time social media feeds. Key research challenges include intelligently handling the large volume of social media reports available, keeping false positive rates low and accurately geo-parsing map information from microblog content. Further to this is the challenge of convincing Tsunami warning control room engineers of the value social media reports offer to a situation picture for inclusion and use in the control room itself.
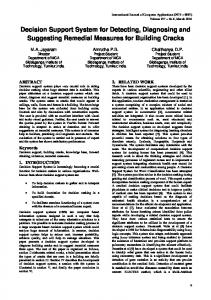
Fig. 1. TRIDEC Command and Control User Interface (CCUI) with sensor-data (left) and social media crisis map (right) showing flooded areas (red lines and polygons)
Our approach of combining content-based geo-parsing of social media streams, at both the region and street-level, multi-lingual event classification and real-time crisis mapping is novel. Our end-user evaluation of an integrated tsunami early warning system prototype combining social media and traditional sensor-based data sources is also a valuable contribution to practitioners in this field. Our goal is to quantify the tsunami early warning control room end-user performance targets for acceptance of social media crisis mapping into the decision support workflow, and analyse how close this technology is to meeting these targets.
2 Decision Support for Tsunami Event Natural Crises The heart of an Early Warning System is an Operation Centre, where the seismic and/or tsunami monitoring networks are connected via reliable and robust communication channels utilizing a Decision Support System based on event source parameters, such as magnitude, location and depth. This information constitutes the essential part of the early warning process, and any errors introduced at this stage may lead to false alarms, especially considering that it would also affect the assessment of the impacted areas. In fact, an Early Warning Centre should adopt all possible methodologies to minimize the false alarm rate, since any false alarm would undermine the credibility of the Early Warning Centre, and therefore would jeopardize the community’s earthquake preparedness. On the other hand, a false alarm in the case of earthquake may only correspond to the ill-determined magnitude, since a seismic network consisting of tens or hundreds of stations could not lead to a false alarm for a non-existing event. For a real event the combination of unconventional human sensors through the use of web 2.0 system would provide a verification mechanism beyond conventional methodologies. The mapping of social media activity presented to the operators could assist the information obtained from instrumental recordings. In the case of an earthquake, near real-time shake maps providing ground motion and shaking intensity maps, are of crucial importance for Civil Protection and Disaster and Emergency Management Authorities to assess the criticality of the event in order to better assist post-event response and recovery actions. Social-media activities, displayed jointly with the shake maps, could provide a near-real time correlation of the two datasets of different nature, which could provide the extent of the damage associated to the events. In the case of the tsunamis, parameters such as arrival times and tsunami waveheights obtained from pre-calculated or near real-time tsunami simulations are the key elements. Nevertheless, in the case of tsunamis, the scale of the instrumental observations is much more lower than the earthquake case, especially in a region where DART-like offshore buoys are not operated. In such an environment, Early Warning Centre's main conventional support is tide-gauge measurements at the coastal locations, from which the Centre could initiate an “early-warning” only applicable for a further distant location. In such a situation, the human sensors could play a very important role in terms of identifying the affected areas, such as through the interactive visualization of Twitter streams. This assumption, however, may not be valid in the areas affected strongly by extreme catastrophic events, where the communications lines could be destroyed or the human sensors would be ineffective in localities of major destruction. On the other hand, such inactivity could also be considered as the evidence of major destruction if some activity could be monitored in the surrounding regions favourably located. Such information would be of “supplementary” status, and its primary use would be by the Civil Protection and Disaster and Emergency Management Authorities. The TRIDEC project [5] [6] is building a prototype tsunami early warning system for the North-Eastern Atlantic and Mediterranean (NEAM) region. Our aim is to provide decision support for National Tsunami Warning Centre (NTWC) deployments integrating 'conventional' real time sensor data (e.g. seismometer
networks, tide gauges, GPS stations, GPS buoys, ocean bottom units including pressure gauges) and social media human sensor data (e.g. crisis maps, news feeds). Additionally access to support information such as bathymetric and topographic data sets, pre-computed tsunami simulations and/or on-demand simulation computations is provided to help make predictions on Tsunami wave propagation and the estimated impact times at coastal regions. Operators on duty need to quickly assess the relevance and tsunamigenic properties of earthquake events and, if necessary, make use of information logistics and dissemination facilities to send customized, usertailored warnings to responsible authorities and the general public under immediate risk. A 'conventional' command and control user interface [2] is shown in fig 1. Our crisis maps, alongside publically available social media and traditional media reports such as news reports and mobile video footage, can provide additional rapid incident reports from people experiencing both earthquakes and Tsunami wave inundation. Our hypothesis is that the combination of situation assessment from 'conventional' hardware-based sensor systems and 'unconventional' social media systems will improve the overall situation picture quality and timeliness within the control room. Decision support is provided via the command and control user interface, for situation assessment and manual decision making, and a BPMN2 workflow engine for faster automated decision making. Control room personnel can define a decision matrix with rules to handle specific events in a simple Excel spreadsheet, which is imported and converted to Drools Expert rules for automated execution. Workflows and rules exist for the Tsunami relevance, assessment, verification and warning phases. We use rules triggered on earthquake alerts to start recording tweets and generating relevant crisis map display layers for the command and control user interface.
3 Related Work In the last decade there has been growing interest in the exploitation of social media for crisis management. The most prominent framework for earthquake and tsunami detection, Toretter [8] [7], is based on a probabilistic state sequence model which aims to locate the centres of earthquakes by means of Kalman and particle filters. Their experiments confirm that Toretter often can send notifications for detected earthquakes quicker than traditional seismic-based sensors. The Tweet Earthquake Dispatch (TED) system managed by U.S. Geological Survey (USGS) [14] uses a short-term-average over long-term-average algorithm, which compares the frequencies of raw incoming tweets over a fixed time window against the background noise to detect seismic events. Furthermore [10] propose to filter tweets with respect to whether they might contribute to enhance situational awareness during an earthquake event using linguistic features. The systems are operated in earthquake endangered zones, i.e. Japan and the United States. Humanitarian organizations and networks of volunteer's have setup live web-based manual crisis mapping sites [4] for recent natural disasters such as the Haiti 2010 earthquake, New York's 2012 hurricane Sandy and Oklahoma's 2013 tornado. These
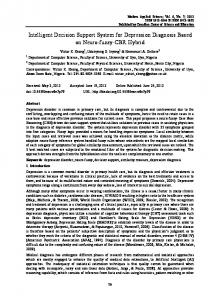
organizations manually filter crowd-sourced information from news reports, social media and civil protection agency alerts, and collate it into live web-based crisis maps for the general public to see. The challenge [4] for these organizations is to automate the real-time data fusion of large volumes of multi-source heterogeneous information for scalability, whilst still maintaining trust and credibility in this data. In the context of decision support or early warning, a strong focus needs to be placed on usability and integration aspects [9]. Most central to this is the possibility to browse and visualize social media data in real-time. For instance, the Emergency Situation Awareness (ESA) system has been set up in collaboration with the Australian Crisis Coordination Centre to fulfil these aims. ESA can cope with different emergency cases, for which social media activity (Twitter, images, video) is displayed on a map and presented to the operators [13]. Twitcident [1] is a framework for filtering, searching and analysing information for different kinds of real-world incident and social media HASC Region OpenStreetMap Shapefiles types. It is connected to an Twitter Google Google Gazatteers emergency broadcasting Streaming API Geocoder API Places API service for adaptive filtering of Adaptive Trained Classifier Volunteered Geographic Information Geocoder Twitter information and uses Twitter Crawler Models (VGI) Extraction enhanced semantic analysis Database Storage tools and faceted search facilities. SensePlace2 [3] is Data Fusion another framework which is Pre-processing Decision Support Map Server able to extract deeper Geo-Parsing Workflow semantics from Social Media Geospatial Clustering Decision Tables streams. Moreover, it uses Command and Control Multi-lingual Classification elaborate visualization User Interface Early Event Detection techniques to present an overview to the user [3]. In a Message Oriented Middleware user-study, the user-interface was designed such as to 'Traditional' Hardware Sensor Networks provide optimal support. Fig. 2. Information viewpoint for the TweetComP1 architecture
4 TweetComP1 Architecture: A Framework for Human Sensor Network Analysis and Crisis Mapping The TRIDEC social media framework [16], see fig 2, is called TweetComP1. For scalable communication we use an event bus, deploying a message oriented middleware backbone. The TRIDEC database layer is a shared workspace for processing services. A decision support framework driven by expert-authored decision tables orchestrates the processing sub-systems. Various video demonstrations of the TRIDEC prototype in action can be found at [18].
Real-time acquisition of social media: An adaptive twitter crawler [12], which is capable of following trending keywords and adapting the filter keywords used in requests to the Twitter Streaming API. For basic crawling we have a list of earthquake and flood related keywords in multiple languages (e.g., deprem, terremoto). All tweet data and metadata is logged to a MySQL database. Geoparsing and geospatial clustering: Offline processing involves the download and geocoding of map data for coastal regions at possible risk of Tsunami. Map information sources include OpenStreetMap, Google Places API and gazetteers such as Geonames and GEOnet Names (GNS). The location names, addresses and OpenGIS geometry are loaded into a MySQL database and geocoded using the Goggle Geocoder API to extract address components such as short versions of street names. Map sources provide street and building level locations whilst gazetteers provide region level locations. For online processing Tweets are geo-parsed [17] and locations matched to the offline database of coastal geographic information. Tweets are first tokenized into ngram tokens and then named entity matching performed. A baseline historical dataset, during which no crisis occurred, is used to statistically calculate threshold levels for map reporting; this helps reduce false positives for locations with common names such as 'Hollywood' that are tweeted often. Hierarchical clustering is used to overlay polygons onto groups of nearby streets. Fig 3 shows an example of a crisis map display showing tweeted street level flood reports. Fig. 3. Street level crisis map of flood inundation for a Tsunami scenario in Portugal
Multilingual classification: It is often difficult to separate real valuable information from background noise in social media data. To handle the increasing load of noisy and off-topic information, enhanced filtering techniques are needed. Our approach is based on supervised learning [15] and works for a variety of languages. A configurable threshold level is used to filter out tweets below an acceptable relevance score. Fig 4 and 5 shows our tweet analytics interface during an Earthquake in Turkey. In live-mode, the display is continuously refreshed. In historic mode, predefined scenarios for specific events can be selected and replayed in normal or acceleration mode. The twitter activity can be shown for any user-selected time range or can be configured for a certain geographic region.
Additionally, a visual presentation of three graphs is displayed: a timeline graph with the hourly volume of tweets, a bar graph that clusters tweets by their relevancy score, and a pie graph that shows the share of languages and geographic destination of the tweets. Early event detection: With the increasing number of Twitter users all over the world it becomes possible to automatically detect novel earthquake/tsunami events from a twitter stream in a timely manner. We aggregate tweets for a certain spatial region and time-span, e.g. an interval of one minute. Geo-location information is extracted from metadata (i.e. geotag) and the unstructured twitter text (i.e. region names) and mapped to Hierarchical Administrative Subdivision Code (HASC) regions. Emergency alerting: Warning alerts are triggered according to specified thresholds, for example if the relevant tweets per time period in a region is exceed. The alert message format is based on the Common Alerting Protocol (CAP) standard of the Organization for the Advancement of Structured Information Standards (OASIS). Crisis map visualization: We can use either the MapServer or Geoserver mapping applications, driven from OpenGIS geometry data in a MySQL database. At the region level we plot tweet geotag point data, HASC regions and centroid points for mentions of local region names such as cities or suburbs. At the street level we plot roads and building outlines for any above threshold report frequencies within a rolling 3-6 hour sample window updated every 30 seconds. The design of the interactive visualization of Twitter streams is inspired by SensePlace2 [3], aiming to present an aggregated highlevel overview of the situation to the operator on duty in realtime. Fig. 4. Visual analytics interface including timeline statistics for a Tsunami scenario in Turkey
5 User Evaluation of the TweetComP1 Our evaluation methodology involves each organization's operation room staff watching a demonstration of our prototype during a Tsunami simulation off the coast of Portugal. Feedback from end-users is elicited via semi-structured questionnaires and the data used to define performance targets for end-user acceptance of social media crisis mapping in the decision support workflow. We then compare these performance targets with published [15] [17] benchmark results for our prototype.
We asked Tsunami control room engineers from the Kandilli Observatory and Earthquake Research Institute (KOERI) and the Portuguese Institute for the Sea and Atmosphere (IPMA) to participate in our study. The semi-structured questionnaires asked users to specify acceptable update and false positive rates for crisis maps, rank incident types / social media user types in order of importance, provide preferences for crisis mapping display artefacts and rank possible information in order of importance for the decision support process in the control room. 5.1 Acceptance criteria Our experts considered Twitter a credible information source overall, scoring it 4/5. The most trusted types of Twitter users were government units/municipality, news agencies and humanitarian/volunteer agencies. Lowest in the ranking were the general public. The most trusted information source was tweets from agencies such as U.S. Geological Survey (USGS) and European-Mediterranean Seismological Centre (EMSC). The type of tweeted incident considered most useful for a crisis map were major earthquake shaking / damage, infrastructure damage reports and flood inundation reports. Opinions varied for the importance of individual cries for help and Tsunami wave sightings as these may not be indicative of specific Tsunami damage. Minor earthquake shaking reports were least useful.
Fig. 5. Region level crisis map of earthquake reports for a Tsunami scenario in Turkey
The minimum crisis map update delay was 10 seconds during a crisis, and 60 seconds for normal activity. A false positive rate of 10-20% was specified for tweet users with a low credibility (i.e. general public) and a 'minimum possible' false positive rate for tweets originating from more trusted sources. 5.3 Performance of the TweetComP1 prototype with regards acceptance criteria The current TweetComP1 system processes streams of tweets in real-time and provides map updates every 30 seconds on modest hardware (i.e. 2.5GHz CPU,
8Gbytes RAM). A 10 second update rate is achievable but some optimization of the data processing is needed from twitter crawler to final crisis map. Our false positive rate [15] [17] for large events such as major earthquakes and Tsunami is within the range 10-13% for the major languages like English and Spanish. There is still room for improvement for other languages with more limited training material. We need to work on lowering the false negative rate for smaller events, such as minor earthquakes and floods, since the quality of any Twitter crisis map depends on having enough people tweeting about the event in the first place. It should be noted that general public tweeters are the least trusted but they can produce incident reports sometimes within seconds of the event itself. Multiple tweeters can raise the credibility of an incident report. We need to look at ways to allow filtering of our map layers based on the user type and data source. For example viewing less trustworthy general public reports in the very early stage of a crisis and moving to more reliable reports from official organizations as the crisis develops.
6 Conclusion We present in this paper the TRIDEC high-level architecture for crisis mapping of 'unconventional' social media sensors. We are able to process real-time Twitter microblog streams and extract region, street and building level location information relating to earthquake events, Tsunami wave arrival and inundation reports. We performed a qualitative evaluation of our TweetComP1 system using Tsunami control room engineers from two organisations, showing that social media crisis maps are credible as a data source for use within a control room. For control room use an update rate of 10-60 seconds and false positive rate of 10-20% (general public incident reports) is needed. These targets are within the reach of our prototype system and we are looking now at future plans to move this work into the exploitation phase. ACKNOWLEDGEMENTS We would like to acknowledge the feedback received from control room engineers at the Kandilli Observatory and Earthquake Research Institute (KOERI) and Portuguese Institute for the Sea and Atmosphere (IPMA). The work presented in this paper is part of the research and development in the TRIDEC project (contract no. 258723), supported by the 7th Framework Program of the European Commission.
References 1.
Abel, F., Hauff, C., Houben, G. J., Stronkman, R., Tao, K. (2012, April). Twitcident: fighting fire with information from social web streams. In Proceedings of the 21st international conference companion on World Wide Web (pp. 305-308). ACM.
2. 3.
4. 5.
6. 7. 8. 9. 10.
11. 12. 13. 14. 15. 16. 17. 18.
Hammitzsch, M., M. Lendholt, and M. Á. Esbri. "User interface prototype for geospatial early warning systems–a tsunami showcase." Nat. Hazards Earth Syst. Sci 12 (2012): 555573. MacEachren, A. M., Jaiswal, A., Robinson, A. C., Pezanowski, S., Savelyev, A., Mitra, P., Blanford, J. (2011). Senseplace2: Geotwitter analytics support for situational awareness. In Visual Analytics Science and Technology (VAST), 2011 IEEE Conference on (pp. 181190). IEEE. Meier, P. "New Information Technologies and their Impact on the Humanitarian Sector", International Review of the Red Cross, Dec 2011, Vol 93, No. 844 Middleton, S.E., Sabeur, Z.A., Löwe, P., Hammitzsch, M., Tavakoli, S., Poslad, S. (2013): Multi-disciplinary Approaches To Intelligently Sharing Large-volumes Of Real-time Sensor Data During Natural Disasters, Data Science Journal, Special Issue of the Proceedings of the 1st WDS Conference in Kyoto 2011, Volume 12, pages 109-113 Moßgraber, J, Middleton, S, Hammitzsch, M, and Poslad, S (2012). "A Distributed Architecture for Tsunami Early Warning and Collaborative Decision-support in Crises", Geophysical Research Abstracts, 14, EGU2012-8040-2. Sakaki, T. Okazaki, M. Matsuo, Y. Tweet Analysis for Real-time Event Detection and Earthquake Reporting System Development, IEEE Transactions on Knowledge and Data Engineering, April 2013, Vol. 25, No. 4 (2013) Sakaki, T., Okazaki, M., Matsuo, Y. (2010, April). Earthquake shakes Twitter users: realtime event detection by social sensors. In Proceedings of the 19th international conference on World wide web (pp. 851-860). ACM. Steinmetz, T., Raape, U., Teßmann, S., Strobl, C., Friedemann, M., Kukofka, T., Dech, S. (2010). Tsunami early warning and decision support. Natural Hazards and Earth System Sciences, 10(9), 1839-1850. Vieweg, S., Hughes, A. L., Starbird, K., Palen, L. (2010, April). Microblogging during two natural hazards events: what twitter may contribute to situational awareness. In Proceedings of the 28th international conference on Human factors in computing systems (pp. 1079-1088). ACM. Wächter, J, Babeyko, Y, Fleischer, J, Häner, R, Hammitzsch, M, Kloth, A, and Lendholt, M (2012). "Development of tsunami early warning systems and future challenges", Nat. Hazards Earth Syst. Sci., 12, pp 1923-1935. Wang, X. Tokarchuk, L. Cuadrado, F. Poslad, S. (2013) Exploiting Hashtags for Adaptive Microblog Crawling. IEEE/ACM. International Conference on Advances in Social Networks Analysis and Mining. ASONAM 2013, Niagara Falls, Canada Yin, J., Karimi, S., Robinson, B., Cameron, M. (2012, October). ESA: emergency situation awareness via microbloggers. In Proceedings of the 21st ACM international conference on Information and knowledge management (pp. 2701-2703). ACM. Young, J.C. Wald, D.J. Earle, P.S. Shanley, L.A. Transforming Earthquake Detection and Science Through Citizen Seismology, Washington, DC: Woodrow Wilson International Center for Scholars, 2013. Zielinski, A. (2013). Detecting Natural Disaster Events on Twitter across Languages. In IIMSS (pp. 291-301). Zielinski, A., Tokarchuk, L., Middleton, S.E, and Wang, X. (2013) Social Media Text Mining and Network Analysis for Decision Support in Natural Crisis Management. ISCRAM 2013, 12-15 May 2013 in Baden-Baden, Germany. Middleton, S. Middleton, L. Modafferi, S. (2014) Real-time Crisis Mapping of Natural Disasters using Social Media. IEEE Intelligent Systems, 02 Jan. 2014. IEEE computer Society Digital Library. IEEE Computer Society TRIDEC video demonstrations, YouTube, http://www.youtube.com/user/tridecproject