(Pomatoschistus minutus, P.); and plaice (Pleuronectes platessa, L.). Less important species were: sole (Solea so/ea, L.); sprat (Sprattus sprattus, L.); hook-nose ...
_ _ _ _______,EaSpatio-temporal variability in the structure of a nectobenthic fish nursery: a descriptive study
Numerical ecology Coastal nursery Fish community Ecological guild Pleuronectiform juveniles Écologie numérique Nourricerie littorale Peuplement ichthyologique Guilde écologique Pleuronectiformes juvéniles
Patrick SAFRAN Laboratoire d'Écologie Numérique-SN3, Station Marine de Wimereux, Université des Sciences et Techniques de Lille, 59655 Villeneuve-d' Ascq Cedex, France. Present address: Department of Fishery Sciences, Laboratory of Marine Living Resources, faculty of Agriculture, Tohoku University, 1-1 Tsutsumidori Amamiyamachi, Sendai 981, Japan. Received 16/ll/88, in revised form 717/89, accepted 13/7/89.
ABSTRACT
When the by-catch of an artisanal brown shrimp fishery in the Canche bay demonstrated the existence of an important nursery of nectobenthic fishes, a survey of this nursery was performed along the coast of the Pas-de-Calais (Eastern Manche) from January 1985 to June 1986. Tne samples were obtained from 210 hauls of an experimental trawl containing 51 600 juveniles of 37 species. Complementary multivariate statistical methods, such as diversity index, rank-frequency diagrams, particularly the smoothed rank-frequency diagram have proved to be powerful tools in assessing the relationships between the populations of different species in a community. Qualitative and quantitative similarity, cluster analysis and correspondence analysis showed that: 1) the fish community in this area was qualitatively, quantitatively and structurally homogeneous; 2) this single, "multispecific" community was maintained by a seasonal flow of individuals, which passed through the nursery and induced a turnover of the dominant populations, without any modification to the general faunistical pattern (structure); 3) Dab (Limanda limanda, L.) constituted the predominant population. Three other important populations were: dragonet (Callionymus lyra, L.); sand goby (Pomatoschistus minutus, P.); and plaice (Pleuronectes platessa, L.). Less important species were: sole (Solea so/ea, L.); sprat (Sprattus sprattus, L.); hook-nose (Agonus cataphractus, L.); and poor cod (Trisopterus minutus, L.); 4) The three pleuronectiforms, dab, plaice and sole, formed a structural guild, referred to here as the LPS guild (L. for Limanda, P. for Pleuronectes and S. for Solea), within the nursery community. Within the LPS guild, seasonal succession showed autumnal and hibernal dab populations (1986); hibernal (1985) and coastal estival plaice; and a printempal sole. Their various growth-rates (plaice > dab >sole) induced the cohabitation of individuals of various size classes, without obvious exclusion of any of the three species. The distribution of individuals in space and time, which was the result of a regular flow of individuals passing into the nursery, replenishing the stocks with juveniles, maintained this cohabitation. Oceano/ogica Acta, 1990. 13, 1, 97-106.
RÉSUMÉ
Variabilité spatio-temporelle de la structure d'une nourncene de poissons nectobenthiques: une étude descriptive Suite à une étude de la pêche accessoire dans la pêcherie artisanale de crevettes grises en baie de Canche, qui a démontré l'existence d'une importante nourricerie littorale de poissons nectobenthiques, une étude écologique de cette dernière a été effectuée de janvier 1985 à juin 1986 à partir d'un échantillonnage comprenant 210 traits de chalut, répartis le long du Pas-de-Calais, et qui ont permis la collecte d'environ 51600 individus juvéniles de 37 espèces. Des méthodes statistiques multivariables complémentaires les unes des autres : diversité spécifique, diagramme rang-fréquence, similarités qualitatives et quantitatives, analyses factorielles des correspondances et classifications
0399-1784/90/01 97 10/$ 3.00/© Gauthier-Villars
97
..,
P. SAFRAN
numériques représentées par des dendrogrammes, ont permis de démontrer: 1) une homogénéité faunistique qualitative, quantitative et structurelle dans cette zone; 2) l'existence d'un peuplement unique, réparti sur l'ensemble de la zone d'étude, soumis à un flux saisonnier d'individus qui traversait en permanence la nourricerie et entraînait le renouvellement des populations structurantes, sans modification de la composition faunistique générale; 3) La limande (Limanda limanda, L.) représentait la population dominante de ce peuplement. Trois autres populations étaient structurantes : celles du callionyme (Callionymus lyra, L.), du gobie (Pomatoschistus minutus, P.) et de la plie (Pleuronectes platessa, L.), accompagnées par celles de la sole (Solea solea, L.), du sprat (Sprattus sprattus, L.), de la souris (Agonus cataphractus, L.) et du petit tacaud (Trisopterus minutus, L.). Parmi ces espèces, les Pleuronectiformes (Limande, Plie et Sole) representaient une guilde structurante (nommée ci-après guilde LPS) du peuplement; 4) Au sein de la guilde LPS, les remplacements saisonniers successifs faisaient apparaître une limande automnale et hivernale (1986), une plie hivernale (1985) et estivale collectée principalement à la côte, et une sole printanière, Leurs vitesses de croissance différentes (plie>limande>sole) semblaient induire une cohabitation d'individus de toutes tailles sans entraîner d'exclusion. Oceanologica Acta, 1990. 13, 1, 97-106.
INTRODUCTION It has been established that the coastal zone is an area of reproduction, egg-laying, growth and nursery grounds for many species of offshore fishes (Peres, 1972; 1976; Bougis et al., 1976; Margalef, 1977; 1983; Ross, 1977; Lackey and Nielsen, 1980). The factors influencing migrations and temporary concentrations have yet to be determined. Fishery studies tend to focus on commercial adult populations, and knowledge of factors that influence the juvenile populations is often poor (Weinstein, 1982; Alderdice, 1985). Recruitement to adult stocks depends on the events occuring during the juvenile growth period. Nurseries ensure the permanence of populations, but at the same time, owing to their geographical localization, their limited area and the possible competition between species, they constitute a limitation, and most probably a regulatory mechanism for stocks. Only a few ecological studies are performed on nurseries; these are generally focused on commercial species, as for example, herring ( Clupea harengus L. : Hodgson, 1957; Burd, 1962; Cushing, 1968), plaice (Pleuronectes platessa L.: Gross, 1947; Beverton and Holt, 1957; Dawson and Grimm, 1980), or managed in restricted areas such as estuaries, hays and lagoons (Marchand et al., 1983; Labourg et al., 1985). The study area in the present work is located in the open sea, along the coastal zone of the Pas-de-Calais in the Eastern Manche (English Channel), a zone harvested by an artisanal brown shrimp (Crangon crangon, L.) fishery. The study of the bycatch of this shrimp fishery in Canche Bay demonstrates the existence of an important nursery of exploited flatfishes (Safran, 1984; 1985; 1987 a) including plaice, dab (Limanda limanda, L.) and sole (Solea solea, L.). Many other species, whether exploited or not, occur together with these flatfishes: the area is a multispecific nursery. lt is therefore clear that spatio-temporal variations, abundance fluctuations, and cohort successions of sampled populations inside this coastal stretch cannot be analysed for one
target-species without taking into consideration the fluctuations of the others. This reflects the realization that single-species population dynamic models are insufficient for fisheries management purposes; multispecies interactions must be considered, as well as the impact on stocks caused by fishing, etc. The work presented here documents, for the first time in this area, the fish community of a coastal multispecific nursery, and concludes that there is one single community. Multivariate statistical methods are used to analyse the multispecific samples obtained by this survey. Moreover, special attention is given to dab, plaice and sole. These three flatfish populations are studied here in more depth for two main reasons. Firstly, they are of primary economie importance, constituting prerecruitment stages of stocks exploited by an artisanal fishery (off Boulogne-sur-mer and Etaples, Pas-deCalais, France). Secondly, they are the most numerous species in this survey. Dab is the main species and plaice is a dominant one of the single coastal nursery community sampled along the Pas-de-Calais. Another important species is sole, which constitutes an escort population, while dab and plaice are structural (in terms of data analysis). These three species belong to the same family Pleuronectidae. They may have similar ecological requirements and foraging strategies (Barrett and Yonge, 1958; Wheeler, 1978; Bauchot and Pras, 1980; Muus and Dahlstrom, 1981; Quero, 1984), and so fit the definition of an ecological guild (Lincoln et al., 1982; Barbault, 1983), which is referred to here as the LPS guild (L. for Limanda, P. for Pleuronectes and S. for Solea; in decreasing order of importance). Concentration on the three structural species of the gui1d provides a rouch better understanding of the general results, and specifies cohort succession and growth during the period the fishes spend in the "foster mother" zone.
98
VARIABILITY AND STRUCTURE IN A FISH NURSERY
MATERIALS AND METHODS Study area The sampling area was located along the French "Opal Coast" (Pas-de-Calais, Eastern Manche), between the southern mouth of Canche Bay and the northern end of Boulogne-sur-mer (Fig. 1). A preliminary study of the nursery from commercial trawl samples (Safran, 1987 a) allowed the demarcation of a coastal zone with a sandjsand-mud bottom, and a depth varying tidally from 3 to 6 m.
t
-NI
Sampling An experimental beam-trawl was designed for this study, and adapted to the oceanographie vessel "Sepia II' (Station marine de Wimereux, CNRS), a ship similar in its technical characteristics to small professional fishing boats. It is 12.5 m in length and is powered by a 112 horsepower engine (Safran, 1987 b). The trawl length was about 8. 20 rn, with a pole stretching a span of 2.80 m and skates which were 0.40 m in height. The pocket included two sectors, the first formed by a 14 mm mesh-side and the second one by a 10 mm mesh-size. In front of this net, a chain-pad was preceded by a chain used to hoist the fish. Each trawling operation was carried out at a speed of about 1 . 5 knots, for 15 minutes, against the tidal current, parallel to the coast. From January 1985 to June 1986, 13 experimental trawls per month were carried out (Fig. 1 b), in north-south and shore-offshore directions corresponding to initial working hypotheses based on the existence of faunistica1 gradients according to those two directions.
Hardelot
Figure 1 Study area: a) general localization; and b) sc hematie localization of the 13 experimental trawling sites. Zone d'étude: a) localisation générale; et (b) localisation schématique des 13 traits expérimentaux.
Stells
50'30'N
Specifie diversity was estimated by the Shannon index (Shannon and Weaver, 1963), white evenness was estimated by the Pielou index (Pielou, 1975). Multivariate analysis was performed by factorial analysis of correspondence (FAC), which is one of the most frequent! y used analyses for multivariate data tables in ecological studies (Legendre and Legendre, 1984); by numerical classification using cluster analysis, which was obtained by the quantitative similarity index of Gower based on the abundance of species (Gower, 1971); and by the qualitative similarity index of Ochiai based on the presence-absence of species (Ochiai, 1957). Dendrograms were obtained by the flexible clustering method of Lance and Williams (Lance and Williams, 1967). Following Blondel (1979), Barbault (1981) and Lincoln et al. (1982), a population is defined as a group of individuals of the same species, present in the same zone; and a "multispecific" community in a given zone as the communities (or populations) of different species present. In order to follow changes in the mutual proportions of dab, plaice and sole, without considering the other species simultaneously sampled, their variations were presented on triangular diagrams (Calot, 1973). This corresponds to the simplex representation in factorial analysis (Benzecri et al., 1982; 1984). It should be noted that Factorial Analysis of Correspondence is an ordination in the simplex, but in the simplex of ali the variables. The study of the guild was restricted to on1y three variables: abundance of dad, plaice and sole. Analysis of spatio-temporal variations of mutual percentages (relative abundances of species) for these three
Data analysis 176 experimental trawls were performed, producing a total of sorne 38 000 individuals belonging to 37 species. The nomenclature follows the Check-List of Fishes of the North Atlantic and Mediterranean (Hureau and Monod, 1973). Catch composition was variable, so the following multivariate statistical methods were used to show the similarities and differences between the sampies. Rank-frequency diagram methods (Frontier, 1976; 1985) provide good descriptions of the specifie diversity of a sample by representing the distribution of individuals among species. A rank-frequency curve is obtained by placing the log of the rank on the abscissa vs. the log of the frequency on the ordinate. For one sample, the shape of the curve is generally irregular. A regular, smoothed shape is obtained when the numbers of individuals are cumulated following two methods (Safran, 1987 a): 1) a "cumulative" diversity is obtained, higher than the mean diversity of the samples, when the number of individuals of different species are cumulated. The rank-frequency diagram, or "RFD", is more convex and extended on the right, as the number of species increased; 2) when the number of individuals are cumulated by rank, independent of the species in the ranks which fluctuate from one sample to another, a smoothed "average RFD" is obtained.
99
P. SAFRAN
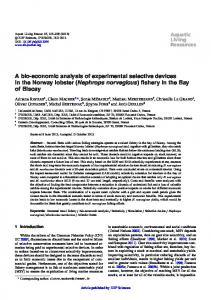
Figure 2 Winter (February 27, 1985). Correspondence Ana/ysis shows projections in the plane of axes 1 and 2 of "station" vectors (code numbers are the sampling stations in time and in space throughout the survey. They are grouped according to the samp/ing locations given in Figure lb; see also Safran, 1987b) and "species" vectors (see species abreviations in Appendix). Hiver (27 février 1985) : Analyse Factorielle des Correspondances : projections dans le plan factoriel ( 1, 2) des vecteurs « stations » (les numéros représentent les stations d'échantillonnage dans le temps et dans l'espace durant cette étude, et sont groupés selon les lieux d'échantillonnage donnés figure 1 b; voir aussi Safran, 1987 b), et des vecteurs « espéces » (les abréviations des espéces sont données en Annexe).
2 18.75%
Tm
m
J.•.
"
Ac Hardelot. Canche
1 5G.39%
Boulogne
Pp
species according to the study area by the triangular diagram method, which showed the succession of dominant populations, and biometrical study using sizefrequency distributions to establish an arrival-departure calendar of cohorts, residence time and growth rates, were used to analyse the guild. The size-frequency distribution histograms are not presented in this paper. only the main results are given.
sole, were dominant in spring and in summer. Populations of dab and dragonet were domina ting the summer and autumn communities.
Sampling zones Sampling zones were analysed to show a possible shoreoffshore faunistical gradient, and to specify those faun-
RESULTS The fish community Sa
The general data matrix, with full reference to spatiotemporal sampling stations, species names and numbers of individuals caught per sampling trawl, is presented in Safran (1987 b). The faunistical composition of the samples showed qualitative homogeneity and high quantitative heterogeneity. To determine whether the homogeneity was due to a space-time division into sub-communities, identifiable by multivariate analysis, attention was focused on seasonal variations and sampling zones. The aim of these investigations was to determine a possible underlying coherence based on the observed heterogeneity.
s
1
9
{={
....
~
50
::~~-______J
shore{:: ~----__J---l 70~------------------~
offshore) ::
~==:::::;------,
... f9
Seasona/ variations
Wimereux
The predominant winter species were sprat (Sprattus sprattus, L.), encountered principally in the south, and harbour plaice. They were accompanied by dab, sand goby (Pomatoschistus minutus, P.), flounder (Platichthys flesus, L.) and herring. Following those, in order of numerical importance, were hook-nose (Agonus cataphractus, L.), unarmoured sea robin (Eutrigla gurnardus, L.) and poor cod (Trisopterus minutus, L.) (Fig. 2). Sole appeared in the summer of 1985 in the harbour zone, together with plaice. Sole replaced plaice as a dominant species of the community in the winter of 1985-1986. The main summer species were dab, offshore, and coastal dragonet (Cal/ionymus lyra, L.), associated with sand goby (Fig. 3 a, where the grouping in the plane of axes 1 and 3 were more obvious than in the plane of axes 1 and 2). No fundamental differences were found among the faunistical compositions of the different zones. The winter species (sprat, dab, plaice) were progressively replaced by dragonet, poor cod, hook-nose and sole; those four species, especially
l .,
Ochiai Index too% 50 n~==========~,-~--~--~----~--~
68
71
South
70
.•• ••
North ) ::
t==:J-------,
13 10
11
Figure 3 Summer (July 2, 1985). (a) Correspondence Analysis shows projections in the plane of axes 1 and 3 of "station" vectors and "species" tJectors. (b) and (c) show flexible c/ustering methods: dendrograms obtained by (b) quantitative similarity (Gower index), and by (c) qualitative similarity (Ochiai index). Été (2 juillet 1985). (a) Analyse Factorielle des Correspondances : projection dans le plan factoriel (1, 3) des vecteurs «stations» et «espèces». (b) et (c) :méthode de groupements agglomératifs à liens flexibles : dendrogrammes obtenus par (b) similarité quantitative (indice de Gower), et par (c) similarité qualitative (indice d'Ochiai).
100
VARIABILITY AND STRUCTURE IN A FISH NURSERY 1 oo
Frequency%
10
always verified. In fact, each sampling station resembled a micro-zone within an identical zone (which we can call daughter-zone), which itself belonged to the whole "foster mother": the nursery. There was a certain qualitative, quantitative and structural coherence within each "daughter-zone" and also within the coastal nursery, in spite of light fluctuations due to seasonal flows of populations (flows inherent to the species' bio-ethology), which carried sorne variations in the faunistical compositions, in the specifie diversity and in the structure of the sampled community. Only the distribution of numbers of individuals among leading species varied according to the "daughter-zone" without modification of the general faunistical composition or of the structure of the sampled fish community.
Figure 4 Boulogne-sur-Mer. Rankjrequenstation 3 cy diagram by smoothing method. Cumulative rank-frequency curves station 4 for stations 3 and 4. Boulogne-sur-Mer. Diagrammes rangs-fréquences globaux obtenus par lissage pour les stations 3 et 4.
r---~2~16~.1~2v-------------~a=
0.1
21.30%
0.01 L__....._....._....__._ 1 3 4 5
__._.............. 10 15 20 25
Rank
istical compositions with the smoothed RFD method, white FAC and numerical classification of the sampling dates were used to check the existence, or non-existence, of a north-south faunistical gradient. Throughout the study cycle, the harbour zone (stations 3 and 4, Boulogne-sur-Mer; Fig. 1) differed from the others. Whatever the season, this zone took on individual characteristics. This was probably due to its sheltered position, with extensive man-made piers offering protection against heavy hydrodynamic and sedimentary perturbations. The principal species of this multispecific nursery community were plaice (dominant), sole, dab, goby, dragonet and book nose, accompanied by sprat and poor cod during cold seasons (Fig. 4). For each sampling date, there was obvious association between harbour stations 3 and 4 and the coastal estuary station 8 (Fig. 3 a), and close qualitative and quantitative similarities (Fig. 3 b). Nevertheless, although the fish community was made up of the same group of species, the flatfishes seemed less dominant here. The seasonal flow of populations was more distinct. Winter sprat (accompanied by herring) was progressively replaced by summer pleuronectiforms (sole, plaice and dab): a conspicuous phenomenon in 1985. Dragonet, also, appeared during the summer of 1986. A north-south faunistical gradient was most noticeable during the winter of 1984-1985 and summer of 1985 (Fig. 3 c). From the autumn of 1985 it diminished progressively: the north stations (1 and 2: Wimereux) showed the same qualitative and quantitative characteristics as the south stations. This homogeneization was conspicuous in the summer of 1985 (Fig. 3 a), in the autumn of 1985, in the winter of 1985-1986 and in the summer of 1986. These results came from a numerical classification of samples, based on faunistical outlines. Generally speaking, this north-south gradient was not
68
1 24
Station9 2
173
25
Station10 Figure 5 Canche estuary. Correspondence Analysis shows project(ons in the plane of axes l and 2 of "species" vectors, and of "station" vectors for stations 8, 9 and lO: (a), (b) and (c), respective/y. Embouchure de la Canche. Analyse factorielle des Correspondances: projections dans le plan factoriel ( 1, 2) des vecteurs « espèces » et « stations » pour les stations 8 (a), 9 (b) et 10 (c).
101
P. SAFRAN
The presence of a shore-offshore faunistical gradient was confirmed for short distances of Jess than half a nautical mile. From the summer of 1985, it was conspicuous for the sampled stations. opposite the Canche estuary and Stella. From the autumn of 1985, the gradient was clear: coastal samplings showed a qualitative and quantitative homogeneity which distinguished them from deeper samples. This depth gradient was conspicuous among stations 8, 9 and 10 (Canche estuary). Station 8 took on individual characteristics compared with stations 9 and 10 during the winter of 1985-1986, the spring of 1986 and the summer of 1986 (Fig. 5). Concerning this depth-related gradient (one of the working hypotheses), except for the demarcation between coastal and offshore sampled stations opposite Canche and Stella, there was a good homogeneity, characteristic of each sampling area. Analysis of the curve shape obtained by a smoothed RFD (Fig. 6) for ali of the coastal samplings (micro-zones 1, 3, 5, 8 and Il), and for ali of the offshore samplings (micro-zones 2, 4, 6, 9 and 12), confirmed the existence of this homogeneity: the curve shapes of average RFD (Fig. 6a) and cumulative RFD (Fig. 6b) were similar and superimposable, and showed that the depth-related gradient was not really obvious in this study area. A detailed analysis of the curve obtained by a smoothed RFD for the whole system involving micro-zones, "daughter-zones", and "foster mother" provided an overview of the structural homogeneity and the faunistical composition of the community. Dab was the dominant species of this coastal nursery and the fish community, sampled along the Pas-de-Calais, was also made up of populations of dragonet, goby, plaice, sole, hook nose, sprat and poor cod (in decreasing order of importance). Analysis of ali the RFDs produced the leading species faunistical list, which constituted a description of the ichthyological community of the coastal multispecific nursery: the four dominant (or structural) species (in decreasing order of importance) were dab, dragonet, goby and plaice; and the four accompanying species were sole, sprat, hook nose and poor cod.
Spatio-temporal variability
A study of spatio-temporal variability in mutual percentages of the three species of the LPS guild highlighted the following points. Firstly, there was nearshore-offshore · faunistica1 gradient, with plaice in the dominant position for stations 1 (Wimereux), 5 (Hardelot, Fig. 7 a) and 8 (Canche estuary exit); and dab for the offshore stations 6 and 7 (Hardelot, Fig. 7 band c), and 9 and 10 (opposite the Canche estuary). This gradient was not visible for stations 11, 12 and 13 (Stella), where dab was also dominant ali along the study cycle. Secondly, harbour stations 3 and 4 (Fig. 8) presented almost the same seasonal evolution profiles among themselves. The plaice of the winter 1984-1985 was replaced by spring sole. Dab appeared as dominant population in the autumn of 1985 and in the winter 1985-1986. These results showed that, in the coastal nursery located along the Pas-de-Calais, dab, plaice and sole were mutually replaced, as follows: plaice sole
plaice
winter spring summer 1985
dab
dab
sole
autumn
winter spring 1986
Dab was confirmed as the dominant population of the LPS guild, and consequently of the community of sampled juveniles in this coastal nursery. Plaice had a preferential affinity for the near coast. The inshoreoffshore gradient was weil pronounced for the sampled stations opposite Hardelot and the Canche estuary. The 1 oo
Frequency %
1o o
Frequency %
shore offshore
Pp Cl
Prif···... 10
Sv
Pp···· ...
Ac sv ·-\ss
10
s \
The LPS guild Dab, plaice and sole were the most numerous species in this survey: 17540 individuals were caught, accounting for 43% of ali the sampledjuvenile fish (dab: 22%, plaice: 12% and sole: 9 %).
0.1
Figure 6 The nursery: a) average rank-frequency diagrams; and b) cumulative rank-frequency diagrarns for ali coastal and offshore samples. La nourricerie. a) diagrammes rangs-fréquences moyens; et b) globaux, obtenus pour l'ensemble des traits de côte et pour l'ensemble des traits du large.
0.1
cumulative R.F.D.
average R.F.D. 0.01
................__ 4 5
,___......_~
1
3
__._---~o_.....~
10
20
Rank
102
%
3
4
5
10
20
Rank
VARIABILITY AND STRUCTURE IN A FISH NURSERY
Figure 7 Hardelot: seasonal change in relative ahundance for dab, plaice and sole, on a triangular diagram for stations 5 (a), 6 (b) and 7 (c). Hardelot-plage. Évolution saisonnière des abondances relatives en limande, plie et sole, représentées par un diagramme triangulaire pour les stations 5 (a), 6 (b) et 7 (c).
0
Hardelot -1115
individualization of station 8 compared with stations 9 and 10 was confirmed, marked on the one hand by a 1ow frequency of plaice collected at stations 9 and 10, and on the other hand by large quantitative differences among these three stations.
Station 5
···--· 1118
The guild
The movement of individuals regularly crossing the nursery did not permit a study of growth parameters. Nevertheless, an analysis of size-frequency distribution histograms for each species of the LPS guild was performed to improve upon previous observations and to draw uPthe nursery's arrival-departure calendar. The follow-up of cohorts was not always obvious, and most of the time one principal mode was observed. Indeed, the nursery was only a temporary stopping-place where cohort followed cohort, each remaining in the nursery from its recruitment size to its departure size. An arriva1-departure calendar for the· nursery could be formulated from the biometrical analysis. Table 1 shows the successive arrivai and departure waves during the study period: dab and plaice arrived at the same time (February), followed by sole (March). A cohort of plaice was the first to leave the zone (July), as a second wave, composed of plaice and sole arrived (July), soon followed by dab (August). The first cohort of dab and sole left the nursery around the same time (October), followed subsequently by the second cohort of sole departed (January), and finally plaice and dab (February). The growth rates of each species, calculated from the recruitment dates, were almost similar for the two growth periods (Tab. 2). Growth of plaice was faster than that of dab, which was faster than that of sole.
50
Dab
G
Station 6
~
~~----------~----~~~~ 50
Dab
0
Station 7
~
~~----------~~----~~~
Figure 8 Boulogne-sur-Mer: seasonal change in relative abundance for dab, plaice and sole, on a triangular diagram for stations 3 (a) and 4 (b). Boulogne-sur-Mer. Évolutions saisonnières des abondances relatives en limande, plie et sole, représentées par un diagramme triangulaire pour les stations 3 (a) et 4 (b).
®
Boulogne-sur-mer
@
Station 3
- - - 1985 ------ 1988
50
50
Dab
Dab
Table 1 Schematical calendar of arrivai and departure in the nursery for dab, plaice and sole (numbers are the mean length in centimeters). Calendrier schématique des arrivées et des départs dans la nourricerie pour la limande, la plie et la sole (les chiffres indiquent les tailles en centimètres).
1985 J
Dab
5
Plaice Sole
5
1986 F
M
A
M
J
A
J
s
0
N
D
J
F
Mon th
19 22 7
17
Sole
2
Plaice
3
14
Dab
5
103
25 20
P. SAFRAN
Table 2 Mean growth rates for dab, plaice and sole (according to recruitment date). Vitesses de croissance calculées pour la limande, la plie et la sole, en fonction des dates de recrutement. Species
Mon th of arrivai
Growth rate (cm/month)
Dab
February August-September February July March July
1.75 2.14
Plaice Sole
Table 3 Size-classes used in Factorial Analysis of Correspondence (deduced from size-frequency distribution histogram studies published in Safran, 1987b).
Classes de tailles utilisées pour les Analyses Factorielles. Size (cm)
2.83
2.75 1.43 1.71
Although these three species followed each other in time, periods of coexistence were observed. Moreover, since the growth rates were different and the sizefrequency distribution histograms could be superimposed, there were periods of cohabitation of different sizes of juveniles. In order to confirm this cohabitation, and to follow the simultaneous growth of the three species, Factorial Analysis of Correspondence was performed on the size classes, as deduced from size-frequency distribution histogram studies and presented in Table 3. The factorial analysis (Fig. 9 a and b) executed on the data matrix crossing 14 sampling-station 3 by 20 size classes, showed that 32.50 % of the total inertia was absorbed by the first axis, which described the increasing size for dab, and contrasted E and F classes (structural classes of this axis) with the B class. Axis 2 (21.60 % of the inertia) described the parallel evolution of size for plaice and sole (Fig. 9 a), and contrasted A, B and C classes of sole and A and B of plaice with C and D classes of plaice. The representation obtained in the plane of axes 1 and 3 was interesting (Fig. 9 b). Additional information appeared along axis 3 (16.60% of the inertia), which described the increasing size for plaice and sole, and contrasted the D, E and F classes of sole with the D and E classes of plaice. These results showed that, for the small (3 to 6 cm) plaice and sole (the summer recruitment), the seasonal evolution profiles of growth were parallel, with sorne variations of these profiles for the medium-sized (7 to 12 cm) individuals. The small-sized dab contrasted with the small-sized plaice and sole, while the medium-sized dab presented a different seasonal evolution of growth from plaice and sole. The large individuals (13 to 30 cm) of the three species, however, evolved together.
Figure 9 LPS guild: Correspondence Analysis shows projections of the "size-classes" vectors and "samplingstation 3" vectors in the plane of axes 1 and 2 (a), and in the plane of axes 1 and 3 (b). The letters are the size classes defined in Table 3. La guilde LPS. Analyse Factorielle des Correspondances : projections des vecteurs « classes de tailles » et « prélèvement-station 3 » dans les plans factoriels (a) : 1, 2; et (b) : 1, 3. Les lettres représentent les classes de tailles données tableau 3.
Class
min.
max.
A B
1
4 6
5
c
7
D E .F G
9 Il
8 10 12 15 30
13
16
DISCUSSION The results as a whole demonstrated: 1) an identical qualitative composition: wherever it was situated in the nursery, nearly the same species composition was recorded ali through the study cycle; 2) the same smoothed RFD: curve shape obtained was almost similar and superimposable; 3) that only the ranks of species were permuted according to the seasons, the spatial gradients or at random. Insufficient definition concerning discernible states exists to conclude that there was one single "multispecific" community or that there were two or more. Creating models of groups of interacting species, Kerner (1957; 1959) establishes that, in a system including a large number of interacting species, the species fluctuate with dephased oscillations while keeping the same distribution of individuals among species ("quantitative structure"). The species can be permuted among themselves within this distribution. Maynard Smith (1975) contests this multispecific model and recalls that, in reality, an identified multispecific community always has the same rare species and the same abundant species. This reasoning is circular (Frontier, 1986): insofar as a multispecific community is defined by the permanence of proportions, then Kerner's model is pertinent and seems to be true for any group of species which are in competition for space and food, as appeared to be the case in this coastal multispecific nursery. Analysing ali the results by considering spatio-temporal variability, Safran ( 1987 b) came to the conclusion that one single community existed in this multispecific nursery, made up of populations of juveniles, which presented temporal and spatial fluctuations, determined or alea-
1
2 21.8%
316.6%
f-:-.
4!:,
Dab Plaice Sole
iA A
:' :' : '
1.
~I
··~'-·~"···o /
tl ,!
qi
~o~Dec.J
't
' 'Fe _6:
t: Wmter_,, . G\\• bJ
-
t----E•D WÎnteTF_.., _1·~ (Dec.J.__c~~~Autu,;.m
".(t.s:rg ~.
®
··c
104
1
··c s
Summer Spring
lé
-
ft
R"E.
" Sum:r1er
c
\
'
C"
1
"
@
;
o''lt:
~
32 5 · 7o
,
1 32.5%
\, WintidFeb.J
\E--6
~:
VARIABILITY AND STRUCTURE IN A FISH NURSERY
tory, in the dominance of species. These populations were not necessarily interconnected; but they might have been in the past or might become so in the future. The sampling step permitted description of the seasonal fluctuations in the local faunistical compositions (therefore describing the specifie diversity and structure of the sampled community according to the zone), without modification of the general faunistical composition or of the structure of the ichthyological community. The follow-up of temporal evolution for the individual RFD in station 3 of Boulogne-sur-mer (Fig. 10 a), for example, explicitly showed the faunistical fluctuations caused by successive replacements of the leading species in the first ranks. These seasonal flows of populations seemed to indicate a kind of "turnover" phenomenon at the structurallevel for the first ranks, albeit without modifying the general faunistical composition: i.e. the same species were always present. The four first ranks of the RFD-station 3 were occupied successively by populations of plaice, dab sole, accompanied by those of goby, dragonet and sprat (Fig. 10a). The same distribution was obtained by smoothing, as represented by the cumulative RFD in Figure 4. These populations were apparently unconnected. Principal Component Analysis, a comp1ementary numerica1 method, executed on the the contingency table crossing 26 species by 15 samplings (Fig. 10 b), confirmed that seasonal flows were made up of small groups of individuals. Populations of the rare species were weak1y interconnected (0. 65 > r > 0.50), but no significant correlation was found among the dominant (structural, in terms of factorial analysis) species of this community.
N 0
100
::;·
-
..
~
0
.,;
:;;
..;
:~
l:! .,;
~
:::
:g
,.;
. 0
..;
10
..
temporal evolution
Ss
Figure 10
The smoothed RFD methods (Safran, 1987 a) used here, particularly cumulative RFD, have proved useful in clarifying the structure and faunistical composition of a sampled community. For a few selective environment, the RFDs are convex when there is a random permutation of the leading species in the samples (Frontier, 1985). RFDs would be linear or concave, with a predominance of one or a few species, if the environment was highly selective (e.g. through seasonal turnover, pollution, etc.), and with the dominant few species likely to be distributed in the same order. Consequently, the permutability of species might be, like the curve shape of the RFD, a characteristic of only undisturbed systems.
Boulogne-sur-Mer (station 3): a) temporal evolution of individual rankfrequency diagrams; and b) Principal Component Analysis: projections in the plane of axes l and 2 of "species" vector [*=the flve flrst ranks of the RFD; correlation of species in the groups is 0.65 > r > 0.50]. Boulogne-sur-Mer (station 3). a) évolution temporelle des diagrammes rangs-fréquences individuels; et b) Analyse en Composantes
Principales : projections dans le plan factoriel (1, 2) des vecteurs «espèces» (les espèces des 5 premiers rangs des DRF sont marquées*; les groupes correspondent à des espèces moyennement corrélées entre celles : 0,65 > r > 0,50).
The complementary results obtained in the detailed study of dab, plaice and sole permitted acceptance of the existence of an LPS guild where, in the same locality, ail sizes of individuals, belonging to three taxonomically related species and having similar ecological resource requirements and foraging strategies, shared space and time without obvious exclusion of any of the three species. The distribution of individuals in space and time, which was a consequence of a regular flow of individuals passing through the nursery · and feeding the stocks with juveniles, allowed the maintenance of this cohabitation. It would be interesting, in a complementary survey, to verify whether these juveniles of ail sizes are, or are not, confronted with inter- and/or intra-specific competition phenomena.
Acknowledgements
The author is grateful to Serge Frontier for advice and helpful suggestions during this work, and to lan Gleadall for constructive criticism of this text. He thanks Elizabeth Harley for correcting the English draft. The comments of anonymous reviewers were appreciated. This paper is adapted from part of the author's doctoral dissertation at the University of Lille (France), and was completed white at the Tohoku University (Sendai, Japan) under the support of a Monbusho Fellowship from the Japanese Government. 105
P. SAFRAN
REFERENCES
Alderdice D. F. (1985). A pragmatic view ofearly life history.studies of fishes. Trans. Am. Fish. Soc., 114, 4, 445-451. Barbault R. (1981). Écologie des populations et des peuplements. Masson, Paris, 200 pp. Barbault R. (1983). Écologie générale. Masson, Paris, 224 pp. Barrett J. H. and C. M. Yonge (1958). Collins pocket guide to the sea shore. Collins, London, 272 pp. Bauchot M. L. and A. Pras (1980). Guide des poissons marins d'Europe. Delachaux-Niestlé, Paris, 427 pp. Benzecri J. F. et al. (1982). L'Analyse des Données. Il: L'Analyse des Correspondances. Dunod, Paris, 632 pp. Benzecri J.F. et al. (1984). L'Analyse des Données. 1: La Taxonomie. Dunod, Paris, 636 pp. Beverton R. J. H. and S. J. Holt (1957). On the dynamics of exploited fish populations. Fishery Invest., Ser. Il, 19, 1-533. Blondel J. (1979). Biogéographie et Écologie. Masson, Paris, 173 pp. Bougis P. et al. (1976). Océanographie biologique appliquée. L'exploitation de la vie marine. Masson, Paris, 320 pp. Burd A. C. (1962). Growth and recruitment in the herring of the southern Sea. Fishery lnvest., Ser. II, 23, 5, 1-42. Calot G. (1973). Cours de Statistique descriptive. Dunod, Paris, 173 pp. Cushing D. H. (1968). Fisheries Bio/ogy. A study in population dynamics, University of Wisconsin Press, Madison, US~, 200 pp. Dawson A. S. and A. S. Grimm (1980). Quantitative seasonal changes in the protein, lipid and energy content of the carcass, ovaries and liver of adult female plaice, Pleuronectes platessa, L. J. Fish. Biol., 16, 493-504. Frontier S. (1976). Utilisation des diagrammes rang-fréquence dans l'analyse des écosystèmes. J. Rech. océanogr., 1, 3, 35-48. Frontier S. (1985). Diversity and structure in aquatic ecosystems. Oceanogr. Mar. Biol. Ann. Rev., 23, 253-312. Frontier S. (1986). Étude de la diversité spécifique par le moyen des diagrammes rang-fréquences : modélisation, variabilité aléatoire. In: Biométrie et Océanographie, Société Française de Biométrie, editor. Gower J. C. (1971). A general coefficient of similarity and sorne of its properties. Biometries, 27, 857-871. Gross F. (1947). An experiment in marine fish cultivation. V: Fish growth in a fertilised sea loch (Loch Graiglin). Proc. R. Soc. Edinb., 114, 109-135. Hodgson W. C. (1957). The herring and its fishery. Routlcdge and Keagan P, London, 197 pp. Horeau J. C. and T. Monod (1973). Check List of the Fishes of the . North-eastern Atlantic and the Mediterranean. UNESCO, Paris, 2 vol., 683 pp. and 331 pp. Kerner E. Il. (1957). A statistica1 mechanics of intcracting biological species. Bull. math/ Biophys., 19, 121-146. Kerner E. H. (1959). Further considerations on the statistica1 mechanics of biological associations. Bull. math/ Biophys., 21, 217-255. Labourg P.J., C. Clos and G. Lasserre (1985). Résultats préliminaires sur la distribution des juvéniles de poissons dans un marais maritime du bassin d'Arcachon. Oceanologica Acta, 8, 3, 331-341. Lackey R. T. and L. A. Nielsen (1980). Fisheries management. Blackwell, London, 422 pp. Lance G. N. and W. T. Williams (1967). A general theory of classificatory sorting strategies. I: Hierarchical systems. Computer, 9, 373-380. Legendre L. and P. Legendre (1984 a). Écologie Numérique. 1: Le traitement multiple des données écologiques. Masson, Paris, 260 pp. Legendre L. and P. Legendre (1984b). Écologie Numérique. II: La structure des données écologiques, Masson, Paris, 355 pp. Lincoln R. J., G. A. Boxshall and P. F. Clark (1982). A dictionary of eco/ogy, evolution and systematics. Cambridge Univ. Press, London, 298 pp. Marchand J. et al. (1983). Contribution à l'étude des ressources benthodémersales de l'estuaire de la Loire : biologie et écologie des principales espèces. CSEEL, 4, 159 pp. Margalef R. (1977). Ecologia. Omega S.A., Barcelona, 951 pp. Margalef R. (1983). Limnologia. Omega S.A., Barcelona, 1010 pp. Maynard Smith J. (1975). Models in Eco/ogy. Cambridge Univ. Press, London, 146 pp. Mous B. J. and P. Dahlstriim (1981). Guide des poissons de mer e{ de pêche. Delachaux-Niestlé, Paris, 244 pp.
Ochiai A. (1957). Zoogeographie studies on the soleoid fishes found in Japan and its neighbouring regions. Bull. japan Soc. scient. Fish., 22, 526-530 (in Japanese). Peres J. M. (1972). La vie dans les mers. PUF, Que sais-je?, No. 72, Paris, 128 pp. Peres J. M. (1976). Précis d'océanographie biologique. PUF-Sup, 11, Paris, 246 pp. Pielou E. C. (1975). Ecological diversity. Wiley, New York, 165 pp. Quero J. C. (1984). Les poissons de mer des pêches françaises. Grancher, Paris, 394 pp. Ross D. A. (1977). Introduction to Oceanography. Prentice Hall International, 438 pp. Safran P. (1984). Contribution à la connaissance de la pêche accessoire dans la pêcherie artisanale de crevettes grises en baie de Canche. Mémoire de DEA, Université de Lille, 155 pp. Safran P. (1985). Stratégie d'échantillonnage de la pêche accessoire dans la pêcherie artisanale de crevettes grises (application à la baie de Canche, Pas-de-Calais). Rapport d'étude, Lille-IFREMER, 22 pp. Safran P. (1987 a). Étude d'une nurserie littorale à partir des pêches accessoires d'une pêcherie artisanale de crevettes grises (Crangon crangon, L.). Oceanologica Acta, 10, 2, 239-248. Safran P. (1987 b). Étude écologique d'une nourricerie littorale de poissons nectobenthiques le long du Pas-de-Calais par méthodes statistiques multivariables. Thèse de Doctorat en Biologie, Université de Lille, 104 pp. Shannon E. C. and W. Weaver (1963). The mathematical theory of communication. Univ. Illinois Press, Urbana, ll7 pp. Weinstein M. P. (1982). Commentary: a need for more experimental work in estuarine fisheries ecology. Northeast Gulf Sei., 5, 2, 59-64. Wheeler A. (1978). Key to the fishes of Northern Europe. Warne L.T.D., London, 380 pp.
Appendix Species abbreviations used in the data analysis (classification according to "C.L.O.F.N.A.M". Hureau and Monod, 1973). Abréviations des espèces utilisées pour les analyses factorielles. Lampe/ra fluviatilis L. f. R.b. Raja brachyura R.c. Raja clavata Clupea harenhus C.b. Spral/us spratus S.s. A. a. Anguilla anguilla Syngnathus acus S.a. G.m. Gadus morhua M. m. Merlangius merlangius Trisopterus minutus T.m. T.l. Trisopterus luscus C.m. Ciliata mustela Gaidropsarus vulgaris G.v. D.l. Dicentrarchus labrax Trachurus trachurus T. t. Spondilyosoma cantharus S.e. Hyperoplus lanceolatus H.l. Trachinus vipera T.v. Pomatoschistus minutus P. m. Callionymus tyra C.l. P.g. Pholis gunellus A. p. Atherina presbyter E.g. Eutrigla gurnardus T.b. Taurulus bubalis A.c. Agonus cataphractus C.lu. Cyclopterus lumpus L.m. Liparis montagui S.r. Scophthalmus rhombus P. ma. Psetta maxima H.p. Hippoglossoides platessoides P. p. Pleuronectes platessa L.l. Limanda limanda M. k. Microstomus kitt P.f. Platichthys flesus Solea solea (vulgaris) S. v. S.!. Solea lascaris Bug/ossidium luteum B.!.
106