Oct 2, 2013 - rock and fluid properties, such as suppression of bubble point .... z z h ln ln ln. +. +. = Ï. (7). Note that Eq. 7 is independent of and can be ...
SPE 166267 Compositional Modeling of Tight Oil Using Dynamic Nanopore Properties Yuhe Wang, SPE, Bicheng Yan, SPE, John Killough, SPE, Texas A&M University
Copyright 2013, Society of Petroleum Engineers This paper was prepared for presentation at the SPE Annual Technical Conference and Exhibition held in New Orleans, Louisiana, USA, 30 September–2 October 2013. This paper was selected for presentation by an SPE program committee following review of information contained in an abstract submitted by the author(s). Contents of the paper have not been reviewed by the Society of Petroleum Engineers and are subject to correction by the author(s). The material does not necessarily reflect any position of the Society of Petroleum Engineers, its officers, or members. Electronic reproduction, distribution, or storage of any part of this paper without the written consent of the Society of Petroleum Engineers is prohibited. Permission to reproduce in print is restricted to an abstract of not more than 300 words; illustrations may not be copied. The abstract must contain conspicuous acknowledgment of SPE copyright.
Abstract A typical tight oil reservoir such as the Bakken has matrix pore sizes ranging from 10 nm to 50 nm. At such small scales the confined hydrocarbon phase behavior deviates from bulk measurements due to the effect of capillary pressure. In addition, compaction of pore space can bring about order of magnitude changes for tight oil formation properties during pressure depletion further exacerbating these deviations. Without considering these facts a conventional reservoir simulator will likely not be able to explain the inconsistent produced GOR observed in the field compared to simulated results. The effect of these inaccuracies on ultimate recovery estimation can be devastating to the underlying economics. This paper presents a compositional tight oil simulator that rigorously models pressure dependent nanopore-impacted rock and fluid properties, such as suppression of bubble point pressure, decrease of liquid density, and reduction of oil viscosity as well as their interactions with pore space compaction. The cubic Peng-Robinson equation of state is used for phase behavior calculations. Capillary pressure is evaluated by standard Leverett J-function for porous media. Modifications to the stability test and two-phase split flash calculation algorithms are provided to consider the capillarity effect on vaporliquid equilibrium. The simulator can capture the pressure-dependent impact of the nanopore structure on rock and fluid properties. As a result, the problem of inconsistent GOR is resolved and the history matching process is greatly facilitated. It is shown that inclusion of these enhanced physics in the simulation will lead to significant improvements in field operation decisionmaking and greatly enhance the reliability of recovery predictions. Introduction The recent advances in massive hydraulic fracturing techniques have enabled the oil industry to economically extract hydrocarbon from ultra-tight, unconventional resources, such as shale gas, liquid rich shale and tight oil. The success in North America has stimulated the development of unconventional plays worldwide. For example, a marine shale play in southern China has showed large potential and attracted great attention (Wei et al. 2012; 2013a, b). However, despite the great success and potential, the understanding of fluid flow mechanism in shale and properties in confined pore space is still poor. The flow mechanism in the shale matrix is complicated by organic and inorganic portions of the matrix with distinct wettabilities. Yan et al. (2013 a, b, c, d) proposed a micro-model to model single-phase gas and two-phase gas-water flow in shale matrix blocks by considering different flow mechanisms in organic and inorganic nanopores. Yan’s work also upscaled the single-phase gas flow to well-scale modeling via the apparent permeability approach. On the other hand, the fluid properties in the confined nanopore space deviate from the corresponding bulk measurements in which zero vapor-liquid interface curvature is assumed. This assumption is generally held when the vapor-liquid equilibrium takes place in PVT cells. But, when the fluid is confined in pore spaces of nano-size, the significant interfacial curvature may cause a large capillary pressure difference between liquid and vapor phases. The effect of capillary pressure on vapor-liquid equilibrium is not new to the oil industry. A number of researchers have conducted both experimental and theoretical investigations with general conclusions that capillarity effect on vapor-liquid equilibrium is negligible for conventional reservoirs (Leverett 1941; Sigmund et al. 1973, 1982; Shapiro and Stenby 1997; Shaprio et al. 2000). Perhaps due to this reason, essentially all the current commercial simulators assume no pressure difference between vapor and liquid phases during flash calculations. However, ignoring capillarity in vapor-liquid equilibrium might not be a valid assumption for unconventional reservoirs. A typical tight oil reservoir such as the Bakken has matrix pore size ranging from 10 nm to 50 nm. At such small scales, the confined hydrocarbon phase behavior is believed to deviate from bulk measurements due to the extra capillarity effect. Rock wettability is another factor to consider when dealing with capillary pressures. Wang et al. (2012) performed a wettability
���
2
SPE 166267
survey of the Bakken formation and reported that the Bakken formation is oil-wet. A series of studies of confined fluid properties for a Bakken field shows that for this type of reservoirs, the bubble point pressure can be suppressed significantly by considering the capillary effect (Nojabaei et al. 2012; Honarpour et al. 2012; Pang et al. 2012; Du and Chu 2012; Chu et al. 2012). In addition, compaction of pore space can bring about order of magnitude changes for tight oil formation properties during pressure depletion further exacerbating these estimates. In their approaches, confined PVT tables are constructed from a separate modified flash calculation program and applied as inputs using a commercial reservoir simulator. It is evident that the effect of capillarity on hydrocarbon fluid vapor-liquid equilibrium is related to not only the fluid itself, but also the properties of formation rocks that contain the fluid. Unfortunately, a standard and reliable measurement of confined fluid properties in ultra-tight rocks is still challenging and not available. In this sense the findings and conclusions on this topic are still only supported by theoretical derivations or hypotheses (Du and Chu 2012). As quoted “The only concept assured is that the confined PVT properties are substantially different from the corresponding bulk properties and such variations have significant impact on well performance and ultimate recovery in unconventional reservoirs” (Du and Chu 2012). Reservoir models containing hydraulically fractured wells are needed to model production behavior and perform recovery predictions. Such models are complicated by massive hydraulic fractures. It is natural to realize that this kind of system contains fluid properties with confined and unconfined effects which need to be explicitly modeled. Besides, there is a contradictive effect for the rock compaction. Rock compaction makes the confinement greater, which will increase driving energy and mobility by decreasing viscosity. But it also reduces the permeability that will reduce the mobility. These factors must be considered when conducting reservoir studies for tight reservoirs. This paper incorporates the extended flash calculations into a fully compositional commercial simulator. The pore space can be dynamically updated during pressure depletion via rock compaction tables. In this way, a more rigorous treatment is included to model the combined effects. Approach In this section, we provide the model of vapor-liquid equilibrium with capillarity effect, extended vapor-liquid flash calculation with implementations and evaluation of capillary pressure for tight oil reservoirs. Capillarity Effect on Vapor-Liquid Equilibrium (VLE) The fundamental of capillarity effect on vapor-liquid equilibrium (VLE) is the separation of two multicomponent phases by a curvature interface. Such effects can be readily revealed by Eqs. 1 and Eqs. 2 (the equality of the chemical potentials in the liquid and vapor phases). P L and PV are the phase pressures of liquid and vapor phases, respectively. Pc is the capillary pressure between them. i is the chemical potential of component i at the respective temperature, phase pressure and mole fraction. m is the number of components in the system. Note that temperature is generally not affected by capillary pressure. Capillary VLE is present in the porous rocks of hydrocarbon reservoirs (often associates with adsorption), though it is generally ignored since this effect is negligible for conventional reservoirs.
PV P L Pc
T, P , x T, P , y i 1, 2, , m L i
L
V i
V
(1) (2)
Eq. 1 and 2 provide the full constitutive system for capillarity VLE. Fundamentally, the magnitude of capillary pressure is determined by the geometry of the capillary system and the wettability of media surfaces. It should be noted that this constitutive system is established based on continuous bulk vapor and liquid phases, which are separated by a curvature interface. However, the vapor and liquid phases are not necessarily continuous in porous rocks, especially for ultra-tight reservoirs, such as Bakken. Nevertheless, it can be shown that the pressures and compositions in different isolated vapor or liquid regions are equal when the system is at equilibrium (Bedrikovetsky 1993). 1. Extended VLE Flash Calculation The VLE flash calculation implemented in compositional simulators generally involves a stability test and a two-phase split calculation. The stability test is first performed to test if a single phase is stable. Only under the circumstance that the single phase is tested to be unstable, the two-phase split calculation then will be performed. Michelsen (1982 a, b) provides the algorithm details and implementation practices for the isothermal stability test and the two-phase split calculation. However, the algorithm and implementation is developed and designed assuming the vapor and liquid phase pressures are equal, i.e. no capillary pressure. Essentially, the flash calculation in all current commercial simulators applies this assumption. In the following, the classic stability test and two-phase split algorithm is extended to consider the capillary pressure effect. 1.1 Stability test using Gibbs free energy approach
��
SPE 166267
3
This section shows how the standard stability test based on tangent plane distance analysis can be extended to consider the capillarity effect. For the original system to be stable, Eq. 3 should hold. f i y is the fugacity of the incipient phase and f i z is the fugacity of the original system. If the original system is liquid, then the incipient phase is vapor and vice versa. The detailed derivations to obtain Eq. 3 can be found in Michelsen (1982 b). m
y ln f y ln f z 0 i
i
i
i
(3) Since f i z zi i z P L
f i y y i i y P
(4)
V
(5)
where i is the fugacity coefficient. After substituting Eq. 4 and 5 into Eq. 3, we then have Eq. 6.
y lny y P lnz z P M
V
i i
i
L
i i
i
y ln y ln y ln z ln z ln P M
i
i
i
i
i
V
ln P
L
0
(6)
i
Eq. 6 shows that the capillary term ( ln PV ln P L ) is naturally incorporated into the equilibrium test. This term is normally ignored for conventional compositional simulation because of the fact that the capillary pressure between vapor and liquid phases is small. But, when the pore spaces are confined into nanoscales, the capillary pressure should not be ignored. In implementation, it is more convenient to let hi ln z i ln i z ln P L
(7)
Note that Eq. 7 is independent of y and can be pre-computed. Let Yi e k y i , where k ln y i ln i y hi ln PV . Then, ln Yi ln i y hi ln PV 0
(8)
Eq. 8 is the final form used to test stability. The fugacity coefficient is calculated using the cubic Peng-Robinson equation of state. Successive substitution and/or the Newton-Raphson method can be used to solve this nonlinear equation. 1.2 VLE two-phase split calculation The VLE two-phase split calculation is based on equality of chemical potentials or fugacities and mass balance (Eqs. 9 – 12 and Eqs. 1 – 2). F is number of moles of original system or feed. L and V are the number of moles of liquid and vapor phases, respectively. xi and y i are the mole fraction of liquid and vapor phases. zi is the mole fraction of the feed phase. To solve this set of equations, we need another mass balance constraint, Eq. 12, where K i is the equilibrium ratio or K-value , defined as in Eq. 13. Eq. 12 is called Rachford-Rice equation.
Fzi xi L yiV
(9)
m
x
i
1
(10)
i
1
(11)
i m
y i
���
4
SPE 166267
m
Ki 1zi
1 K 1 0 i 1
Ki
(12)
i
yi iL P L xi iV PV
(13)
It can be seen from Eq. 13 that the capillarity comes in place in terms of the modified K-value. Note that conventionally the K-value is evaluated as K i iL iV by assuming the liquid and vapor pressures are equal. This set of equations can be solved using successive substitution and/or the Newton-Raphson method. 2. Evaluation of Capillary Pressure for Tight Porous Media The previous two sections provide the extended VLE flash calculation considering the capillarity effect. To complete the solution process of stability test and VLE split calculation, we need to evaluate the capillary pressure. Capillary pressure can be evaluated by the well-known Young-Laplace equation (Eq. 14) for a sufficiently narrow tube. Nojabaei et al. (2012), Du and Chu (2012), Chu et al. (2012), Honarpour et al. (2012) and Pang et al. (2012) applied this approach to calculate the capillary pressures.
Pc
2 cos r
(14)
Noted, Nojabaei et al. (2012) points out that, for tight oil rock, the capillary pressure computed using the Young-Laplace equation is much less than the actual measurement because of the very low interfacial tension value calculated by MacleodSugden correlation (Pederson 2007). This finding reveals the importance of having reliable capillary pressure and/or interfacial tension measurements for shale/tight rocks. Since the system dealt with is saturated porous rock, it is more reasonabe to apply the Leverett J-function approach (Eq. 15), which is based on measured reference capillary pressures. J S
Pc S k
cos
(15)
During the iteration process of stability test and VLE split calculations, capillary pressure values are looked up using the saturation results of the previous iteration. Although Eq. 15 is derived strictly only for the ideal case, it is commonly applied to other types of rocks. In this paper, it is assumed that this standard approach also applies to ultra-tight reservoir rocks. The dependence or scaling factor J S is supposed to be known for a particular type of rock, which comes from lab measurement. Unfortunately there are no welldocumented capillary pressure measurements for the Bakken reservoir yet. The porosity of the Bakken reservoir is fixed as 0.06. Based on Kozeny-Carman equation (Kozeny 1927; Carman 1937) and correlations from Nelson (1994), the corresponding permeabilities and pore radius is provided in Table 1. Based on the capillary pressure data of a similar rock from Crain’s petrophysical handbook, the corresponding capillary pressures are listed in Table 1 also. Note that, the capillary pressures are obtained from various correlations without any calibration for Bakken rock. However, these values should be close to real values, at least based on hypothesis. Dynamic Compaction of Nanopores It is natural to expect that, as the pore space being compacted during pressure depletion, the impact of pore size on the fluid properties becomes more significant. By considering pore size reduction due to reservoir depletion, the reservoir is likely to experience even more reduction in bubble point pressure throughout the life of the reservoir. Such further reduction in bubble point pressure will keep the fluid in single-phase oil phase with reduced viscosity and density and compressibility, which will favor the driving energy and flow capacity. On the other hand, the compaction will reduce the permeability of the rock, which of course will decrease the mobility. Thus, compaction has two contradictory effects. The combined effect will be determined by rigorous compositional simulation with compaction. Dynamic rock compaction generally can be incorporated into a reservoir simulator via rock compaction tables. A table look-up approach is performed to obtain permeability reduction ratios when the pressure is updated. For the Bakken reservoir in this study, the rock compaction table used is listed in Table 2.
SPE 166267
��
5
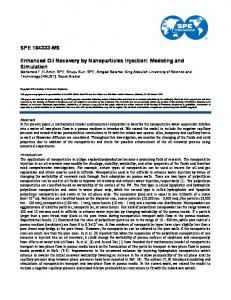
Results Confined Phase Behavior This section provides the results of confined phase behavior of Bakken oil. The compositional data of Bakken oil are listed in Table 3 and 4 (Nojabaei et al. 2012). At the reservoir temperature around 240 °F, Bakken oil resides in the black oil region. Hence, the flash calculation is simplified to the case that the original or feed system is single-phase oil and the saturation pressure is the bubble point pressure. Fig. 1 shows the bubble point pressure lines of Bakken oil with capillarity effect at different pore space sizes, ranging from 10 nm to 50 nm. The bubble point pressures are evaluated using rigorous stability tests. Capillary pressures are calculated using the Young-Laplace equation, Eq. 14. As mentioned in the previous section, this approach could underestimate the capillary pressure to a large extent. Using this approach, for a 10 nm pore size, the suppression of bubble point pressure is about 140 psi, which is much lower than suspected initially. For porous rock, the Leverett J-function approach should be more appropriate to evaluate capillary pressures than Young-Laplace equation. Besides, this approach provides a way to calibrate against measurements of particular rock. In the following, the Leverett Jfunction approach is applied for all cases. Table 5 provides the bubble point pressures calculated using the Young-Laplace equation and the Leverett J-function. We can see there are significant differences between the two approaches. It also suggests the importance of having good quality capillary pressure data for the Bakken reservoir. The physical implication of bubble point pressure suppression is that more light components remain in the oil phase compared to a system having unsuppressed bubble point pressure at the same temperature and pressure. Apparently, this in turn reduces the viscosity and density. Table 6 provides the confined viscosities and densities at 240 °F and 1500 psia. The Lorenz-Bray-Clark correlation is used for the viscosity calculation. Clearly, viscosity and density are reduced as the pore space is confined from 50 nm to 10 nm. The implication is that confinement increases the driving energy and flow capacity of the tight oil reservoir, which favors the extraction of more liquid. Otherwise, the light component will easily escape from the oil phase leave the more valuable but heavier components (C4-C12) underground. To evaluate the effect of confined fluid properties on production behavior and reservoir recovery, reservoir simulation is conducted using a fully compositional commercial simulator with extended VLE flash calculation routines. Reservoir simulation A fully compositional commercial simulator (Dean and Lo 1988; Tang and Zick 1993; Fleming 2012) is extended to accommodate the extended VLE flash calculation. The aim is to rigorously model the effect of capillarity influenced VLE on production behavior and recovery prediction, while also including the effect of dynamic reservoir compaction. This investigation may be helpful in improving the understanding of abnormal production behavior observed in the Bakken field, such as long-lasting, relatively constant producing GOR even when the pressure near well has dropped below bubble point pressure (measured in lab). The reality is further complicated by multistage hydraulic fractured wells. Fluid is only confined in the tight matrix while being unconfined in fractures. The whole system will have different compositional models for matrix and fractures. Fortunately, the extended VLE flash approach can model the whole system in a uniform fashion. The capillary pressure for the grid representing fractures will be very small since the porosities and permeabilities for these grids are much higher than matrix grids. Thus, the fluid properties in fractures can be maintained unconfined, while fluid in matrix will be confined. 1. 1D core size model We first provide an example using a 1D core size model, with 1 grid in the X and Z direction and 50 grids in the Y direction. The model has dimension of 0.5 ft in the X and Z direction and 3.28 ft in the Y direction. The model contains no fractures with homogenous initial permeability (0.002 md) and porosity (0.06). The reservoir temperature is 240 °F and initial pressure is 6840 psi. A sink is assigned to the first grid. Bottom-hole pressure is constrained at1500 psi. Initially, production is controlled by oil flow rate. Three scenarios are modeled: 1) no capillary pressure effect on VLE; 2) with capillary effect on VLE but without reservoir compaction; 3) with capillary effect on VLE and reservoir compaction. The production responses are plotted in Fig. 2 and Fig. 3. Fig. 2 provides the cumulative oil production along with pressure decline and Fig. 3 provides the producing GOR along with pressure decline. Clearly, cumulative oil productions of cases considering the capillarity effected VLE are higher than the case without considering the capillarity effect. It also reveals that although reservoir compaction makes the oil phase thinner and bubble point pressure lower, its cumulative oil production is less than the case considering only the capillarity effect. This should be attributed to the fact that the reduction of mobility due to reduction of permeability offsets the increase of mobility due to reduction of viscosity. It also suggests that reservoir compaction should be considered in every reservoir simulation study for tight oil. The producing GOR of cases considering capillarity effects is much lower than the case without capillarity effect. In addition, the dynamic reservoir compaction further lowers the producing GOR. 2. Horizontal well model with multiple hydraulic fractures
6
��
SPE 166267
The second case is a horizontal well model with multi-stage hydraulic fractures (Fig. 4). The 35X67X10 model has extent of 1000 ft in both X and Y direction and 20 ft in Z direction. Four hydraulic fractures are equally spaced in the Y direction. The production is initially constrained by oil flow rate and later by bottom hole pressure of 1900 psi. As discussed in previous sections, this model contains fluid with both confined and unconfined properties. The two fluid systems are modeled in a unified fashion using distinct capillary pressures. The well production is mainly fed by the hydraulic fractures, which are in turn fed by the tight matrix. Note that the production and GOR are calculated at in-situ reservoir conditions when fluid enters the well. Although fluid that is directly connected to the well is unconfined, the volume of such fluid is very small comparing with its feed source, which is the confined fluid contained in tight matrix. Similarly, three scenarios are compared. We can see the case with capillarity effect and no compaction has the highest cumulative oil production. The case with capillarity and compaction effect is in the middle. The pressure decline rate of the compaction case is smaller than the other two cases. Note that for the 1D core size model, the pressure decline rate of compaction is the highest. This might be because that for a hydraulic fractured well, the production is controlled by the fractures. The compaction reduced the conductivity of fracture, which makes the pressure decline smaller than the cases without considering compaction. It is interesting that there is a stepwise increase and decrease of the producing GOR of the case with compaction. This might be because that, as the reservoir being compacted, the bubble point pressure is reducing. Conclusions The capillary pressure effect on the vapor-liquid equilibrium of reservoir fluids becomes significant when the pore size reduces to the nano scale. For oil-wet reservoirs, the confinement effect suppresses the bubble point pressure, which in turn favors the single-phase oil production by increasing the driving energy and decreasing the viscosity of the fluids. In order to model such confined fluid properties in reservoir simulation, the VLE flash calculation algorithms need to be extended to consider capillary pressure difference between vapor and liquid phase. Leverett J-function should be the approach used to evaluate capillary pressures for tight oil. However, good quality capillary pressure measurements are needed to calibrate the scaling factor for a particular tight oil reservoir, such as Bakken. For tight oil reservoirs, which do not have pressure maintenance strategies, oil production is believed to be quite sensitive to reservoir compaction during pressure depletion. Thus, rock compaction should be considered in any reservoir study of tight oil. Rock compaction further reduces the pore size. As a result, the confinement effect becomes larger. However, compaction also reduces the permeability. Thus, simulation studies should consider the combined effect of capillarity and compaction on production. Acknowledgements The first author would like to thank Zhiqiang Gu of Landmark/Halliburton for insightful discussions about the content and Dominic Camilleri of Landmark/Halliburton for careful reading of the manuscript. References Bedrikovetsky, P. 1993. Mathematical theory of oil and gas recovery: with applications to ex-USSR oil and gas fields. Kluwer Academic Publishers, The Netherlands. Carman, P.C. 1937. Fluid flow through granular beds. Transaction, Institution of Chemical Engineers, London, 15: 150–166. Chu, L., Ye, P., Harmawan, I., Du, L., Shepard, L. 2012. Characterizing and simulating the non-stationariness and nonlinearity in unconventional oil reservoirs: Bakken application. SPE paper 161137 presented at the SPE Canadian Unconventional Resources Conference, Calgary, Alberta, Canada, Oct 31 – Nov 1. Dean, R.H. and Lo, L.L. 1988. Simulation of naturally fractured reservoirs. SPE RE 3(2): 633-648. SPE-14110-PA. Fleming, G. 2012. Private communication. Du, L. and Chu, L. 2012. Understanding anomalous phase behavior in unconventional oil reservoirs. SPE paper 161830 presented at the SPE Canadian Unconventional Resources Conference, Calgary, Alberta, Canada, Oct 31 – Nov 1. Honarpour, M.M., Nagarajan, N.R., Organgi, A., Arastech, F. Yao, Z. 2012. Characterization of critical fluid, rock, and rockfluid properties-impact on reservoir performance of liquid-rich shales. SPE paper 158042 presented at the SPE Annual Technical Confference, San Antonio, Texas, USA, Oct 8 -10. Kozeny, J., 1927. Ueber kapillare leitung des wassers im boden. Sitzungsber Akad. Wiss., Wien, 136(2a): 271-306. Kuila U., Prasad M., 2011. Surface area and pore-size distribution in clays and shales. SPE paper 146869 presented at the SPE Annual Technical Conference and Exhibition, Denver, Colorado, USA, Oct 30 – Nov 2. Michelsen, L.M. 1982a. The isothermal flash problem. Part I. Stability. Fluid Phase Equilibria, 9: 1-19. Michelsen, L.M. 1982b. The isothermal flash problem. Part I. Phase-split calculation. Fluid Phase Equilibria, 9: 21-40. Nelson, P.H. 1994. Permeability-porosity relationships in sedimentary rocks. The Log Analyst, pp 38 - 62 Nojabaei, B., Johns, R.T. and Chu, L. 2012. Effect of capillary pressure on fluid density and phase behavior in tight rocks and shales. SPE paper 159258 presented at the SPE Annual Technical Conference and Exhibition, San Antonio, Texas, USA, Oct 8 – 10. Pang, J., Zuo, J.Y., Zhang, D., Du, L. 2012. Impact of porous media on saturation pressure of gas and oil in tight reservoirs. SPE paper 161143 presented at the SPE Canadian Unconventional Resources Conference, Calgary, Alberta, Canada, Oct 31 – Nov 1.
���
SPE 166267
7
Pedersen, K.S. and Christensen, P.L. 2007. Phase behavior of petroleum reservoir fluids. CRC Press, Taylor & Francis Group. Tang, D.E. and Zick, A.A. 1993. A new limited compositional reservoir simulator. SPE paper 25255 presented at the SPE Symposium on Reservoir Simulation, New Orleans, LA, USA, Feb 28 – Mar 3. Wang, D., Butler, R., Zhang, J., Seright, R. 2012. Wettability survey in Bakken shale with surfactant-formulation imbibition. SPE RE 15(6): 695-705. SPE-153853-PA. Wei, C., Wang, H., Sun, S., Xiao, Y., Zhu, Y., Qin, G. 2012. Potential investigation of shale gas reservoirs, southern China. SPE paper 162828 presented at the SPE Canadian Unconventional Resources Conference, Calgary, Alberta, Canada, Oct 31 – Nov 1. Wei, C., Qin, G., Guo, W., Yan, B., Killough, J.E., Wang, H., Liu, H. 2013a. Characterization and analysis on petrophysical parameters of a marine shale gas reservoir. SPE paper 165380 presented at the SPE Western Regional & AAPG Pacific Section Meeting, Monterey, CA, USA, Apr 19 – 15. Wei, C., Wang, Y., Qin, G., Li, Q., Killough, J.E. 2013b. Experimental and numerical studies on the micro-fractures and its significance toward production of shales: a case study. SPE paper 165327 presented at the SPE Eastern Regional Meeting, Pittsburgh, PA, USA, Aug 20 – 22. Yan, B., Wang, Y., and Killough, J. 2013a. Beyond dual-porosity modeling for the simulation of complex flow mechanisms in shale reservoirs. SPE paper 163651 presented at the 2013 SPE Reservoir Simulation Symposium, The Woodlands, TX, USA, Feb 18 – 20. Yan, B., Killough, J., Wang, Y. et al. 2013b. Novel approaches for the simulation of unconventional reservoirs. Paper presented at the Unconventional Resources Technology Conference, Denver, Colorado, USA, Aug 12 – 14. SPE, AAPG, SEG URTeC 1581172. Yan, B., Alfi, M., Wang, Y., Killoug, J.E. 2013c. A new approach for the simulation of fluid flow in unconventional reservoirs through multiple permeability modeling. SPE paper 166173 presented at the SPE Annual Technical Conference and Exhibition, New Orleans, LA, USA, Sep 30 – Oct 2. Yan, B. 2013. A Novel Approach for the Simulation of Multiple Flow Mechanisms and Porosities in Shale Gas Reservoirs. M.S. Thesis, Texas A&M University, College Station.
Table 1: Pore radius, permeability and capillary pressure Pore Raduis (nm)
Premeability (md)
Capillary Pressure (psi)
50
0.0070
102.20
40
0.0046
127.75
30
0.0027
170.33
20
0.0012
255.50
10
0.0003 511.00 Table 2: Rock compaction table of Bakken Pressure Change (psi)
Premeability Reduction Ratio
-5180
0.489
-4450
0.500
-3700
0.511
-2960
0.532
-2220
0.588
-1480
0.675
-740
0.791
0
1.0
Table 3: Bakken oil composition data
���
8
SPE 166267
Component
C1 C2 C3 C4 C5-C6 C7-C12 C13-C21 C22-C80
C1 C2 C3 C4 C5-C6 C7-C12 C13-C21 C22-C80
Mole Fraction
Critical Pressure (psia)
Critical Temperature (°R)
0.36736 0.14885 0.09334 0.05751 0.06406 0.15854 0.07330 0.03704
667.80 707.80 616.30 550.70 461.29 363.34 249.61 190.12
343.04 549.76 665.68 765.32 875.48 1053.25 1332.10 1844.49
Acentric Factor
Mole Weight
0.0130 0.0986 0.1524 0.2010 0.2684 0.4291 0.7203 1.0159
16.04 30.07 44.10 58.12 78.30 120.56 220.72 443.518
Table 4: Bakken oil binary interaction table C3 C4 C5-C6 C7-C12
C1
C2
0 0.0050 0.0035 0.0035 0.0037 0.0033 0.0033 0.0033
0.005 0 0.0031 0.0031 0.0031 0.0026 0.0026 0.0026
0.0035 0.0031 0 0 0 0 0 0
0.0035 0.0031 0 0 0 0 0 0
0.0037 0.0031 0 0 0 0 0 0
0.0033 0.0026 0 0 0 0 0 0
Parachor
74.8 107.7 151.9 189.6 250.2 350.2 590.2 1216.8
C13-C21
C22-C80
0.0033 0.0026 0 0 0 0 0 0
0.0033 0.0026 0 0 0 0 0 0
Table 5: Bubble point pressure of Bakken oil at 240 °F Pore Radius (nm) Bubble Point Pressure (psi) Young-Laplace Leverett J-Function 50 2766 psi 2512 psi 40 2761 psi 2450 psi 30 2751 psi 2345 psi 20 2732 psi 2145 psi 10 2641 psi 1588 psi Table 6: Confined fluid properties of Bakken oil at 240 °F and 1500 psia Bubble point Pressure (psi) Viscosity (cp) Density (lb/ft3) No Capillary Effect 2788 0.41 39.17 50 nm 2512 0.363 38.5 40 nm 2450 0.351 38.35 30 nm 2345 0.331 38.04 20 nm 2145 0.29 37.3 10 nm 1588 0.18 34.4
���
SPE 166267
9
3500
3000
Pressure, psia
2500
No Capillary Effect
2000
r = 50 nm 1500 r = 40 nm r = 30 nm
1000
r = 20 nm 500 r= 10 nm 0 80
130
180
230 280 Temperature,oF
330
380
430
Fig. 1: Bubble point pressure lines of Bakken oil using Young-Laplace equation
��
10
SPE 166267
Cum Oil Production, STB, No Capillary Effect Cum Oil Production, STB, With Capillary Effect, No Compaction Cum Oil Production, STB, With Capillary and Compaction Effect Pwf, psia, No Capillary Effect Pwf, psia, with Capillary Effect, No Compaction Pwf, psia, With Capillary and Compaction Effect
8000
1.4
7000
1.2
6000
1
5000
0.8
4000
0.6
3000
0.4
2000
0.2
1000
0
Pwf,psia
Cum Oil Production, STB
1.6
0 0
0.5
1
1.5
2
2.5
3
3.5
4
4.5
5
Time, Days
Fig. 2: Cum oil production and pressure depletion of 1D model GOR, SCF/STB, No Capillary Effect
GOR, SCF/STB, With Capillary Effect
GOR, SCF/STB, With Capillary and Compaction Effect
Pwf, psia, No Capillary Effect
Pwf, psia, With Capillary Effect, No Compaction
Pwf, psia, With Capillary and Compaction Effect
5000
8000
4500
7000
4000 GOR, SCF/STB
3000
5000
2500
4000
2000
3000
1500
2000
1000
1000
500
0
0 0
0.5
1
1.5
2
2.5
3
3.5
4
4.5
Time, Days
Fig. 3: Producing GOR and pressure depletion of 1D model
5
Pwf,psia
6000
3500
SPE 166267
���
Fig. 4: Top view of a horizontal well model with four hydraulic fractures (scale in feet)
11
��
12
SPE 166267
Cum Oil Production, STB, With Capillary Effect, No Compaction Cum Oil Production, STB, With Capillary and Compaction Effect Pwf, psia, No Capillary Effect Pwf, psia, With Capillary Effect, No Compaction Pwf, psia, With Capillary and Compaction Effect
1.40E+07
7000
1.20E+07
6000
1.00E+07
5000
8.00E+06
4000
6.00E+06
3000
4.00E+06
2000
2.00E+06
1000
0.00E+00 0
500
1000
1500
2000
0 2500
Time, Days
Fig. 5: Cum oil production and pressure depletion of horizontal well model
Pwf, psia
Cum Oil Production, STB, No Capillary Effect
Cum Oil Production, STB
��
SPE 166267
13
GOR, SCF/STB, No Capillary Effect GOR, SCF/STB, With Capillary Effect, No Compaction GOR, SCF/STB, With Capillary and Compaction Effect Pwf, psia, No Capillary Effect Pwf, psia, With Capillary Effect, No Compaction Pwf, psia, With Capillary and Compaction Effect 9.00E+03 8.00E+03 6000
7.00E+03
5.00E+03 4.00E+03
4000
3.00E+03 2.00E+03 1.00E+03 0.00E+00
2000 0
500
1000
1500
2000
TIME DAYS
Fig. 6: Producing GOR and pressure depletion of horizontal well model
Pwf, psia
GOR. SCF/STB
6.00E+03