11 Oct 2017 - Reliable flare stack monitoring becomes significantly crucial to ensure no unburned toxic or waste gas is
This template is provided to give authors a basic shell for preparing your manuscript for submittal to a meeting or event. Styles have been included to give you a basic idea of how your finalized paper will look before it is published. All manuscripts submitted will be extracted from this template and tagged into an XML format; standardized styles and fonts will be used when laying out the final manuscript. Links will be added to your manuscript for references, tables, and equations. Figures and tables should be placed directly after the first paragraph they are mentioned in. The content of your paper WILL NOT be changed.
SPE-187257-MS Automatic Flare Stack Monitoring R. Janssen, N. Sepasian – Siqura B.V., The Netherlands
Copyright 2017, Society of Petroleum Engineers This paper was prepared for presentation at the 2017 SPE Annual Technical Conference and Exhibition held in San Antonio, Texas, 9-11 October 2017. This paper was selected for presentation by an SPE program committee following review of information contained in an abstract submitted by the author(s). Contents of the paper have not been reviewed by the Society of Petroleum Engineers and are subject to correction by the author(s). The material does not necessarily reflect any position of the Society of Petroleum Engineers, its officers, or members. Electronic reproduction, distribution, or storage of any part of this paper without the written consent of the Society of Petroleum Engineers is prohibited. Permission to reproduce in print is restricted to an abstract of not more than 300 words; illustrations may not be copied. The abstract must contain conspicuous acknowledgment of SPE copyright.
Abstract Flare stacks must be continuously monitored to assure ignition of released gases during the plant operation. The process of flare detection is generally referring to detecting the presence or absence of a flare. Flare monitoring adds the capability of tracking the size of the flare to this process. By setting lower and upper monitoring boundaries an alarm can be generated if the flare becomes too small or too big. Reliable flare stack monitoring becomes significantly crucial to ensure no unburned toxic or waste gas is released into the atmosphere causing environmental issues and possible fire hazards. It also gives the operator an extra handle to optimize the production process. In this paper, we introduce an automatic flare detection and monitoring system. Our user-friendly system is computer vision based, plug-and-play and designed as a built-in part of the camera. Taking advantage of the geometrical properties of the flare as well as temporal information obtained by video analytics, we create a monitoring system robust to various parameters such as wind direction. Based on our knowledge, we are the first to present an automatic flare stack monitoring system with flare size tracking and automatic event signaling. Our presented system has been tested for live monitoring in the Rotterdam Botlek area, The Netherlands. The preliminary results illustrate a reliable system which is free of false alarms.
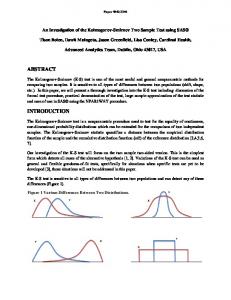
Introduction A flare stack is a gas combustion device used in industrial plants such as refineries, chemical- and natural gas processing plants and at oil or gas production sites. Flare stacks provide a safety mechanism by combusting gasses resulting from over-pressure of plant equipment. They are also used during (partial) plant startups and shutdowns for the planned combustion of gases. Hence, it is vital that the flare stack is functioning properly at all times. A typical flare stack is depicted in Figure 1.
2
SPE-187257-MS
Figure 1 - Flare stack in the Rotterdam Botlek area, The Netherlands. The process of flare detection is generally referring to detecting the presence or absence of a flare, similar to what heat sensors can do. Flare monitoring adds the capability of continuously determining the level of thermal radiation emitted from flares which allows to measure the size of the flare. With this added capability, an operator has an extra handle to optimize the production process; a flare that becomes bigger than usual signals that excess gas is released in the production process. This may be intentional, but may also be the result of a non-optimal refinery process. To verify that the flare stack is functioning properly, the traditional ways include the installation of heat sensors nearby the base of the flare and a human observer. The former lacks the ability to monitor the actual size of the flare, while the latter is obviously labor intensive and might cause missed or false alarms due to the observers’ limited attention span and the dependency on weather conditions. Besides, the sensor based measurement is limited to the nearby regions and no profile of the flare can be measured. Due to wind direction changes, multiple sensors must be mounted around the tip of the flare stack (Fatih Erden). Consequently, computer vision based systems have gained strong attention in order to overcome these issues. Visible light images were used during one of the early efforts to build such a system. However, these images are mostly usable for flare stack monitoring during night time or for black smoke detection during daytime. Another downside of these systems is that some flares are invisible on regular cameras because of the type of gas that burns, for example methanol, or because combustion is clean (Verstockt; Osman Gunay). Recently, the use of infrared band cameras has shown to leverage the robustness and accuracy of automatic flare detection and monitoring by overcoming the previously mentioned issues (A. Enis Çetina). The main advantages of this type of infrared images are the decreased weather dependency and reliable monitoring during both day and night. It also adds the capability to create accurate temperature maps of the monitored flare (Toreyin; Verstockt). Besides, they are not expensive anymore. This paper is organized as follows. In Section I, the flare modelling and parameters of thermal sensors are described. The image processing and enhancement models are explained in Section II. The detection and tracking algorithm for flare stack monitoring has been elaborated in Section III. Section IV describes the optimization process of parameter settings and implementation. In Section V, the event generating process for the automatic flare stack monitoring is being discussed. The experiment setup and the test results are shown in Section VI. Finally, in Section VII we conclude and discuss the future work.
SPE-187257-MS
3
I. Flare Modelling The temperature of the hottest part of a flare ranges from approximately 1000 ˚F (572 ˚C) up to about 3000 ˚F (1648 ˚C) and it radiates energy in different wavelengths (Chamberlain; De-Faveri). If combustion is clean, the flare may not be visible to the naked eye nor on regular cameras. To visualize both regular and invisible flares, cameras equipped with Long Wave Infrared (LWIR) sensors can be used. Such cameras are sensitive to a different range of the spectrum which allows them to register the heat emitted by a flare (Leahey). The LWIR sensor used in the camera depicted in Figure 2 is of a radiometric uncooled microbolometer type, is sensitive to wavelengths from 7.5 to 13.5µm, has a resolution of 640x512 pixels at 7.5 frames per second and detects temperature differences as small as 50 mK. An optional pan-tilt mounting system allows for accurate positioning of the flare within the camera viewport.
Figure 2 - LWIR camera in ATEX pan-tilt housing. In Figure 3, a possible application of our flare stack monitor is depicted in which it automatically influences the amount of waste gas that is transported to the flare stack.
Figure 3 – Illustration of the application of our flare stack monitor.
4
SPE-187257-MS
II. Image Processing model The heat energy radiated by the flare is registered by the LWIR sensor. A processing unit in the camera converts the sensor data to a grayscale or color image that can be displayed on a regular computer screen. The sensor outputs a grid, comparable to pixels from a regular camera. The range of each pixel is much higher (14-bit) than what can be displayed on a regular computer screen. A histogram equalization algorithm is used to map the 14-bit values to 8-bit grayscale values (Joung-Youn Kim). Let L be the number of possible intensity values range. At 14-bit, L ranges from 0 to 16383. The input data from the sensor is ��,� . Histogram equalization is done using a cumulative denstity function. �� =
�� � �� ������ ���� ��������� �
,
����� �� � �� ������
n = 0, 1, … L – 1.
The histogram equalized image h will be then defined by �
!," ℎ�,� = ⌊�� − 1� ∑�#$ �� ⌋.
Note ⌊ ⌋ is the floor operator. The outcome contrast will be improved using the mentioned histogram equalization operator.
Image sharpening is done by the unsharp masking approach (Polesel). The edge features &�,� are calculated from the histogram equalized input image ℎ�,� as follows: &�,� = ℎ�,� – '�,� . Where '�,� is a smoothed version of ℎ�,� , using a Gaussian low-pass filter (Haddad and Akansu), '�,� = ( * ℎ�,� , G is a Gaussian kernel with kernel size 5x5, mean = 0 and ơ = 2. * is a convolutional operator. Finally, the sharpened image )�,� is obtained by adding the edge features to the histogram equalized input image ℎ�,� : )�,� = ℎ�,� + &�,� . Absolute thresholding is used to segment regions that have a similar temperature.
III. Computer Vision Model Monitoring the flare involves detecting its presence or absence and tracking its size. In our proposed computer-vision based model, temperature thresholds can be set for detection of the flare within the viewport of the camera. The flare is separated from the background using temperature thresholding and being traced continuously. To achieve this, in each frame the position and size of the extracted flare is compared with the result computed for the previous frames. If these are close enough, the current position and size of the extracted flare are updated. This process is known as object tracking (Xi Li).
SPE-187257-MS
5
To enhance the visualization of the temperature profile of the flare, false colors are added which represent the different temperature regions within the flare. To add these colors, each 14-bit sensor pixel value is used as an index to an RGB color table. In our experiments, the lower temperature threshold was set to 572 ˚F (300 ˚C) so everything above that temperature will show in false colors. Two zones around the monitored flare are declared; the “active” zone in which the flare should always be present, and the “too large” zone in which the flare should never appear. Both zones have parameters that control when an event is generated. E.g. a very short burst into the “too large” zone may not be a reason to signal an event. However, if the flare appears in that zone for a prolonged period of time, it is considered to be too large and an event is sent to the backend system. This timing parameter was set to 5 seconds for our tests. See Figure 4 for an example. In this figure, the temperature profile of the flare is also clearly visible. “too large” zone
“active” zone
Figure 4 – Illustration of zones of interest and temperature based thresholding. The model supports several other parameters such as direction and life time to suppress unwanted events caused by e.g. passing helicopters, the sun, or other heat sources. Setting up the zones in the viewport is user-friendly. The operator can simply drag three basic points which make up two half-circle shaped zones around the flare. The rest of the shapes is generated automatically. Figure 5 shows the flare stack monitor configuration process using our software. In the left pane, live camera streams and previously made recordings are listed. In the middle pane, the parameters for the “active” and “too large” zones can be set, while the right pane shows the actual footage of the flare with overlayed zones. The “active” zone can generate three events, namely “ignited”, “ok” and “extinct”. The “too large” zone generates two events, namely “exceeding limit” and “within limit”.
6
SPE-187257-MS
Figure 5 – Our proposed flare stack monitor configuration framework.
IV. Optimization Process To allow for optimal detection and tracking of the flare, the LWIR sensor was carefully calibrated so its output represents the flare temperature profile as accurate as possible. For calibration, the sensor was aimed consecutively at three flat black bodies with accurately determined temperature, emissivity and reflectivity. The measurements were compared with the internal sensor response and its output was calibrated accordingly. After this process, the camera was moved to the testing area and pointed at one of the selected test flares. In the camera, parameters were set to compensate for flare emissivity (85%), possible background radiation (68 ˚F), atmospheric conditions (98% transmittance) and reflection and absorption of thermal radiation by the germanium window of the camera housing (98%). The enhancement parameters, described in Section II, have been tuned manually to balance between maximum detail and a pleasantly visible image with acceptable noise level. This noise is caused by the amplification of noise originating from the LWIR sensor and its readout circuit. Our detection and tracking algorithms were initially developed on a regular Intel i7-based PC using pre-recorded videos. The resulting code was converted and hand-optimized to run with real-time performance on an in-house developed embedded 1 GHz Digital Signal Processor (DSP) platform inside the camera. The DSP load was about 40%. Running the full detection and tracking algorithms inside the camera has several benefits as listed below: • • • • • •
Raw sensor data is directly available with almost zero latency. No high-bandwidth network connections are required for streaming sensor data; basically, only events need to be sent to a backend system. Event signaling can be done directly using contact closures which are integral part of the camera, hence the solution is insensitive to network dropouts. Low power requirements (typically 7 Watt). Scalability; every camera is a complete solution. No large servers needed in a server room.
SPE-187257-MS
7
V. Automatic Flare Stack Monitoring Process Using our detection engine and tracker, the direction and growth or shrinking of the flare can be automatically monitored and compared with the zones set by the operator. The flare state is communicated to the backend system. Dedicated events or alarms are generated if the flare extincts, ignits, becomes larger than a predefined size or shrinks back within limits. This state and these events can be attached to contact closures which are part of the camera. Events can also be transmitted over the network via the ONVIF protocol1. These events can be presented to the operator through the backend system (e.g. SCADA2). In this way, the operator is alarmed quickly if the flare extincts or becomes too large and can act immediately upon that. With our automatic flare stack monitoring system taking care of the detection and diagnosis phase depicted in Figure 6, process safety is tremendously increased.
Figure 6 - Process safety time.
VI. Experiments For developing, testing and optimization of the algorithms, raw sensor data from five flares was recorded with an Intel i5 based laptop in the Rotterdam Botlek area under different weather conditions. By mounting a 100 mm telelens on the LWIR sensor, a safe distance between the flares and the recording equipment could be maintained. Using neutral density filters suitable for the LWIR band, flare size reduction and extinction was simulated by coverting part of the flare in the image. Additional tests on a real extincing and ignited flare have been performed during a controlled plant maintenance phase. The recorded data was initially processed offline during algorithm development. Once the algorithms were running in the camera, we set it up in the same area and tested it on live flares. A laptop was needed for zone setup, viewing and event reception purposes only. Using the neutral density filters, the “ok”, “extinct” and “ignited” events were tested. By setting the “too large” zone tightly around the flare, both the “exceeding limit” and “within limit” events were tested as well. With all events, the expected contact closures were activated and the matching ONVIF events were sent to our backend system by the camera. All tests were thus successful. Figure 7 shows the setup of one of our field tests.
1 2
https://www.onvif.org/ https://www.engineersgarage.com/articles/scada-systems
8
SPE-187257-MS
Figure 7 – Field test setup.
VII. Conclusion and Future Work We introduced a computer vision inspired framework for automatic flare stack monitoring using the LWIR sensor technology. To our knowledge this is the first automatic framework that performs such function. The model has been optimized to perform on an embedded platform. The reliability of our proposed algorithms has been tested for live flare stack monitoring in the Rotterdam Botlek area. Our system works as expected and is an excellent addition to the existing sensors mounted near the flare. A permanent setup for all-year round testing is required to complete the reliability test. In several cases, it may be beneficial to add a visible light camera to detect e.g. black smoke. Depending on the precense of black smoke, such a dual camera setup could automatically control the amount of steam that is fed to the flare stack to increase the combustion efficiency. The development of algorithms that can take advantage of dual camera input is regarded as future work. For applications like black smoke detection, machine learning techniques may also become beneficial to learn which features from which camera are important. With different zone shapes, the developed framework is also usable for other applications like hotspot-, fire- or machine overheat detection. A dual camera setup could for example serve as an automatic forest fire detection system.
References A. Enis Çetina, Kosmas Dimitropoulosb, Benedict Gouverneurc, Nikos Grammalidisb, Osman Günaya, Y. Hakan Habiboǧlua, B. Uǧur Töreyind, Steven Verstockte. "Video fire detection – Review." Digital signal Processing (2013): 1827-1843. Chamberlain, G. A. "Developments in Design Methods for Predicting Thermal Radiation from Flares." Chemical Engineering, Research and Design 65.5 (1987): 299-309. De-Faveri, D. M., Fumarola, G., Zonato, C. and Ferraiolo, G. "Estimate Flare Radiation Intensity." Hydrocarbon Processing 64.5 (1985): 89-91. Fatih Erden, B. Ugur Toreyin, E. Birey Soyer, Ihsan Inac, Osman Gunay, Kivanc Kose, A. Enis Cetin.
SPE-187257-MS
9
"Wavelet based flickering flame detector using differential PIR sensors." 53 (2012): 13-18. Haddad, R.A. and A.N. Akansu. "A class of fast Gaussian binomial filters for speech and image processing." IEEE Transactions on Signal Processing 39.3 (1991): 723 - 727. Joung-Youn Kim, Lee-Sup Kim and Seung-Ho Hwang. "An advanced contrast enhancement using partially overlapped sub-block histogram equalization." IEEE Transactions on Circuits and Systems for Video Technology 11.4 (2001): 475-484. Leahey, D. M., and Davies, M. J. E. "Observations of Plume Rise from Sour Gas Flares." Atmospheric Environment 18.5 (1984): 917-922. Osman Gunay, Behçet Ugur Toreyin, Kivanc Kose, and A. Enis Cetin. "Entropy-Functional-Based Online Adaptive Decision Fusion Framework With Application to Wildfire Detection in Video." 21 (2012): 2853-2865. Polesel, Andrea, Giovanni Ramponi, and V. John Mathews. "Image enhancement via adaptive unsharp masking." IEEE transactions on image processing 9.3 (2000): 505-510. Steven Verstockt, Alexander Vanoosthuyse, Sofie Van Hoecke, Peter Lambert, and Rik Van de Walle. "Multisensor Fire Detection by Fusing Visual and Non visual Flame Features." (2010). Toreyin, B.U. Fire Detection Algorithms Using Multimodal Signal and Image Analysis. Ankara-Turkey: Bilkent University, Department of Electrical and Electronics Engineering, 2009. Verstockt, Steven. Multi-modal Video Analysis for Early Fire Detection. Gent: Faculteit Ingenieurswetenschappen en Architectuur - Universiteit Gent, 2012,October. Xi Li, Weiming Hu, Chunhua Shen, Zhongfei Zhang, Anthony Dick, Anton van den Hengel. "A Survey of Appearance Models in Visual Object Tracking." Transactions on Intelligent Systems and Technology (TIST) 4.4 (2013).