SPECOM'2006, St. Petersburg, 25-29 June 2006
Speaker Change Detection via Binary Segmentation Technique and Informational Approach Jindrich Zdansky Department of Electronics & Signal Processing Technical University of Liberec, Halkova 6, 461 17 Liberec 1, Czech Republic
[email protected]
Abstract This paper deals with problems of speaker change detection in acoustic data. The aim is to identify the optimal number and position of the change-points that split the signal into shorter sections belonging to individual speakers. In particular we focus on so-called binary segmentation technique, which is well-known in mathematical statistics, but it has never been used in speaker change detection task. We prove its applicability on this task in simulated tests with artificially mixed utterances ans also in tests done with 30 hours of real broadcast news (in 9 languages). Further we review commonly used approach to speaker change detection via Bayesian Information Criterion and we suggest theoretically more tenable solution.
show that mathematically correct approach to hypotheses testing brings better results than the commonly used one.
2. Single Change Point Problem Let’s assume that the captured audio stream is an observation of a Gausian process in cepstral domain. In the scope of mathematical statistics the decision whether observed series contains change-point or not can be solved by hypotheses testing: the null hypothesis claims that the observed data were produced by stationary Gaussian process while the alternate hypothesis claims that the underlying process is Gaussian, but stationarity was violated by a change of its parameters [7]. 2.1. Hypotheses testing
1. Introduction Automatic transcription of broadcast news, political debates, talkshows or meetings is one of the most promising applications of modern voice technologies. Essential parts of the state of the art transcription systems are the speaker change detection unit, segment identification unit, speech transcription unit, and the textual post-processing unit, among others. Speaker change detection unit helps in the task of automatic transcription in several ways, primarily it splits the continuous stream of spoken data into shorter parts. In the optimal case these segments are utterances spoken by a single speaker. Utilizing information about speaker identity provided by segment identification unit, accuracy of final transcription can be significantly increased by selecting an adequate speaker (or gender) specific acoustic model. Another practical advantage is that segmented acoustic stream can be parallelly processed by a cluster of computers, i.e. transcription can be finished much faster. A survey of the studies of speaker change problem shows that there are several popular approaches to solve this task and almost all are based on hypotheses testing via Bayesian Information Criterion [2, 1, 3, 4, 5, 6]. In this paper we would like to show that this method is not often used exactly in accordance with hypotheses testing theory. The whole branch of mathematical statistics is devoted to the detection of change point in a random process. It solves two cardinal problems. The first one is so-called single change-point problem and it’s solution is based on hypotheses testing. The second problem is called multiple change-point problem and it’s straightforward solution has not been proposed yet [7]. Multiple change-point problem is therefore often solved by the decomposition into sequence of single change-point tasks and the most popular method in statistics is known as a binary segmentation procedure or technique. In this paper we prove applicability of binary segmentation technique on the task of speaker change detection. Further we
386
Let’s assume that X = {X1 , X2 , . . . , XT } are independently and normally distributed random vector variables with parameters (mean, covariance) θi = (µi , Σi ), i = 1 . . . T . To check the point t in observation x = {x1 , x2 , . . . , xT } whether it is a true change-point or not we are supposed to test following hypotheses [8]: H0 : θ1 = θ2 = · · · = θT
(1)
H1 : θ1 = · · · = θt 6= θt+1 = · · · = θT ,
(2)
versus
where d < t < T − d and d is random vector dimension. 2.2. Informational Approach One possibility how to solve previously stated problem of hypotheses testing is to employ Schwarz Information Criterion (SIC), which is sometimes called Bayesian or Schwarz-Bayes Criterion. Information criterions are useful for choosing proper model order. Specifically, SIC takes form [9]: ˆ + D log T, D = 1, 2, . . . SIC(D) = −2 log ℓx (θ)
(3)
ˆ is maximum value of likelihood function, D is where ℓx (θ) model order and the best models order is the one, which provides minimal SIC value. Under hypotheses H0 , H1 SICs are: SIC(H0 )
=
SIC(H1 )
=
ˆ + T d + D log T (4) T d log 2π + T log |Σ| ˆ 1 | + (T − t) log |Σ ˆT | T d log 2π + t log |Σ +T d + 2D log T,
(5)
where model order can be computed as D =d+
1 d(d + 1), 2
(6)
SPECOM'2006, St. Petersburg, 25-29 June 2006
ˆ |Σ ˆ 1 |, |Σ ˆT | d is dimension of random variable and |Σ|, are covariances of data {x1 , . . . , xT }, {x1 , . . . , xt }, {xt+1 , . . . , xT }, respectively. Natural idea how to decide about change-point is to simply compare SIC(H0 ), SIC(H1 ) and accept hypothesis H1 iff SIC(H1 ) < SIC(H0 ), i.e. when Λt = SIC(H0 ) − SIC(H1 ) > 0,
The problem is, that this equation can’t be used in practice, because there is no possibility how to control its behavior (no free parameter). Common approach is to multiply term D log T by some penalty weight λ. This is not fortunate solution, because Λt is test statistics, not a deterministic variable. Doing such a modification, we can not claim that we are testing hypotheses. From hypotheses testing theory issues that the right form is (9)
i.e. Λt must be higher than some threshold value λ to accept change point t as a true change point. For the case with unknown change point t, we define max
d that should be checked for possible change point. Furthermore we define arcs connecting node with a point t ∈< a, b >. Arcs denote computation of equation (for FTSIC): ˆ − (t − a + 1) log |Σ ˆ a| GF T SIC (t|a, b) = (b − a + 1) log |Σ| ˆ −(b − t) log |Σb | − D log (b − a + 1) (11) and for FPWSIC: GF P W SIC (t|a, b) = (12) ˆ − (t − a + 1) log |Σ ˆ a | − (b − t) log |Σ ˆ b| (b − a + 1) log |Σ| D log (b − a + 1)
position=0 active=0
position=N active=1
1
2
ˆ − t log |Σ ˆ 1 | − (T − t) log |Σ ˆ T | − D log T. (8) Λt = T log |Σ|
Λtˆ =
0
(7)
After substituting SICs by equations 4 and 5 we get
Λt = SIC(H0 ) − SIC(H1 ) > λ,
level
do for each node if is active assign arcs from position of node-1 to node get arc with maximum value of G if G>threshold establish new node in the next level else active =0 ----copy current node to the next level --level++; while there is any active node
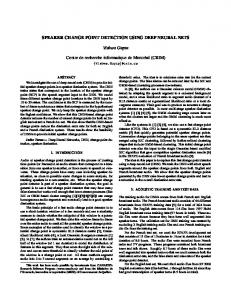
Figure 1: Simplified outline of the multiple change point detection algorithm - binary segmentation technique.
Choosing the arc that maximizes G(t|a, b) we get the most probable change point location tˆ. If the condition G(tˆ|a, b) > λ is fulfilled, new node is established. The threshold λ is the only free parameter of this algorithm, which needs to be estimated. Simplified algorithm outline and its graphical form are depicted in Figure 1. 3.1. Estimation of the optimal threshold λ Important merit of binary segmentation is that it is easy to train. We build the tree shown in Figure 1 only once with a small value of threshold λ. While building the tree we must remember true values of λ for each node and then it is easy to get change points for each λi > λ very fast.
4. Experimental part 4.1. Signal Processing In all the experiments described in this section we have used 16 kHz sampled waveforms converted into MFCC features. Similarly as in speech recognition, we have used features computed every 10 ms using 25 ms window, but only first 12 ones, i.e. without energy, delta and acceleration coefficients. 4.2. Segmentation performance metrics At first, change-points computed by algorithm are linked to the real ones if and only if computed change-point is the closest to the real one and vice versa. In addition, if the distance between them is smaller than 1 second, we call these changepoints linked. There are three statistical measures commonly
387
SPECOM'2006, St. Petersburg, 25-29 June 2006
used to acquire the segmentation accuracy: R=
H 2RP H ;P = ;F = , N H +I R+P
(13)
where R,P ,F are called recall, precision and F-rate. Symbols N , H, I, D denote true, linked, inserted, deleted number of change-points respectively. 4.3. Statistical significance test To be able to compare two speaker change detection systems operating on identical data, we proposed following significance p p test. Let EA , EB denote number of errors produced by system A,B respectively. Index p represents p-th tested item of the database. The number of errors of the system X is given by p p p EX = DX + IX .
(14)
Now we define random variable Z = EB − EA
(15)
and we assume that Z has normal distribution. Then significance test could be formulated as: hypothesis H0 claims that system A is the same as system B, i.e E(Z) = 0 while hypothesis H1 claims that system A is not the same as system B, i.e. |E(Z)| > 0. For normal distribution, mathematical expectation of Z is asymptotically equal to its mean value µ. So the problem consists of following hypotheses testing: H0 : µ H1 : µ
= 6=
0 0.
This test has statitistcs (e.g. [11]) √ P z¯ r(z) = , P 1 ¯)2 p=1 (zp − z P −1
q P
(16) (17)
approximately 20000 speaker segments. Overwhelming majority of speaker segments was clear, i.e. without background noise changes. To estimate the optimal penalty weight λ, we used F-rate measure as a criterion. In the case FTSIC the maximum F -rate value was achieved for threshold λ = 570 and in the case of FPWSIC the maximum value of F -rate was obtained for the penalty weight λ = 2.05. These settings were used for testing the algorithm on the testing part of the database and it provided us with very satisfactory results. These results are summarized in Table 1 and better performance of FTSIC approach is confirmed by significance test. Set Method FTSIC FPWSIC
1 P
P [%] 96.73 95.49
Histogram of time-alignment errors of correctly found changes shows (see Fig. 2), that 2/3, 95 % of change-points was determined with error less than 40 ms, 250 ms, respectively. To convert audio signal into cepstral space we used MFCC features computed every 10 ms. Because 42.5 % of all correctly found changes were determined with error less than 10 ms, 42.5 % of change points can be considered to be found with pinpoint accuracy.
50 40 30 20
(19)
10
p=1 0
is arithmetical average of values zp . For large P , r(z) can be considered to have normal distribution R ∝ N (0, 1). The system A is believed not to be the same in performance as the system B on significance level α, if P {R ≥ r(z)} ≤ α.
50
100
150 [ms]
200
250
300
Figure 2: Histogram of time-alignment errors of correctly found speaker change points obtained from experiments on artificially mixed database.
(20)
In this work we used the significance level α = 0.1 %. 4.4. Artificially mixed database To verify the algorithm described in previous section we performed experiments on artificially mixed database, because our original database was not large enough to obtain results with some statistical credibility. Thus we have squeezed individual speaker segments from our broadcast news (BN) database, which contains approximately 5000 segments from several hundreds of speakers. These segments were aligned by Viterbi forced-alignment to eliminate silences and non-speech events from the beginning and from the end of every segment. Produced pure speech segments were randomly concatenated to form new testing and training databases. Each of them contained one hundred 10 minutes length artificial BN records, i.e.
388
Test R [%] 95.73 92.92
(18)
P
p
F [%] 96.05 94.19
[%]
Xz
Train Fmax [%] 96.32 94.39
Table 1: Comparison of two approaches to single change point detection in speaker change detection task on simulated artificially mixed data. Specifically, FPWSIC is common approach, FTSIC is theoretically more tenable one. Multiple change point detection was performed via binary segmentation technique.
where P is number of tested items and z¯ z¯ =
λ 570 2.05
There are only negligible differences between FTSIC and FPWSIC in histograms of time-alligment errors, because to obtain the most likely change point we are supposed to solve the same equation for both of them:
h
i
ˆ a | + (b − t) log |Σ ˆ b | . (21) tˆ = arg min (t − a + 1) log |Σ ∀t
4.5. COST 278 BN database The data used in this experiment have been collected as a part of a pan-European Broadcast News Database by 10 institutions collaborating in the European COST 278 action on Spoken Language Interaction in Telecommunication. At present, the database comprises 10 parts: Slovak (SK), Slovenian (SI,SI2), Galician (GA), Portuguese (PT), Dutch (BE), Greek (GR), Croatian (HR), Hungarian (HU) and Czech (CZ). Each participant has
SPECOM'2006, St. Petersburg, 25-29 June 2006
prepared 3 hours of its national broadcasts news records from public and/or private TV stations. More detailed description could be found in the paper [12]. Because number of database items was not large enough to obtain credible results, training and control parameter λ tuning was performed on one national data set and testing was done on the remaining data sets. This procedure was repeated several times for all available national sets. Results of these experiments are summarized in Table 2. Except of BE, HR, HU and SK national sets, all other experiments proved better performance when FTSIC method was used. These results were also confirmed by statistical significance test. In the case of training on HR set, we obtained significantly worse results of system using FTSIC method. For BE, HU and SK national sets, no differences between tested methods were found. Language BE CZ GA GR HR HU PT SI SI2 SK Average
FTSIC F-rate[%] 71.27 72.43 71.34 72.43 65.87 70.53 71.74 71.99 72.57 67.26 70.52
FPWSIC F-rate[%] 71.85 67.69 68.33 71.94 68.39 71.07 71.58 71.44 71.87 68.93 70.31
Table 2: Comparison of two approaches (FPWSIC vs. FTSIC) to single change point detection in speaker change detection task on real data (COST 278 broadcast news database). To reveal all change points binary segmentation technique was used.
Binary segmentation technique has the merits of detecting the number of change points and their positions simultaneously and saving a lot of computation time. When the algorithm is implemented efficiently and it is run on common PC with 2.4 GHz processor, then the segmentation process takes approximately 5 % of the audio record length. Another advantage is that this method has the only control parameter (threshold) which should be tuned and this parameter can be easilly determined by the binary segmentation technique from training data.
6. Acknowledgments This work was partly supported by project 1QS108040569 of the Grant Agency of the Czech Academy of Science.
7. References [1]
Chen, S. S., Eide E., Gales F. J. M., Gopinath A. R., Kanvesky D., Olsen P., Automatic Transcription of Broadcast News, IBM T. J. Watson Research Center, Yorktown Heights, NY 10598, 2001.
[2]
Chen, S. S., Gopalakrishnan, P. S., Speaker, Environment and Channel Change Detection and Clustering via the Bayesian Information Criterion, IBM T.J. Watson Research Center, Yorktown Heights, NY, Technical Report, 1998.
[3]
Delacourt P., Wellekens, C. J., DISTBIC: A Speakerbased Segmentation for Audio Data Indexing, In Speech Communication, Vol. 32, No 1-2,2000.
[4]
Vandecatseye A., Martens, J. P., A Fast, Accurate and Stream-based Speaker Segmentation and Clustering Algorithm, Eurospeech 2003, Geneva (Switzerland) , 2003.
[5]
Zdansky, J., David, P., Nouza, J., An Improved Preprocessor for the Automatic Transcription of Broadcast News Audio Stream, In Proceedings of 8th International Conference on Spoken Language Processing ICSLP 2004, JeJu (South Korea), 2004.
[6]
Zhou, B., Hansen, J. H. L., Efficient Audio Stream Segmentation via Combined T 2 Statistic and Bayesian Information Criterion, IEEE Transaction on Speech and Audio Processing, Vol. 13, No. 4, July 2005.
[7]
Lauro, C., Antoch, J., Vinzi, V. E., Saporta G., Multivariate Total Quality Control, Physica-Verlag, Heidelberg, 2002.
[8]
Chen, J., Gupta, A. K., Parametric Statistical Change Point Analysis, Birk¨auser, Boston, 2000.
[9]
Schwarz, G., Estimating the Dimension of a Model, Annals of Statistics, Vol. 6, pp. 461–464, 1978.
5. Conclusions In this paper we have proved that application of binary segmentation technique on speaker change point detection task brought satisfactory results. Proposed algorithm is capable of segmenting long lasting sound records into shorter acoustically homogeneous parts belonging to individual speakers. The algorithm employs a hierarchical decision strategy that recursively splits the considered part of signal into two parts at the point where the probability of the potential change in signal characteristics is high enough. Probability of change is measured via hypotheses testing where potential change is considered to be a violation in stationarity of Gaussian process. Further we have proved that application of theoretically more tenable approach to hypotheses testing brought a little bit better results. The performance of this algorithm was evaluated on the speaker segmentation task in simulated tests with artificially mixed utterances and also in tests done with 30 hours of real broadcast news (COST 278 BN database in 9 languages). In simulated tests, the proposed method missed 4.27 % of all existing speaker changes and 3.27 % of the detected speaker changes were found as false alarms, which can be considered as excelent result in the quite complex task. Evaluation of binary segmentation technique on real BN database brought rather worse results than in tests on simulated data, but achieved Frate score 70.52 % is fully comparable to other segmentation systems that have been tested on this database.
[10] Vostrikova, L. Ju., Detecting Disorder in Multidimensional Random Processes, Soviet Mathematics Doklady, 1981. [11] Lehmann, E. L., Testing Statistical Hypotheses, 2nd edition, Wiley & Sons, New York, 1986. [12] Vandecatseye, Martens, Neto, Meinedo, Garcia-Mateo, Dieguez, Mihelic, Zibert, Nouza, David, Pleva, Protopapas, Papageorgiou, The COST278 pan-European database for research Broadcast News transcription, LREC 2004, Lisbon, Portugal, 2004.
389