This test signal consists of the signal of the wanted channel and all possible worst-case interfering signals that, according to the standard, the system must be.
Specification for Digital Channel Selection Filters in a Bluetooth Capable HiperLAN/2 Receiver Fokke Hoeksema, Roel Schiphorst, Kees Slump University of Twente, Department of Electrical Engineering, Laboratory of Signals and Systems, P.O. box 217 - 7500 AE Enschede - The Netherlands Phone: +31 53 489 2770 Fax: +31 53 489 1060 E-mail: {f.w.hoeksema,r.schiphorst,c.h.slump}@el.utwente.nl Abstract— In this paper we first briefly describe how the analog part of the channel selection function for a HiperLAN/2 receiver can be used as part of the channel selection function for a Bluetooth receiver. Thereafter we proceed to specify the overall requirements for the Bluetooth channel selection function. Part of these requirements are fulfilled by analog signal conditioning, part by digital processing. In order to assess the effects of analog processing early in the design process, we use a MAPLE model to assess the effect of analog filtering and sampling on a worst-case test signal. This test signal consists of the signal of the wanted channel and all possible worst-case interfering signals that, according to the standard, the system must be able to sustain. These interfering signals are not offered all at once, but one per BER-test. By interpreting results, we use the worst-case test signal to determine the cutoff frequency and order of the analog lowpass filter; the sampling frequency and resolution of the ADC and, finally, the requirements for the digital channel selection filters. keywords: Software Defined Radio, HiperLAN/2, Bluetooth, Channel Selection requirements.
I. I NTRODUCTION In our Software Defined Radio (SDR) project we aim at combining two different types of standards, Bluetooth and HiperLAN/2 on one common hardware platform. HiperLAN/2 is a high-speed Wireless LAN (WLAN) standard (e.g. [1] and [2]), whereas Bluetooth is a lowcost and low-speed Personal Area Network (PAN) standard ([3]). An SDR system is a flexible radio system that is reprogrammable and re-configurable by software in order to cope with a multi-service1 , multi-standard and multiband environment. As can be seen in Table I the standards differ in several aspects and pose an interesting challenge for an SDR platform. Goal of building a HiperLAN/2-Bluetooth demonstrator 1 With a multi-service system we mean a system that is able to handle different types of data traffic: different with respect to content (email,web,audio,video,speech, . . . ), different with respect to traffic patterns and different with respect to QoS requirements.
TABLE I Bluetooth and HiperLAN/2 Parameters. System Frequency Band
Bluetooth PAN 2.4-2.4835 GHz
Access Method Duplex Method Modulation Type Max. Data Rate Channel Spacing Max Power Peak
CDMA TDD GFSK 1 Mbps 1 MHz 100 mW
HiperLAN/2 WLAN 5.150-5.300 GHz, 5.470-5.725 GHz TDMA TDD OFDM 54 Mbps 20 MHz 200 mW - 1 W
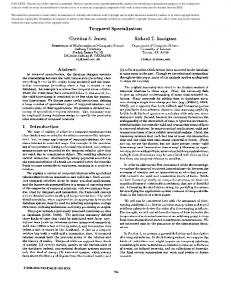
is to generate knowledge about designing the front end of an SDR system (from Antenna Reference Point (ARP) to and including demodulation (Demodulation Reference Point (DRP), see Figure 1, taken from [4]). We are interested in the question how to use HiperLAN/2 hardware for implementation of Bluetooth functionality. HiperLAN/2 is a standard that leads to more complex implementations than Bluetooth (Table I may give an impression) - we do not expect Bluetooth capable hardware to be able to implement HiperLAN/2. The receiver front-end we are interested in, consists of a channel-selection function and a demodulation function (see Figure 1). In this paper we present a channel selection function -partly analog, partly digital- that is suitable both for HiperLAN/2 and Bluetooth reception. However, we focus on Bluetooth reception only and specially on the channel selection system and its parameters. First the ARP: Antenna Reference Point
RF Signal
Channel Selection CRP: Channel Reference Point PHY Layer Functions
Demodulation
Channel Signal
DRP: Demodulation Reference Point Coding
Symbol Stream
PRP: PHY Reference Point PHY SDU Stream
Medium Access Control (MAC) MRP: MAC Reference Point
Receiver
MAC SDU Stream
Logical Link Control (LLC)
Fig. 1. Signal Path Functions Model. channel selection subsystem is outlined (Section II). In order to find the requirements for the digital filters that accomplish Bluetooth channel-selection we first need
to establish the overall requirements for the channelselection function, so from Antenna Reference Point (ARP) to Channel Selection Reference Point (CRP), see Figure 1. These overall requirements are derived in Section III. They present the channel requirements both for the analog conditioning part of the system and for the digital channel selection filters. Once we know the overall requirements, the issue is to determine what part of the channel selectivity is done using analog processing and what is part done using digital processing. The performance of high-speed highresolution Analog-to-Digital Converters (ADCs) is one of the reasons to hamper the realization of the ”ideal” Software Radio (in which the ADC is placed at ARP). The choice where to place the ADC has severe consequences for the power consumption of the front-end (e.g. see [5]). Early in the design process, a digital designer needs information about ADC parameters and about the signals to be processed that the analog designer cannot (yet) deliver, as the design process is ongoing. In this state of design-uncertainty, on one hand, the assumption ”analog doesn’t do anything”, leads to a not-implementable subsystem; while the position ”all channel selection needs to be done digital” may lead to too severe requirements for the digital filters (and likely too large power consumption of the front-end). So, the questions remain, where to position the ADC, what are its parameters and what are the consequences for digital filter-design? In order to answer this question early in the design process, we developed a MAPLE [6] worksheet that enables us to assess the linear effects of analog filtering, mixing and AD Conversion on the power spectrum of the (Bluetooth) signal we are interested in. This system is based on the usage of a worst-case test signal, derived from the Bluetooth standard. It enables us to find parameters of the analog pre-processing and ADC. In Section IV the worst-case test signal is defined. It needs to be interpreted in, maybe, an unexpected fashion, that will be highlighted. Our MAPLE worksheet is briefly explained here. In Section V we present results of applying our approach to the Bluetooth channel-selection function and give an example in which we find the parameters of the analog filters, the ADC parameters and the requirements for the digital filters. The paper ends with a conclusions section.
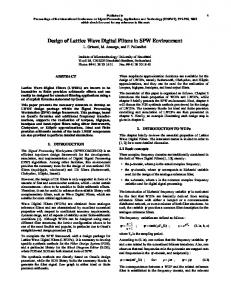
II. B LUETOOTH AND H IPER LAN/2 C APA BLE C HANNEL S ELECTION Using the HiperLAN/2 front-end for Bluetooth reception purposes, we first apply an analog bandpass filter to select the entire Bluetooth band (80 MHz wide). This signal is passed through a wide-band low-noise amplifier. Subsequently analog quadrature mixing is applied. The system is shown in Figure 2. The oscillator frequency is adjustable in steps of 10 MHz in order to follow the Bluetooth hopping pattern. In each hop-period, a so-called
Cos(2πfot) yc(t)
BandPass Filter
zc(t) LowPass Filter
x(t)
zc[k] ADC
SRC
LNA LowPass Filter ys(t)
ADC zs(t)
SRC zs[k] LNA: Low Noise Amplifier
Sin(2πfot)
SRC: Sample Rate Converter
Fig. 2. Channel Selection Function. ”chunk” of bandwidth of width Bc = 10 MHz is mixed toward zero. The number of chunks Nc in the Bluetooth band is Nc = 80/Bc . The number of 1 MHz wide Bluetooth channels in a chunk is Nb , so Nb ∗ Nc = 80. The begin-frequency of Bluetooth channel-number k is at fb (k), its centre frequency at fc (k) and end-frequency at fe (k). These frequencies (in Mhz) are given by: fb (k) = 2402 + k fc (k) = 2402.5 + k fe (k) = 2403 + k
for 0 ≤ k ≤ 78
(1)
If the hopping-pattern of the Bluetooth receiver is at channel k, the channel is in chunk number c (0 ≤ c ≤ Nc − 1). The relation between the channel number k, its position p in a chunk (0 ≤ p ≤ Nb − 1) and its chunk number c is given by k = c.Nb + p in which: p = k mod Nb c = k−p Nb
(2)
All channels in chunk number c are down converted with mixing frequency f0 for which f0 = f0 (c) = fb (c.Nb ) = 2402 + c.Nb
(3)
holds. So, after quadrature mixing, we have the Bluetooth band with channel-number k down-converted to a frequency band for which p ≤ f ≤ p + 1 [MHz] holds. The relevant channels for further processing are in a chunk of 0 ≤ f ≤ Bc = 10 MHz. In both the in-phase and quadrature signal-path, an approximately 10 MHz wide lowpass filter is applied and an ADC with maximum sample-frequency of 65 MHz is used. In the digital domain a particular Bluetooth channel is selected and demodulation is performed. The details of the lowpass filter (exact cutoff frequency and order) and ADC (sample frequency and resolution) need to be investigated; moreover the requirements for the digital filters need to be found. For Bluetooth signal reception, we mix at the low-side of the required 10 MHz chunk (see (3)), while for HiperLAN/2 the modulation frequency can be chosen in the centre of the required 20 MHz band. In Figure 3 the effects of central-band and low-band modulation are shown. In the picture power spectra are symbolized for, from top to bottom, the bandpass signal x(t), its analyto ˜(t) and the inical signal x(t), its complex envelope x phase and quadrature signals xc (t) and xs (t) (following the notation in [7]; see also [8] and [9]). It is clear that the bandwidth in the quadrature and in-phase channels
not only depends on the width of the original band, but also on the choice of modulation frequency with respect to the original band. Note that, although the bandwidth in the quadrature and in-phase channels in both cases is equal, the spectra themselves are not equal to one another. Choosing 10 MHz chunks enables both the lowpass filter for a Bluetooth signal and for a HiperLAN/2 signal to be of approximately equal width. Modulation at centre of band
~ x(t)
xc(t)
xs(t)
In-band Interference Out-of-Band Blocking
Interference
∆k
Co-Channel Adjacent (1 MHz) Adjacent (2 MHz) Adjacent (≥ 3 MHz) 30 MHz-2000 MHz 2000 MHz-2399 MHz 2498 MHz-3000 MHz 3000 MHz-12.5 GHz
0 1 2 ≥3 -
RS/I [dB] 11 0 -30 -40 -57 -40 -40 -57
Areq [dB] 0 -24 -54 -64 -81 -64 -64 -81
Modulation at low side of band x(t)
x(t) x(t)
TABLE II Experiment Types
-f0
0
f0
-f0
0
f0
-f0
0
f0
-f0
0
f0
-f0
0
f0
x(t)
~ x(t)
xc(t)
xs(t)
-f0
0
f0
-f0
0
f0
-f0
0
f0
-f0
0
f0
-f0
0
f0
Fig. 3. Central-band and low-band modulation of a bandpass-signal x(t). Blocks represent power spectra.
III. B LUETOOTH C HANNEL S ELECTION R E QUIREMENTS
In the Bluetooth specification, [3, Chapter 4], experiments are defined that test the sensitivity and interference performance of a receiver. In such an experiment, a signal constellation, consisting of a wanted Bluetooth signal and an interfering signal, is offered to the receiver. The offered signal is demodulated and the number of erroneously received bits is counted in order to determine the BER. In the Bluetooth standard different types of experiments are distinguished (see Table II). A first group of experiments tests for in-band interference: co-channel interference and three types of adjacent channel interference. In an experiment of this group, the interferer is one Bluetooth signal. Its power is given as a signal-to-interference ratio (RS/I ), (see [3, Table 4.1]). The second group tests for out-of-band blocking; there are different requirements for different frequency ranges. The interferer is a continuous wave signal of which the absolute power is given [3, Table 4.2]. An experiment in which the system achieves a BER≤ 10−3 for the specified power-level is a pass, otherwise the system fails. For a system to be conforming, it should pass all the BER-tests. The in-band interference experiment-types differ in the distance between channel number of wanted and unwanted signal ∆k. In an experiment with channel-
distance ∆k, the signal power PS (∆k) is given by: PS (∆k) = PS,sens + 10 [dBm], |∆k| = 0, 1, 2 = PS,sens + 3 [dBm], |∆k| ≥ 3 (4) in which PS,sens = −70 [dBm] The power of the interfering Bluetooth signal PI (∆k) can be derived from the standard using the signal-tointerference ratio RS/I (in [dB]). It also depends on ∆k (see Table II): (∆k)
RS/I = PS (∆k) − PI (∆k) [dB]
(5)
Now, the issue is to derive the required interference(∆k) attenuation Areq in order that the execution of the experiment leads to a pass of the BER-test. From analysis of the demodulation function, we need to find a signal-to-noise ratio SN Rreq that is sufficient to pass the BER-test. In this paper we assume SN Rreq = 21 dB; a refinement of this figure is given in our accompanying article, [10]. Moreover, we define a safety margin Am that constitutes an extra suppression of the interferer of Am = 3 dB. The attenuated interfering-power should (at maximum) equal the required noise power that follows from the required SNR by the demodulator and the safety margin: (∆k)
(∆k) = PS (∆k) + SN Rreq + Am PS (∆k) + RS/I − Areq (6) so that (∆k)
(∆k) = RS/I − SN Rreq − Am . Areq
(7)
In our case, the difference between signal-to-interference ratio and required attenuation is 24 dB (for all adjacent channels experiments, see Table II). For a particular out-of-band blocking experiment, we assume that all interfering signal power is allocated into a 1 MHz wide band (jamming). Moreover, we assume that the wanted signal is 3 dB above sensitivity ([3, Section 4.3]), so at −67 dBm. We now are able to calculate signal-to-interference ratios RS/I for the out-of band experiments as well, as the absolute interfering signal power is given in the standard. As an example, consider an interfering signal within the 30 MHz-2000 MHz band. The system should pass the BER-test even if the interfering power is -10 dBm. For RS/I we apply (5), we find
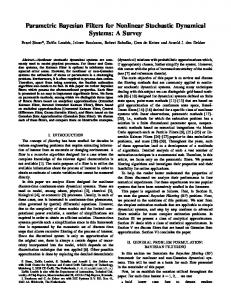
RS/I = −67 − (−10) = −57 dBm. The so-found numbers are listed in the lower part of Table II. Also the attenuation the channel selection function should achieve is given there (according to (5)). Above, we saw that for a certain type of interference, only one interfering channel per experiment is assumed. In order to be conforming, the system has to undergo all experiments and pass the BER-test for each experiment. All per-experiment requirements can be combined to one channel-selection filter that fulfills all single-experiment requirements. This filter specifies the attenuation that the functions between ARP and CRP should meet (see Figure 1). The resulting overall filter requirements (for the in-band interference experiments only) is given in Figure 4. In this figure, the centre frequency of the desired band (∆k = 0) is at 0 MHz; the centre frequency of the first adjacent channel (∆k = 1)is at 1 MHz etc. Ver(∆k) tically we see Areq in [dB]. Only filter requirements for adjacent channels with higher frequencies are shown. A transition band is included in the region where the Bluetooth spectrum falls off below its maximum. This transition-band specifies a don’t-care band in the filter design. dB 0 dB -24 dB
-54 dB -64 dB
0.34
0.66
1.34
1.66
2.34
2.66
3.34
frequency [MHz]
Fig. 4. Bluetooth Overall Channel Selection Requirements (based on in-band interference experiments).
IV. A T EST SIGNAL AND M ODEL FOR C HANNEL R EQUIREMENTS A SSESSMENT In the derivation of the channel selection requirements, we used the experiments that are specified in the Bluetooth standard. In an experiment (or BER-test) one interferer tests the demodulation capability of the receiver. At the end of our analysis, we defined an overall filter requirement that should enable the system to pass all tests. Repeated single-interferer experiments lead to an overall filter requirement. For analysis purposes of the front-end, we do the reverse. We conceive a test pattern that consists of all the single-experiment test signals joined together in one worst-case testsignal. We analyze the effect of this ”wall of sound” on the front-end. The analysis is power-based, so a test signal is represented by its Power Spectral Density (PSD). The PSD of this test signal is implemented in a MAPLE [6] worksheet that models the signal processing operations of the propose front-end (in Figure 2). For linear filter and amplification operations the MAPLE
model should mimic reality rather well, as no power in a particular frequency band of the ”wall of sound” will be translated to another band. The effects on the test signal of a particular filter bandwidth and filter order can readily be interpreted. For sampling and mixing this does not apply. In interpreting the results of the MAPLE model we have to bear in mind that not all constituting signals of the worst-case test signal are presented to the system in one ”wall-ofsound” experiment - there is no such experiment defined in the Bluetooth standard. If one, however, sees distortion in the wanted signal band, one has to keep in mind that, in that case, there is (there exists) an experiment that actually causes, for instance, the aliasing that we see. In our current MAPLE model, no noise, no quantization effects and no non-linear effects and distortion are taken into account. The purpose of the model is in the early design phase of the project, where digital filter requirements have to be found, while the analog system is not fully specified. The ”wall of sound” test signal was created by first fitting an estimated Bluetooth power spectral density to functions that can be handled easily by MAPLE. We choose to model the PSD of a single channel using two Butterworth functions, one modelling the in-channel 1 MHz part of the spectrum, the other fitted to the tail. Subsequently we used this single channel approximation for creating the worst-case signal constellation. This constellation consists of one ”wanted” channel (at 0 dB), placed somewhere in the Bluetooth band, interfering (∆k) Bluetooth channels with strength given by −RS/I in Table II and an 100 MHz wide out-of-band signal with strength of −RS/I = 40 dB (also in Table II).
A. Bluetooth spectrum fitting The normalized output spectrum of white noise, filtered by a nbw -th order Butterworth filter with cut-off frequency fbw is given by (n
,fbw )
Sbwbw bw
(f ) =
1 1 + (f /fbw )2nbw
(8)
The power spectrum S˜b˜b (f ) of the complex envelope ˜b(t) of a Bluetooth signal with frequency deviation fd = 0.175 was modelled by S˜b˜b (f ) =
S0 (3,0.2) (1,0.4) . (α . Sbw bw (f ) + Sbw bw (f )) α+1
(9)
in which the cutoff frequencies are given in MHz, the constant α = 1000 and S0 a normalization constant [mW/MHz], see Figure 11. The Bluetooth signal b(t) itself is defined by the bandpass signal b(t) = Re{ ˜b(t) ej 2π f0 t } in which f0 is the modulation frequency.
(10)
B. Worst-case Signal Constellation In Figure 5a the power spectral densities of a wanted channel (at 3 MHz) and its five adjacent channels (0 ≤ ∆k ≤ 3) are shown. It can be seen that especially the adjacent channels with ∆k = 3 introduce considerable power in the wanted channel. This in-band power is approximately −11 dB/MHz and thus comparable to the allowable level of co-channel interference in the Bluetooth standard (see also Table II). For the ”wall of sound” signal, in which the +40 dB channels shown in Figure 5 extend over the entire Bluetooth band, it was observed that the tails of these +40 dB channels add up in such a way, that the in-band power of the wanted channel was increased by approximately 3 dB. This is a consequence of the definition of the ”wall of sound” signal and not a property of an interfering signal in a BER-test experiment of the Bluetooth system itself. From our ”wall of sound” signal we require that the effect of additional in-band power in the wanted signalband is negligible (no visible deviation from 0 dB). The inclusion of a transmission mask in the Bluetooth singlechannel approximation solved this problem (see Figure 5b). A Butterworth filter with fbw = 1 MHz and nbw = 3 was used for this purpose. The filter changes the total power of a single channel marginally (less than 0.1%). We have to stress the interpretation of Figure 5 (and the subsequent figures) once more. In fact we see the signal constellations of 2 experiments with ∆k = 3, two experiments with ∆k = 2 and two experiments with ∆k = 1, so the test signals for a total of six experiments in one figure. We do not see the test signal of one experiment in which a wanted signal is hampered by 6 interfering channels.
C. Bandpass Signals In Figure 3, power spectra of a band-pass signal, the complex envelope and quadrature and in-phase signal were depicted symbolically. In our MAPLE model we compute all of these signals and can, by visual inspection, see what the consequences are of applying signal processing functions. In Figure 6 the Bluetooth band is shown (twice) as a ”wall of sound” signal w(t), with PSD Sww (f ). In Figure 6a, we defined a worst-case test signal in which the wanted channel is identified by k = 20. Its centre frequency is fc (20) = 2422.5 MHz (according to (1)). The adjacent channels behave according to −RS/I in Table II. In Figure 6b the wanted channel is identified by k = 29 with centre frequency fc (29) = 2431.5 MHz. These two channels form the extreme bands of the third chunk (c = 2). The mixing frequency f0 is equal for both channels and is given by (3), so f0 (2) = 2422 MHz. In case of a complex or quadrature signal, we experienced difficulty in interpreting the result of a signal processing operation, using only the power spectra of the original and processed signal as a means for assessment.
An example is given in Figure 7. In Figure 7a (Figure 7b) we see the spectrum Swc wc (f ) of the in-phase signal corresponding to spectrum of the bandpass signal Sww (f ) of Figure 6a (Figure 6b). While both the spectra in the right and left figure are symmetrical (as they should be), the wanted signal is difficult to distinguish in the right figure. This problem is caused by the fact that phase-relations between signals are lost in a power-based analysis. The question remains how to asses consequences of a signal processing operation by inspecting these pictures. We found a work-around to this problem by inspecting the effects of a signal processing operation F in a quadrature signal path or in-phase signal path at the level of the corresponding bandpass signal. While our system performs, for example yc (t) = F {xc }(t), we inspect y(t) and compare it with x(t), see (11). So, we inspect the result of a bandpass equivalent operation F bp when assessing the impact of operations on complex signals or signals in quadrature (see (11)). Examples are given in the next section. In a future paper, we plan to give details on the method and its underlying assumptions. xc (t) ↓ x(t)
F
⇒ F bp
→
yc (t) ↓
(11)
y(t)
V. T HE 10 MH Z C HUNK SYSTEM R EVIS ITED
In this section we present an example of what can be done with our MAPLE model. The two worst-case signals w(t) we offer to our system (see Figure 2) are depicted in Figure 6a and Figure 6b. In Figure 8 the impact of lowpass filtering of the in-phase wc (t) and quadrature ws (t) components of the worst-case signal is shown2 . The filter is a Butterworth filter with cutoff frequency fbw = 11 MHz and order nbw = 4. It should be stressed that we do not per-se propose to use a Butterworth-type of filter in our design (as delay distortion may be a problem, see [8, p. 99]). However, the Butterworth filter does give an impression of the effects on our worst-case signal of a particular choice of filter-order and cutoff-frequency. We see that the channel with k = 20 passes more or less unaltered by the filter (Figure 8a), while the channel with k = 29 experiences some skewness, as it is in the transition region of the filter (Figure 8b). Whether this effect is harmful for demodulation performance is not known to the authors; further simulation and analysis could provide an answer. In the next example, the cutoff frequency is increased to fbw = 12.5 MHz. In Figure 9 we see the effect of sampling the filtered signal with a sampling frequency of fad = 50 MHz. The effect of sampling is shown at the level of the processed bandpass signal. Only the first-order aliasing components were taken into account (although there is 2 Formally, the spectrum shown in Figure 8a can be written as SF bp w F bp w (f )), in which F bp is the bandpass-equivalent operation of the lowpass filter, see (11).
no in-principle objection to inclusion of higher order components). Also here, the effects of sampling were computed-back from the in-phase signal to the bandpass signal (symbolized by the right downward arrow in (11)). As stated in the last paragraph of Section IV-B, we have to interpret the figure carefully. When the aliased signal overlaps with the wanted channel in the filtered signal, we must conclude that there exist a BER-test experiment that causes strong interference in the band of the wanted channel. In Figure 9a we see that the wanted signal with centre frequency fc (20) = 2422.5 MHz can be interfered by some BER-test interferer that introduces in-band power of approximately −6 dB/MHz. This interference is caused by a Bluetooth interferer at the border of the Bluetooth band. In Figure 9b, we see that the wanted signal with centre frequency fc (29) = 2431.5 MHz can be interfered by some BER-test interferer that introduces in-band power of approximately −1 dB/MHz. The interference is caused by an out-of-band interferer. In the next example therefore, the order of the lowpass filter is increased. In Figure 10 the effects of a 6th order Butterworth filter are shown. Indeed, there is no BER-test that will cause too much interference when selecting these parameters (although for k = 29, at fc (29) = 2431.5, −20 dB/MHz out-of-band interference can occur). The pictures can also be used to make a rough guess at the required resolution of the ADC. Following the 6dB/bit rule (see for instance [11]) the resolution of the ADC can be estimated to be 40 + 20 = 60 dB, so at least 10 bit are necessary. Precise analysis is necessary to come to a definitive conclusion with respect to the number of bits (for an approach, see [11]). We can derive the requirements for the digital filters quite straightforwardly. As we use the test signal that is used for specification of the overall front-end as an inputsignal to the system and see the effects of analog processing and ADC immediately, we see what is still lacking in selectivity. As an example, consider the vicinity of the wanted channel in Figure 10a, representing the signal that passed the ADC. It resembles the vicinity of the original bandpass signal (see Figure 6a). One may conclude that all channel-selectivity as specified in Figure 4 has to be provided by the digital processing. The analog processing achieves an ADC-passable signal, but provides no channel selectivity. On one hand, this is caused by the parameters chosen in the examples above. On the other hand, and more importantly, it is a consequence of the system design, in which a chunk of Bluetooth channels has to pass the ADC.
eration of analog and digital processing. The method, in which we use a MAPLE worksheet to assess the impact of analog processing and ADC, proved useful as our analog system was not completely specified, while digital channel filter requirements were already needed. It was observed that the analog processing can achieve an ADC-passable signal, but that the channel-selectivity requirements have to be met by the digital processing. So, the overall requirements for the channel-selection function (Figure 4) are valid for the digital processing alone.
ACKNOWLEDGMENT This research is carried out in cooperation with the Integrated Circuit Design Laboratory of the University of Twente.
R EFERENCES [1]
[2]
[3] [4]
[5]
[6]
[7] [8] [9]
VI. C ONCLUSIONS
[10]
In this paper we presented a method for using the HiperLAN/2 front-end for Bluetooth reception purposes. We arrive at the requirements for the overall Bluetooth channel-selection function that have to be met by coop-
[11]
ETSI. Broadband Radio Access Networks (BRAN); HIPERLAN Type 2; System Overview. Technical Report ETSI TR 101 683 V1.1.1 (2000-02), ETSI, February 2000. ETSI. Broadband Radio Access Networks (BRAN); HIPERLAN Type 2; Physical (PHY) layer. Technical Specification ETSI TS 101 475 V1.2.2 (200102), ETSI, February 2001. Bluetooth SIG. Specification of the Bluetooth System - Core. Technical Specification Version 1.1, Bluetooth SIG, February 2001. F.W. Hoeksema, R. Schiphorst, and C.H. Slump. Functional Analysis of a SDR Based Bluetooth/HiperLAN Terminal Demonstrator. 2nd PROGRESS workshop on Embedded Systems and Software, pages 95–106, October 2001. S. Donnay, G. Gielen, and W. Sansen. Highlevel analog/digital partitioning in lowpower signal processing applications. PATMOS’97 Workshop, September 1997. http: //www.dice.ucl.ac.be/˜anmarie/ patmos/papers/S3/3_1.html. Waterloo Maple Software. MAPLE 7.00. http://www.mapleapps.com/ maplelinks/sh_resources.shtml, May 2001. S. Benedetto, E. Biglieri, and V. Castellani. Digital Transmission Theory. Prentice Hall, Inc., 1987. A.B. Carlson. Communication Systems. McGrawHill Book Company, 1986. A. Papoulis. Probability, Random Variables and Stochastic Processes. McGraw-Hill Book Company, 1984. R. Schiphorst, F.W. Hoeksema, and C.H. Slump. Bluetooth Demodulation Algorithms and Their Performance. 2nd Karlsruhe Workshop on Software Radios, March 2002. M.E. Frerking. Digital Signal processing in Communication Systems. Chapman & Hall, 1994.
40
Sxx [dB/Hz]
Sxx [dB/Hz]
40
20
2
4
f [MHz]
6
8
20
10
2
0
0
–20
–20
–40
–40
4
(a) No mask.
f [MHz]
6
8
10
(b) With mask.
Fig. 5. PSD of wanted channel (at 3 MHz) and nearest strong adjacent channels in the worst-case signal constellation. In the figures below and on the next page, on the horizontal axis the power spectral density in [dB/MHz] is given, on the vertical axis the frequency f in [MHz].
40
40
30
30
20
20
10
10
0
2400
2420
2440
2460
0
2480
2400
2420
2440
f
2460
2480
f
–10
–10
–20
–20
(a) Wanted channel @ k = 20
(b) Wanted channel @ k = 29
Fig. 6. Two worst-case test signals; Wanted channels at the extreme sides of a chunk (c=2). Bandpass signals, S ww (f )
–100
–80
–60
–40
–20
50
50
40
40
30
30
20
20
10
10
0
20
40
60 f
(a) Wanted channel @ k = 20
80
100
–100
–80
–60
–40
–20
0
20
40
60
80
100
f
(b) Wanted channel @ k = 29
Fig. 7. Two worst-case test signals; Wanted channels at the extreme sides of a chunk (c=2). In-phase signals: S wc wc (f ).
40
40
30
30
20
20
10
10
0
2400
2420
2440
2460
2480
0
2400
2420
2440
2460
2480
f
f –10
–10
–20
–20
(a) Wanted channel @ k = 20
(b) Wanted channel @ k = 29
Fig. 8. Two times a worst-case test signal and its filtered version (fbw = 11 MHz, nbw = 4). Filter-effect shown in Bluetooth band.
40
40
30
30
20
20
10
10
0
2400
2420
2440
2460
2480
0
2400
2420
f
2440
2460
2480
f
–10
–10
–20
–20
(a) Wanted channel @ k = 20
(b) Wanted channel @ k = 29
Fig. 9. Two times a filtered and sampled worst-case test signal (fbw = 12.5 MHz, nbw = 4; fad = 50 MHz). Filter and aliasing effect shown in Bluetooth band.
40
40
30
30
20
20
10
10
0
2400
2420
2440
2460
2480
0
f
2420
2440
2460
2480
f
–10
–10
–20
–20
(a) Wanted channel @ k = 20
2400
(b) Wanted channel @ k = 29
Fig. 10. Two times a filtered and sampled worst-case test signal (fbw = 12.5 MHz, nbw = 6; fad = 50 MHz). Filter and aliasing effect shown in Bluetooth band.
60 0.00
50.00
100.00
150.00
200.00
250.00
300.00
350.00
400.00
450.00
500.00
50
[dB/Hz]
40
30
20
10
0 f [10 KHz] GFSK, f_d=0.175
In-band approximation
Tail approximation
Approximation
Low Channel
High Channel
(a) Centre Approximation.
1.E+06 1.E+05 1.E+04 1.E+03 1.E+02
1.E+00 0
200
400
600
800
1000
1200
1400
1600
1800
2000
2200
2400
1.E-01 1.E-02 1.E-03 1.E-04 1.E-05 1.E-06 1.E-07
f [10 KHz] GFSK, f_d=0.175
In-band approximation
Tail approximation
Approximation
Low Channel
High Channel
(b) Tail Approximation.
Fig. 11. Bluetooth Spectrum Approximation.
[W/Hz]
1.E+01