Spectral and Temporal Processing in Human Auditory Cortex
Robert J. Zatorre and Pascal Belin
We used positron emission tomography to examine the response of human auditory cortex to spectral and temporal variation. Volunteers listened to sequences derived from a standard stimulus, consisting of two pure tones separated by one octave alternating with a random duty cycle. In one series of five scans, spectral information (tone spacing) remained constant while speed of alternation was doubled at each level. In another five scans, speed was kept constant while the number of tones sampled within the octave was doubled at each level, resulting in increasingly fine frequency differences. Results indicated that (i) the core auditory cortex in both hemispheres responded to temporal variation, while the anterior superior temporal areas bilaterally responded to the spectral variation; and (ii) responses to the temporal features were weighted towards the left, while responses to the spectral features were weighted towards the right. These findings confirm the specialization of the left-hemisphere auditory cortex for rapid temporal processing, and indicate that core areas are especially involved in these processes. The results also indicate a complementary hemispheric specialization in right-hemisphere belt cortical areas for spectral processing. The data provide a unifying framework to explain hemispheric asymmetries in processing speech and tonal patterns. We propose that differences exist in the temporal and spectral resolution of corresponding fields in the two hemispheres, and that they may be related to anatomical hemispheric asymmetries in myelination and spacing of cortical columns.
Binder et al., 1997; Griffiths et al., 1999; Halpern and Zatorre, 1999; Hugdahl et al., 1999; Perry et al., 1999). The complementary specializations for speech and tonal materials revealed by this literature suggest a hypothesis to explain the functional hemispheric differences. Whereas the analysis of speech requires good temporal resolution (Tallal et al., 1993) to process rapidly changing energy peaks (formants) that are characteristic of many speech consonants, it can be argued that tonal processes instead require good frequency resolution. The hypothesis we wish to test is that human auditory cortex is functionally segregated, such that different fields are selectively sensitive to temporal or spectral acoustic features, and that differences exist in the temporal and spectral resolving power between corresponding cortical fields in the two hemispheres. Considerable evidence already exists that cortical specialization for speech may be related to rapid auditory processing. For example, deficits in temporal processing in the tens of milliseconds range have been demonstrated in a variety of language disorders (Efron, 1963; Tallal and Newcombe, 1978; Phillips and Farmer, 1990; Fitch et al., 1997). Recent brain imaging data also indicate better temporal resolution for the left auditory cortex (Belin et al., 1998). It has also been shown that behaviorally, speech recognition can be accomplished with primarily temporal cues (Shannon et al., 1995). What is not yet known is whether distinct cortical fields are primarily responsive to temporal as opposed to spectral sound features, and whether their response properties differ in the two hemispheres. The present investigation was carried out to examine this question directly using functional imaging. We constructed nonverbal stimuli that varied independently and systematically along spectral and temporal dimensions. We predicted that increasing the rate of temporal change would preferentially recruit left auditory cortical areas, while increasing the number of spectral elements would engage right auditory cortical regions more strongly.
Inroduction A salient aspect of hemispheric specialization in the human brain pertains to the processing of auditory speech signals. Much evidence exists indicating that speech sounds are preferentially processed within left auditory cortical areas. Classic observations of aphasic patients have pointed to the importance of left posterior temporal cortex in speech comprehension, and more recent evidence from neuroimaging also indicates recruitment of left temporal and frontal cortical regions for the analysis of speech information [see Zatorre and Binder for review (Zatorre and Binder, 2000)]. However, the basis for this specialization remains unclear. One relevant set of findings that is often overlooked in examining the specialization of speech relates to evidence for specialization of pitch processing. Lesions to right but not left primary auditory cortical areas, for example, specifically impair the perception of missing fundamental pitch (Zatorre, 1988), and direction of pitch change (Johnsrude et al., 2000); more generally, damage to the superior temporal cortex on the right also affects a variety of other tonal or spectral processing tasks (Milner, 1962; Zatorre, 1985; Sidtis and Volpe, 1988; Divenyi and Robinson, 1989; Robin et al., 1990; Zatorre and Samson, 1991; Zatorre and Halpern, 1993). Also, considerable functional imaging evidence is consistent with a greater role for right auditory cortices in tonal pitch perception (Zatorre et al., 1994; © Oxford University Press 2001. All rights reserved.
Montreal Neurological Institute, McGill University, 3801 University St., Montreal, QC H3A 2B4, Canada
Materials and Methods Subjects Twelve healthy, right-handed volunteers (half of each sex) with normal hearing participated in the experiment after giving informed consent. Stimuli The stimuli consisted of pure-tone patterns in which the frequency and duration of the individual elements were varied systematically. At each frequency transition, tones were ramped on and off in counterphase using a cosine function with a 10 ms duration, thus maintaining a nearly constant total amplitude envelope and avoiding transients (Fig. 1a). Two stimulus parameters — rate of frequency modulation and spectral distribution of elements within the pattern — were varied independently in the two conditions of the experiment, while keeping the frequency range and amplitude constant at all times. The parametric changes in the two dimenCerebral Cortex Oct 2001;11:946–953; 1047–3211/01/$4.00
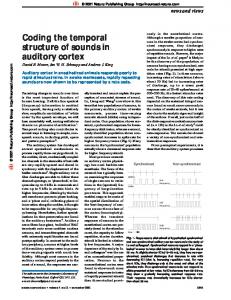
Figure 1. (a) Detail of transition between frequencies used in all stimulus sequences. The top graph shows how the amplitude profile of each tone was ramped in cosine counterphase; the bottom graph shows the resulting waveform. Note the smooth change of frequency, devoid of discontinuities or any variation in amplitude envelope at the transition point. (b) Schematic representation of stimuli used. Each pair of panels shows an excerpt of a stimulus sequence represented on the left as a spectrogram (frequency as a function of time) and on the right as a Fourier spectrum (amplitude as a function of frequency; integrated over a 10 s time window). The top pair of panels represents the standard stimulus: two tones with a frequency separation f of 1200 cents (one octave), with a fastest temporal change of t = 667 ms. The three sets of panels along the left of the figure illustrate three levels of change on the temporal parameter, such that t = 333, 83 or 21 ms, the latter corresponding to the fastest value used, while f is held constant. The spectrogram shows how the stimuli change progressively faster, while the Fourier spectra show two fixed spectral peaks corresponding to the two frequencies, with only a minimal spread of energy as the rate of alternation is increased. The three sets of panels along the right side of the figure illustrate three levels of change on the spectral parameter, with the minimum frequency difference f decreasing to 600, 150 and 37.5 cents. The value of t is held constant at 667 ms. Note that the Fourier spectra show increasing numbers of more finely spaced frequency components as the spectral parameter changes.
sions were applied starting with the same standard stimulus condition, consisting of two tones separated by one octave with a relatively slow rate of alternation (see Fig. 1b). This standard condition was then subjected to five levels of temporal variation and five levels of spectral variation, for a total of 11 scans. Throughout a given scan the parameters were held constant, so that variation in the desired parameter occurred only across scans. In the temporal condition, the frequencies used were fixed at 500 and 1000 Hz, thus keeping a constant separation of one octave. The rate of alternation of these two frequencies was varied from relatively slower to relatively faster across each of five different scans, doubling the speed with each successive condition. In order to avoid spectral changes that would emerge if a constant rate of alternation were used, the stimuli were generated using a randomly determined duty cycle, sampled from a distri-
bution with the following characteristics: if the shortest duration used for a given condition is t, then the range of durations sampled varied from t to nt, where n is an integer, and the probability of occurrence of any given duration is ½n. Thus, the duration with the highest probability of occurrence (½1 = 0.50) will be t, the shortest one for a given condition; the next longer tone would have a duration of 2t, and would occur with a probability of ½2 = 0.25; the duration 3t would occur with a probability 0.125, and so forth. These stimulus sequences are illustrated in Figure 1b (left side). In each of the five scanning conditions, the value of the parameter t varies from the slowest, at 667 ms (the standard stimulus), to the next faster with t = 333 ms, and so forth to the fastest condition, where t = 21 ms. The latter value corresponds to the fastest range of temporal change most relevant for speech analysis (Phillips and Farmer, 1990; Tallal et al., 1993). The figure also illustrates Fourier spectra of these sequences, showing that there is essentially no change in spectral distribution across conditions, apart from some minimal spread of energy for the fastest (t = 21) condition. The spectral peaks corresponding to the two tones remain fixed, and what differences do exist are on the order of 20 dB below these peaks. Thus, the random duty cycle manipulation successfully avoids major artifacts in the spectral domain arising from the change in rate of presentation. The stimuli for the second set of five scans (Fig. 1b, right side), termed the spectral condition, consisted of a sequence of tones sampled from between 500 and 1000 Hz, and presented according to the same random duty-cycle parameters as described above, using a fixed value of t = 667 ms. The frequency differences between tones were varied parametrically from coarsest to finest within each of the five scans, using frequency separations of half of an octave, one-quarter of an octave, one-eighth of an octave, etc., or 600, 300, 150, 75 and 37.5 cents (where 1 cent is a unit of equal log frequency separation; 1 octave = 1200 cents). Thus, starting with the standard condition, the stimuli consist simply of the same two tones one octave apart as described above. The next condition ( f = 600) divides the octave range into two logarithmically, so that frequencies are selected at random between 500, 707 and 1000 Hz; for the next condition ( f = 300) the octave is divided into four (500, 594, 707, 841 and 1000 Hz), and so on to the final condition ( f = 37.5) in which the frequency separations are smallest, at 1/32 of an octave. The change across conditions is thus related to the fact that the number of different frequencies sampled within any given frequency band, integrated over some time window, increases as a function of the spectral parameter. Note that in the spectral conditions, only the distribution of spectral elements (i.e. number of frequencies) varies across scans, with no change in rate of presentation, whereas in the temporal conditions the converse is true: only the rate is varied and the spectral difference is kept constant at one octave. Fourier spectra of the spectral condition (Fig. 1b) illustrate the increasingly fine frequency components present in the spectrum across conditions. (Audio examples of these stimuli are available at the following internet site: w ww.zlab.mcgill.ca) Procedure Stimuli were presented binaurally over insert earphones at an intensity of between 73 and 78 dB SPL. The order of presentation of all conditions was counterbalanced across subjects according to a Latin square design. Subjects were familiarized with the appropriate stimulus sequence prior to each scan; they were then instructed to listen carefully to the continuous stimulus sequence with their eyes closed but not to perform any explicit task. Stimulation was started several seconds before scanning began, and continued uninterrupted for the 60 s of scanning. In addition, a silent baseline condition, in which no stimulation was presented, was interspersed with the others. Positron Emission Tomography (PET) Scanning PET scans were obtained with a Siemens Exact HR+ tomograph operating in three-dimensional acquisition mode. The distribution of cerebral blood f low (CBF) was measured during each 60 s scan using the H2O15 water bolus method (Raichle et al., 1983). Magnetic resonance imaging (MRI) scans (160 1-mm-thick slices) were also obtained for each subject with a 1.5 T Phillips ACS system to provide anatomical detail. CBF images were
Cerebral Cortex Oct 2001, V 11 N 10 947
reconstructed using a 14 mm Hanning filter, normalized for differences in global CBF and co-registered with the individual MRI data (Evans et al., 1992). Each matched MRI/PET data set was then linearly resampled into the standardized Talairach and Tournoux stereotaxic coordinate system (Talairach and Tournoux, 1988) via an automated feature-matching algorithm (Collins et al., 1994). Statistical Analysis of CBF Changes Regression maps (Paus et al., 1996) were calculated to assess the significance of the relationship between each input parameter (spectral and temporal variation) and CBF (i.e. their linear regression). The data set for this analysis consisted of normalized CBF values obtained in each subject during each of the six conditions (standard plus five levels of parametric variation), yielding a total of 72 image volumes. The effect of the variation in spectral or temporal parameter was assessed by means of analysis of covariance, with subjects as a main effect and the parameter number as a covariate. The following model was fitted: E(yij) = ai + βPsij where yij is the normalized CBF of subject i on scan j, and sij is the parameter value at scan j. The subject effect (ai) is removed and the parameter of interest is the slope βP of the effect of the parametric change on CBF. In addition to the covariation analysis, a categorical comparison was also performed, contrasting the spectral conditions to the temporal conditions directly. For this analysis the CBF values corresponding to the five conditions in which spectral variation occurred were averaged, and this volume was compared with the average of the five conditions in which temporal variation occurred. The resulting volume was searched for regions of significant CBF change. Differences ref lect areas whose CBF response is greater to stimuli var ying in one parameter than the other, and vice versa. The significance of focal CBF changes for both types of analysis was assessed by a method based on three-dimensional Gaussian random-field theory (Worsley et al., 1992), which corrects for the multiple comparisons involved in searching across a volume. Because we wished to test hypotheses concerning the temporal neocortex, we restricted the search volume a priori, which allows the use of a lower threshold value and hence greater sensitivity within this region. Values equal to or exceeding a criterion of t = 3.2 were considered significant (P < 0.01, two-tailed), yielding a false-positive rate of 0.52 in 60 resolution elements (each of which has dimensions 14 × 14 × 14 mm), if the volume of temporal cortex gray matter is roughly 170 cm3.
Results PET data were analyzed using a two-step approach. First, the image volumes were searched for CBF changes in the superior temporal region that covaried significantly as a function of the two input parameters (temporal and spectral) in order to identif y the location of significant CBF change in temporal cortices. The response within these regions was extracted by computing the CBF value relative to the silent baseline condition in a spherical region of interest (radius 5 mm) centered on the
Table 1 Covariation analysis Parameter
Region
x
y
z
t
Temporal
left HG right HG left STG anterior right STG anterior right STS
–47 50 –51 51 62
–18 –11 –13 1 –37
8 5 2 –2 2
6.14 5.61 3.24 3.50 3.30
Spectral
Abbreviations: HG: Heschl’s gyrus; STG: superior temporal gyrus; STS: superior temporal sulcus.
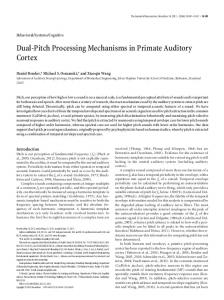
coordinates from the covariation analysis. These CBF values were then used to compute slopes as a function of each parameter, in order to test for the predicted hemispheric differences. Secondly, as an additional way to examine hemispheric asymmetries, the direct comparison of spectral to temporal conditions was analyzed via subtraction of these conditions from one another, and region of interest analyses were also conducted on the resulting CBF values. Covariation Analyses The analysis of covariation for the temporal parameter revealed only two regions of significant CBF covariation (Fig. 2; Table 1); these foci were located in the left and right Heschl’s gyri (HG), as determined from inspection of the average anatomical MRIs, and by comparison to anatomical probabilistic maps (Penhune et al., 1996). Analysis of covariation for the spectral parameter revealed three regions located within the superior temporal gyri (Fig. 2; Table 1): two roughly symmetrically located in a region of the STG anterior to HG in each hemisphere, and a third in a region in the upper bank of the right superior temporal sulcus (STS), posterior to HG, which was not matched by a symmetrical area on the left (Fig. 2). The CBF data extracted from the regions of interest located in HG and anterior STG areas in each hemisphere (Table 1) were used to compute slopes (CBF as a function of parameter) for each individual subject for each condition using a least-squares regression method. These slopes were entered as dependent variables into analyses of variance, with side and stimulus condition as the two factors. The analysis for HG indicated a highly significant main effect of stimulus condition [F(1,11) = 27.0, P < 0.001], indicating that the slope for the temporal parameter was much greater than for the spectral parameter, as expected from the covariation analysis. There was no interaction with side, however. A similar analysis for the anterior STG regions showed a clear interaction between side and stimulus condition [F(1,11) = 11.92, P < 0.005]. Inspection of the slopes derived from these CBF values (Fig. 3) indicates that the predicted pattern was present: the slope is higher for the temporal than for the spectral parameter in the left hemisphere, but higher for
Figure 2. (Top panel) Three-dimensional rendering of the CBF data from the covariation analyses onto a magnetic resonance image of a representative individual subject’s brain, viewed from the right. The level of the section ( z = 3mm) is indicated in the inset. The green areas correspond to the regions showing significant covariation of CBF with increasing rate of temporal change, while the red areas correspond to regions whose CBF increased as a function of change in the spectral parameter (precise stereotaxic coordinates are given in Table 1). H indicates the stem of Heschl’s gyrus in each hemisphere; STS indicates the superior temporal sulcus. Note that the temporal covariation sites are located within Heschl’s gyri in the two hemispheres, while the spectral covariations are located anterior to the sites covarying with the temporal stimulus parameter. An additional posterior site of spectral covariation is located within the STS in the right hemisphere only. Figure 4. (Bottom panel) Merged PET and MRI volumes corresponding to the direct comparison of temporal and spectral conditions to one another (corresponding to subtraction analysis in Table 2). The image on the left shows a horizontal section taken through the region of Heschl’s gyri (z = 9), which showed significantly greater activity in the combined temporal conditions than in the combined spectral conditions. The section on the right is taken through the maxima corresponding to the anterior superior temporal region (z = –6), which showed a greater response to the spectral conditions than to the temporal conditions. The bar graphs illustrate the percent difference between condition in regions of interest taken from corresponding locations.
948 Spectral and Temporal Auditory Processing • Zatorre and Belin
Cerebral Cortex Oct 2001, V 11 N 10 949
Table 2 Subtraction analysis Comparison
Region
x
y
z
t
Temporal–spectral
left HG right HG left STG anterior right STG anterior
–47 40 –44 50
–18 –23 3 10
9 9 14 –6
5.08 3.43 3.80 4.58
Spectral–temporal
Abbreviations: HG: Heschl’s gyrus; STG: superior temporal gyrus.
STG, since the spectral changes were predicted to be greater on the right, and left minus right for the HG region since the temporal changes were predicted to be greater on the left). The difference between these two indices was significant [t(11) = 2.39, P < 0.02], confirming the conclusion drawn from the covariation analysis that the two pairs of regions have opposite hemispheric weightings.
Discussion
Figure 3. Slopes of CBF changes in three selected cortical regions as a function of spectral and temporal input parameters. Symbols indicate average CBF with one standard error of the mean; lines are drawn through the least-squares linear solution corresponding to these points.
the spectral than for the temporal parameter in the right; the right STS region shows a significant slope only for the spectral parameter, with no change as a function of temporal variation.
Subtraction Analysis The analysis contrasting all temporal conditions to all spectral conditions yielded increased CBF to the temporal condition in two sites: left and right HG (Fig. 4; Table 2). The converse comparison (higher CBF to spectral than temporal conditions) yielded two sites in the left and right anterior STG (Fig. 4; Table 2). The stereotaxic locations of these areas were similar to those observed in the covariation analysis (vector distance between corresponding points in left and right HG were 1 and 16 mm, respectively; for the STG region the distances were 9 and 21 mm). Regions of interest placed on each of these locations yielded the average CBF differences illustrated in the bar graphs shown in Figure 4. To evaluate the presence of significant hemispheric differences across these two parameters, we computed an index of asymmetry for each pair of regions that took into account the predicted direction of the effect (right minus left for the anterior
950 Spectral and Temporal Auditory Processing • Zatorre and Belin
The analyses revealed two main patterns of results. First, distinct subareas of auditory cortex in both hemispheres respond to temporal as opposed to spectral change: the region of HG was preferentially recruited by progressively increasing temporal variation, whereas anterior STG areas and a right STS region covaried significantly with the spectral parameter (Fig. 2). Secondly, in keeping with the predictions, the left anterior STG region showed a higher slope to the temporal as compared with the spectral parameter, whereas the converse was observed for the right anterior STG and right STS regions (Fig. 3). Both sets of findings were largely confirmed by the direct comparison of spectral to temporal conditions: temporal changes recruit HG in both hemispheres, but with greater response on the left, while spectral changes recruit anterior STG regions bilaterally, with a greater response on the right (Fig. 4). The similarity across analyses is important since each analysis makes different assumptions concerning the nature of the response to the parametric variation. To the extent that both sets of results converge on similar conclusions, one may conclude with greater confidence that the observed effects ref lect systematic differences in the pattern of response. Core versus Belt Areas The finding that primary auditory regions (core areas) in both hemispheres preferentially respond to acoustic temporal features, whereas more anterior STG regions (belt or parabelt areas) respond preferentially to spectral features fits with recent views about the hierarchical arrangement of primate auditory cortex (Kaas et al., 1999). One consistent finding is that pure tone responses are generally best observed in core regions, whereas lateral belt areas have more complex response properties and are often sensitive to stimuli with wider bandwidths (Rauschecker et al., 1995; Rauschecker, 1998). Since belt areas receive projections from the core areas, and hence integrate inputs from more narrowly tuned core units, one might expect the spectral set of stimuli to recruit belt over core areas (Rauschecker et al., 1997) because they involve complex spectral changes over time, and this was indeed what we observed. However, spectral integration is usually understood in terms of multiple frequencies present simultaneously. In the present study, since only a single frequency was presented at any one time, the effect we observed most likely ref lects the integration of different frequencies over time, and may therefore be tied to interactions between units tuned to different frequency bands (Brosch et al., 1999).
The observation that a region in the upper bank of the right STS also responds to increasing spectral complexity fits with recent fMRI findings that STS areas are sensitive to the acoustic shape of human vocal sounds (Belin et al., 2000), since both situations would require sensitivity to subtle changes in spectral energy distribution. More generally, the finding that an STS region responds to these sorts of stimuli is in agreement with the proposal that these regions form part of a ventral stream specialized for object-feature processing, in which spectral information would play an important role (Rauschecker, 1998). The high CBF response to the temporally varying stimuli in the core area (HG) in both hemispheres presumably ref lects the high temporal sensitivity of neurons in this region, but because the amplitude envelope was constant (Fig. 1a), this sensitivity must be specifically related to the temporal rate of frequency change, independently of amplitude modulation. Hemispheric Differences The findings relating to hemispheric differences support the hypothesis that a relative tradeoff may exist between temporal and spectral resolution of the two hemispheres. In a linear system, temporal and spectral resolution are inversely related; although the auditory nervous system is a nonlinear, distributed system, and hence would be unlikely to show a direct reciprocal relation, the differential hemispheric responses observed in the present study may nevertheless ref lect the auditory nervous system’s adaptation to the presence of spectral and temporal features in the acoustic environment. That is, maximizing the processing of rapidly changing information (high temporal resolution) might set an upper limit on frequency resolution; this might explain why the changes in CBF observed within the left anterior STG area were greater to the temporal than to the spectral parameter. Conversely, higher frequency resolution might entail a relative decrement in temporal processing, hence the inverse pattern seen in the right anterior STG and STS regions. Neurophysiological recordings in macaque monkeys have shown that auditor y cortical neurons are highly sensitive to both spectral and temporal features of sounds (Phillips, 1993; Steinschneider et al., 1995; deCharms et al., 1998). Data from several species indicate that core regions often have higher frequency resolution than do belt areas, which may not fit with the current data. However, Eggermont noted that in the AI and AII fields of the cat there was an inverse relation between bandwidth and temporal resolution (Eggermont, 1998), consistent with our proposal. Existing single-unit data are insufficiently certain about the response properties of cortical fields, particularly outside the core, to allow prediction of their responses to stimuli such as those used here; moreover, the relation between blood f low measures and single-unit responses is complex. Further, homologies between monkey and human auditory cortex have not been worked out, and it is not yet known whether auditory cortical architecture in humans and other primates differs qualitatively. Despite these uncertainties, the neuronal functional properties derived from animal studies suggest that the model proposed above is at least plausible, in terms of the type of acoustic information to which neurons are sensitive. Another parallel with the animal literature is provided by evidence that hemispheric differences also exist in several species. For example, Fitch et al. found rate-dependent lefthemisphere lateralization effects for rapidly changing tone sequences in the rat (Fitch et al., 1993). Wetzel et al. report right-hemisphere lateralization for processing frequency modulation in the Mongolian gerbil (Wetzel et al., 1998). These findings
suggest that the laterality effects discussed in the present paper may not be limited to the human ner vous system; if so, then perhaps they should best be characterized as precursors to the development of speech and tonal processing, rather than consequences thereof. The differential temporal and spectral processing capacities in the auditory areas of the two hemispheres, and the hypothesis that these arise from differences in spectral/temporal resolution, help to explain a variety of previous results. The present findings confirm and extend the idea that left auditory regions may be specialized for rapid temporal processing (Tallal et al., 1993), but additionally they provide a unifying framework to account for the complementary specialization of the right auditory cortex. The hypothesis is consistent with prior studies which have shown that damage to left auditory cortical areas often results in deficits in temporal processing that are manifested as speech disorders (Efron, 1963; Phillips and Farmer, 1990; Tallal et al., 1993). The hypothesis is also supported by functional imaging data that indicate left auditory cortex advantages for processing rapidly changing formant transitions in speech or pseudospeech syllables (Fiez et al., 1995; Belin et al., 1998). Additional evidence specifically indicating that left auditory cortical units have higher temporal resolution comes from recent electrophysiological recordings (Liégeois-Chauvel et al., 1999) showing that responses within left HG encode the voiceonset time of a consonant, whereas the right HG did not show sensitivity to this temporal parameter. Even more striking, Liégeois-Chauvel et al. (2001) showed that intracortically recorded auditory evoked potentials were more sharply tuned to frequency in the right auditory cortex than in the left, consistent with the pattern observed in the present study. The hypothesis proposed in this paper also helps to clarify findings of impaired pitch and spectral processing after lesions of right auditory cortical areas, as well as brain imaging evidence in a wide variety of tonal processing tasks. The findings of Johnsrude et al. (Johnsrude et al., 2000) are particularly relevant in this respect: they found that lesions encroaching onto the right (but not left) HG resulted in a specific deficit for judging direction of pitch change. Notably, this impairment did not preclude most patients from completing the task, but raised their threshold by a factor of four. Such a finding can be explained if spectral resolution underlies hemispheric differences: damage to the right auditor y cortex would disrupt the finer-grained mechanism but would leave intact the left auditory cortical areas which presumably have coarser resolution, hence leading to increased thresholds but not a complete inability to discriminate. The findings of Robin et al. (Robin et al., 1990) are also relevant, as they too found that damage to association cortices in the right hemisphere resulted in spectral but not temporal processing deficits, while the converse was obser ved after left-hemisphere damage. Conversely, aspects of tonal processing that depend on small temporal differences, such as discrimination of the temporal microstructure of familiar tunes, are more affected by damage to the left than to the right temporal lobe (Samson et al., 2001). Anatomical Considerations If the hypothesis suggested here is valid, the question arises as to how it is implemented in the auditory cortex. A variety of findings of anatomical and structural asymmetries in human auditory cortices are relevant to this question. In-vivo volumetric measures of HG from MRI scanning have shown a greater volume of white matter underlying the left HG as compared with the right, which could be a consequence of a greater number or
Cerebral Cortex Oct 2001, V 11 N 10 951
denser myelination of fibers into the primary auditory cortex (Penhune et al., 1996). The latter interpretation is supported by post-mortem tissue analysis of the posterior temporal lobe (Anderson et al., 1999), which confirmed a greater volumer of white-matter tissue on the left than on the right, and showed that this was due to greater myelin sheath thickness on the left. In addition, Seldon (Seldon, 1981) reported that cortical columns in the left auditory cortex were more widely spaced than those on the right, and Galuske et al. (Galuske et al., 2000) found wider spacing of intrinsic connections on the left. In addition, Hutsler and Gazzaniga (Hutsler and Gazzaniga, 1996) reported larger left than right layer IV pyramidal cells in the human auditory cortex. The foregoing anatomical differences are consistent with the model proposed here in that greater myelination on the left would allow for faster conduction, thereby leading to greater sensitivity to rapid acoustic changes. At the same time, one may speculate that the wider spacing of cortical columns and greater intrinsic connections on the left would allow integration over larger tonotopically organized areas, thereby leading to poorer spectral resolution. The converse arguments apply to the right auditory cortices, since the structural features would appear to favor higher frequency resolution but slower transmission. Thus, these microstructural anatomical differences between the two hemispheres might provide the neural substrate for the functional differences in spectral/temporal resolution observed in the present study (Klingberg et al., 2000). The present model thus suggests that relatively subtle quantitative differences in neural response properties, present early in the cortical processing stream, may lead to qualitatively distinct functional roles for higher-order processes. The organization of intra-hemispheric local circuits (Ringo et al., 1994) might be sensitive to these initial processing advantages and could lead to more general functional specialization within the hemisphere. The left hemisphere’s predominant role in many complex linguistic functions may thus be tied to a slight initial advantage in decoding speech sounds. We speculate that the important role of the right hemisphere in many, though not necessarily all, aspects of musical perception [cf. Peretz et al. (Peretz et al., 1994)], might then conceivably have arisen as a consequence of this specialization.
Notes We thank B. Pike and A.C. Evans for access to the McConnell Brain Imaging Centre, and its personnel for their assistance; P. A had and M. Bouffard for technical expertise; and W. Serniclaes for helpful discussion. Supported by grants MT11541 and GR13972 from the Canadian Institute for Health Research and an award from the McDonnellPew Cognitive Neuroscience Program to the first author, and by fellowships from France-Télécom and INSERM-FRSQ to the second author. Address correspondence to Robert J. Zatorre, Montreal Neurological Institute, 3801 University St., Montreal, QC H3A 2B4, Canada. Email:
[email protected].
References Anderson B, Southern BD, Powers RE (1999) Anatomic asymmetries of the posterior superior temporal lobes: a postmortem study. Neuropsychiat Neuropsychol Behav Neurol 12:247–254. Belin P, Zilbovicius M, Crozier S, Thivard L, Fontaine A, Masure M-C, Samson Y (1998) Lateralization of speech and auditory temporal processing. J Cogn Neurosci 10:536–540. Belin P, Zatorre RJ, Lafaille P, A had P, Pike B (2000) Voice-selective areas in human auditory cortex. Nature 403:309–312. Binder J, Frost J, Hammeke T, Cox R, Rao S, Prieto T (1997) Human brain language areas identified by functional magnetic resonance imaging. J Neurosci 17:353–362. Brosch M, Schulz A, Scheich H (1999) Processing of sound sequences
952 Spectral and Temporal Auditory Processing • Zatorre and Belin
in macaque auditory cortex: response enhancement. J Neurophysiol 82:1542–1559. Collins D, Neelin P, Peters T, Evans A (1994) Automatic 3D intersubject registration of MR volumetric data in standardized Talairach space. J Comput Assist Tomogr 18:192–205. deCharms R, Blake D, Merzenich M (1998) Optimizing sound features to cortical neurons. Science 280:1439–1443. Divenyi P, Robinson A (1989) Nonlinguistic auditory capabilities in aphasia. Brain Lang 37:290–326. Efron R (1963) Temporal perception, aphasia and déjá vu. Brain 86: 403–423. Eggermont JJ (1998) Representation of spectral and temporal sound features in three cortical fields of the cat. Similarities outweigh differences. J Neurophysiol 80:2743–2764. Evans A, Marrett S, Neelin P, Collins L, Worsley K, Dai W, Milot S, Meyer E, Bub D (1992) Anatomical mapping of functional activation in stereotactic coordinate space. NeuroImage 1:43–53. Fiez JA, Tallal P, Raichle ME, Miezin FM, Katz WF, Petersen SE (1995) PET studies of auditory and phonological processing: effects of stimulus characteristics and task demands. J Cogn Neurosci 7:357–375. Fitch H, Brown C, O’Connor K, Tallal P (1993) Functional lateralization for auditor y temporal processing in male and female rats. Behav Neurosci 107:844–850. Fitch RH, Miller S, Tallal P (1997) Neurobiology of speech perception. Annu Rev Neurosci 20:331–354. Galuske R AW, Schlote W, Bratzke H, Singer W (2000) Interhemispheric asymmetries of the modular structure in human temporal cortex. Science 289:1946–1949. Griffiths TD, Johnsrude IS, Dean JL, Green GGR (1999). A common neural substrate for the analysis of pitch and duration pattern in segmented sound? NeuroReport 10:3825–3830. Halpern AR, Zatorre RJ (1999) When that tune runs through your head: a PET investigation of auditory imagery for familiar melodies. Cereb Cortex 9:697–704. Hugdahl K, Bronnick K, Kyllingsbaek S, Law I, Gade A, Paulson OB (1999) Brain activation during dichotic presentations of consonant–vowel and musical instrument stimuli: a 15O-PET study. Neuropsychologia 37:431–440. Hutsler J, Gazzaniga M (1996) Acetylcholinesterase staining in human auditory and language cortices: regional variation of structural features. Cereb Cortex 6:260–270. Johnsrude IJ, Penhune VB, Zatorre RJ (2000) Functional specificity in right human auditory cortex for perceiving pitch direction. Brain 123:155–163. Kaas JH, Hackett TA, Tramo MJ (1999) Auditory processing in primate cerebral cortex. Curr Opin Neurobiol 9:164–170. Klingberg T, Hedehus M, Temple E, Salz T, Gabrieli JDE, Moseley ME, Poldrack R A (2000) Microstructure of temporo-parietal white matter as a basis for reading ability: evidence from diffusion tensor magnetic resonance imaging. Neuron 25:493–500. Liégeois-Chauvel C, de Graaf JB, Laguitton V, Chauvel P (1999) Specialization of left auditory cortex for speech perception in man depends on temporal coding. Cereb Cortex 9:484–496. Liégeois-Chauvel C, Giraud K, Badier J-M, Marquis P, Chauvel P (2001) Intracerebral evoked potentials in pitch perception reveal a functional asymmetry of human auditory cortex. Ann NY Acad Sci 930:117–132. Milner BA (1962) Laterality effects in audition. In Interhemispheric relations and cerebral dominance (Mountcastle V, ed.), pp. 177–195. Baltimore, MD: Johns Hopkins University Press. Paus T, Perry DW, Zatorre RJ, Worsley K, Evans AC (1996) Modulation of cerebral blood-f low in the human auditory cortex during speech: role of motor-to-sensory discharges. Eur J Neurosci 8:2236–2246. Penhune VB, Zatorre RJ, MacDonald JD, Evans AC (1996) Interhemispheric anatomical differences in human primary auditory cortex: probabilistic mapping and volume measurement from magnetic resonance scans. Cereb Cortex 6:661–672. Peretz I, Kolinsky R, Tramo M, Labrecque R, Hublet C, Demeurisse G, Belleville S (1994) Functional dissociations following bilateral lesions of auditory cortex. Brain 117:1283–1301. Perry DW, Zatorre RJ, Petrides M, Alivisatos B, Meyer E, Evans AC (1999) Localization of cerebral activity during simple singing. NeuroReport 10:3979–3984. Phillips DP (1993) Representation of acoustic events in the primary auditory cortex. J Exp Psychol: Hum Percept Perform 19:203–216. Phillips DP, Farmer ME (1990) Acquired word deafness and the temporal
grain of sound representation in the primary auditory cortex. Behav Brain Res 40:84–90. Raichle M, Martin W, Herscovitch P, Mintun M, Markham J (1983) Brain blood f low measured with intravenous O15 H2O. 1. Theory and error analysis. J Nucl Med 24:790–798. Rauschecker JP (1998) Parallel processing in the auditory cortex of primates. Audiol Neuro-Otol 3:86–103. Rauschecker JP, Tian B, Hauser M (1995) Processing of complex sounds in the macaque nonprimary auditory cortex. Science 268:111–114. Rauschecker JP, Tian B, Pons T, Mishkin M (1997) Serial and parallel processing in rhesus monkey auditory cortex. J Comp Neurol 382:89–103. Ringo JL, Doty RW, Demeter S, Simard PY (1994) Time is of the essence: a conjecture that hemispheric specialization arises from interhemispheric conduction delay. Cereb Cortex 4:331–343. Robin DA, Tranel D, Damasio H (1990) Auditory perception of temporal and spectral events in patients with focal left and right cerebral lesions. Brain Lang 39:539–555. Samson S, Ehrlé N, Baulac M (2001) Cerebral substrates for musical temporal processes. Ann NY Acad Sci 930:166–178. Seldon H (1981) Structure of human auditory cortex, II. Axon distributions and morphological correlates of speech perception. Brain Res 229: 295–310. Shannon R, Zeng F-G, Kamath V, Wygonski J, Ekelid M (1995) Speech recognition with primarily temporal cues. Science 270:303–304. Sidtis JJ, Volpe BT (1988) Selective loss of complex-pitch or speech discrimination after unilateral lesion. Brain Lang 34:235–245. Steinschneider M, Schroeder C, Arezzo J, Vaughan H (1995) Physiologic correlates of the voice onset time boundary in primary auditory
cortex of the awake monkey: temporal response patterns. Brain Lang 48:326–340. Talairach J, Tournoux P (1988). Co-planar stereotaxic atlas of the human brain. New York: Thieme Medical Publishers, Inc. Tallal P, Newcombe F (1978) Impairment of auditory perception and language comprehension in dysphasia. Brain Lang 5:13–24. Tallal P, Miller S, Fitch R (1993) Neurobiological basis of speech: a case for the preeminence of temporal processing. Ann N Y Acad Sci 682: 27–47. Wetzel W, Ohl F, Wagner T, Scheich H (1998) Right auditory cortex lesion in Mongolian gerbils impairs discrimination of rising and falling frequency-modulated tones. Neurosci Let 252:115–118. Worsley K, Evans A, Marrett S, Neelin P (1992) A three-dimensional statistical analysis for CBF activation studies in human brain. J Cereb Blood Flow Metab 12:900–918. Zatorre RJ (1985) Discrimination and recognition of tonal melodies after unilateral cerebral excisions. Neuropsychologia 23:31–41. Zatorre RJ (1988) Pitch perception of complex tones and human temporal-lobe function. J Acoust Soc Am 84:566–572. Zatorre RJ, Binder JR (2000) Functional and structural imaging of the human auditor y system. In Brain mapping: the systems (Toga A, Mazziota J, eds), pp. 365–402. Los Angeles, CA: Academic Press. Zatorre RJ, Halpern AR (1993) Effect of unilateral temporal-lobe excision on perception and imagery of songs. Neuropsychologia 31:221–232. Zatorre RJ, Samson S (1991) Role of the right temporal neocortex in retention of pitch in auditory short-term memor y. Brain 114: 2403–2417. Zatorre RJ, Evans AC, Meyer E (1994) Neural mechanisms underlying melodic perception and memory for pitch. J Neurosci 14:1908–1919.
Cerebral Cortex Oct 2001, V 11 N 10 953