letters to nature study reinforces this notion by relating the changes in the angular declination below the horizon to perceived eye level, and demonstrating that the eye level serves as a reference for the visual system to compute the angular declination below the horizon. M
19. Epstein, W. Perceived depth as a function of relative height under three background conditions. J. Exp. Psychol. 72, 335±338 (1966). 20. Wallach, H. & O'Leary, A. Slope of regard as a distance cue. Percept. Psychophys. 31, 145±148 (1982). 21. Philbeck, J. W. & Loomis, J. M. Comparison of two indicators of perceived egocentric distance under full-cue and reduced-cue conditions. J. Exp. Psychol. Hum. Percept. Perform. 23, 72±85 (1997).
Methods
Acknowledgements
Thirteen naive observers with informed consent and one author with self-reported normal vision participated in the various experiments.
We thank K. A. May and P. J. Gunther for their assistance in collecting the data in the ®rst experiment. This research was supported in part by grants from the Knights Templar Eye Foundation and the Southern College of Optometry (to T.L.O.) and a Competitive Enhancement Grant from the University of Louisville (to Z.J.H.).
Blindfolded-walking paradigm in the light
Correspondence and requests for materials should be addressed to T.L.O. (e-mail:
[email protected]).
Observers
The observer stood in a hallway 25 m long (starting about 10 m to one end of the hallway) and previewed a rectangular cardboard target (2.12 degrees) on the ¯oor at one of ®ve distances (1.5, 3.0, 4.5, 6.0 or 7.5 m). The observer then wore a blindfold and walked the remembered distance in the direction of the target (which had been removed). When the judged distance was reached, the experimenter measured it, and then led the observer in blindfold to the starting point to begin a new trial (no feedback was provided). Each target distance was measured twice (counterbalanced).
Blindfolded-walking paradigm in the dark The observer stood in a dark room and previewed an internally illuminated red tabletennis ball (target, 0.16 cd m-2) at one of four distances (1.5, 2.5, 3.75 or 5.0 m) and three elevations (on the ¯oor, 0.5 m above the ¯oor, or 0.5 m below the eye). The target was then removed for the observer to begin walking in the dark, traversing the remembered target distance. On reaching the destination, the observer gestured the remembered target elevation with his/her left hand. No feedback was given to the observer. Each target location was randomly selected and measured twice. All targets viewed from the same distance had the same physical size, which subtended 0.23 degrees at the eye level.
Prism-adaptation method The observer wore a pair of base-up prism goggle (10 PD (5.73 degrees) or 20 PD (11.5 degrees) from Bernell/USO) for 20 min, while actively performing one of two tasks: walking about, with the speci®c instruction to navigate complex obstacle courses in the natural visual environment; or standing still and throwing beanbags to a target on the ¯oor 1.8 or 3.6 m using the right hand. To maintain the after-effect of prism adaptation during our lengthy experiment when measuring target locations in the dark, the observer wore the prisms in a lighted room between trials.
Judging eye-level task In a dark room, the observer stood still with his/her head held by a head and chin rest. A red light target (supported by a wall) that subtended 0.23 degrees was moved by the experimenter from a viewing distance of 2.4 m from the observer, who would instruct the experimenter to stop moving the light when it was perceived to be at the observer's eye level. The procedure was repeated ®ve times for each condition tested. Received 20 July; accepted 20 September 2001. 1. Attneave, F. Informational aspects of visual perception. Psychol. Rev. 61, 183±193 (1954). 2. Gibson, J. J. The Perception of the Visual World (Houghton Mif¯in, Boston, 1950). 3. Sedgwick, H. A. in Human and Machine Vision (eds Rosenthal, A. & Beck, J.) 425±458 (Academic, New York, 1983). 4. Sedgwick, H. A. in Handbook of Perception and Human Performance (eds Boff, K. R., Kaufman, L. & Thomas, J. P.) 21.1±21.57 (Wiley, New York, 1986). 5. Sinai, M. J., Ooi, T. L. & He, Z. J. Terrain in¯uences the accurate judgement of distance. Nature 395, 497±500 (1998). 6. Meng, J. C. & Sedgwick, H. A. Distance perception mediated through nested contact relations among surface. Percept. Psychophys. 63, 1±15 (2001). 7. Thomson, J. A. Is continuous visual monitoring necessary in visually guided locomotion? J. Exp. Psychol. Hum. Percept. Perform. 9, 427±443 (1983). 8. Rieser, J. J., Ashmead, D., Talor, C. & Youngquist, G. Visual perception and the guidance of locomotion without vision to previously seen targets. Perception 19, 675±689 (1990). 9. Loomis, J., DaSilva, J., Fujita, N. & Fukusima, S. Visual space perception and visually directed action. J. Exp. Psychol. 18, 906±921 (1992). 10. Loomis, J., DaSilva, J., Philbeck, J. W. & Fukusima, S. Visual perception of location and distance. Curr. Dir. Psychol. Sci. 5, 72±77 (1996). 11. Warren, W. H. & Whang, S. Visual guidance of walking through apertures: Body-scaled information for affordances. J. Exp. Psychol. Hum. Percept. Perform. 13, 371±383 (1987). 12. Held, R. & Freedman, S. Plasticity in human sensorimotor control. Science 142, 455±462 (1963). 13. Hay, J. C. & Pick, H. L. Jr Visual and proprioceptive adaptation to optical displacement of the visual stimulus. J. Exp. Psychol. 71, 150±158 (1966). 14. Sugita, Y. Global plasticity in adult visual cortex following reversal of visual input. Nature 380, 523± 526 (1996). 15. Rieser, J. J., Pick, H. L. Jr, Ashmead, D. H., & Garing, A. E. Calibration of human locomotion and models of perceptual-motor organization. J. Exp. Psychol. Hum. Percept. Perform. 21, 480±497 (1995). 16. Matin, L. et al. Oculoparalytic illusion: Visual-®eld dependent spatial mislocalization by humans partially paralyzed with curare. Science 216, 198±201 (1982). 17. Stoper, A. & Cohen, M. Judgments of eye level in light and in darkness. Percept. Psychophys. 40, 311± 316 (1986). 18. Gogel, W. C. & Tietz, J. D. Absolute motion parallax and the speci®c distance tendency. Percept. Psychophys. 13, 284±292 (1973).
200
................................................................. Linear processing of spatial cues in primary auditory cortex Jan W. H. Schnupp, Thomas D. Mrsic-Flogel & Andrew J. King University Laboratory of Physiology, University of Oxford, Parks Road, Oxford OX1 3PT, UK ..............................................................................................................................................
To determine the direction of a sound source in space, animals must process a variety of auditory spatial cues, including interaural level and time differences, as well as changes in the sound spectrum caused by the direction-dependent ®ltering of sound by the outer ear1. Behavioural de®cits observed when primary auditory cortex (A1) is damaged have led to the widespread view that A1 may have an essential role in this complex computational task2±5. Here we show, however, that the spatial selectivity exhibited by the large majority of A1 neurons is well predicted by a simple linear model, which assumes that neurons additively integrate sound levels in each frequency band and ear. The success of this linear model is surprising, given that computing sound source direction is a necessarily nonlinear operation6±9. However, because linear operations preserve information, our results are consistent with the hypothesis that A1 may also form a gateway to higher, more specialized cortical areas10,11. The ability of many species to pinpoint the direction of a sound source both in azimuth and elevation with an error that may be as little as a few degrees is remarkable, considering the complex and ambiguous nature of the acoustic information available to solve this task. Animals must combine spatial information provided by different acoustic cues, including time-of-arrival and level differences in the signal received at each ear, as well as changes in the spectrum of the signal generated by direction-dependent ®ltering of the sound by the head and external ears. Individually, these cues suffer from inherent ambiguities. For example, within a given narrow frequency band, a number of source directions can generate identical interaural time and level difference values12. Similarly, the ®ltering by the external ears convolves, and thus confounds, spectral localization cues with the source spectra13,14. Consequently, the central auditory system must extract, process and combine information over many frequency channels and from both ears to achieve the highly accurate localization performance exhibited by many species. The fact that damage to A1 in mammals produces marked, and speci®c, de®cits in auditory localization performance2±5, may mean that A1 has a critical role in the pathways underlying spatial hearing and may be responsible for performing many of the computations that underlie the perception of sound source location. Indeed, the most clearly documented behavioural impairment observed following a unilateral lesion of the auditory cortical areas, including A1, is an inability to localize sounds on the side opposite the lesion2±5,15.
© 2001 Macmillan Magazines Ltd
NATURE | VOL 414 | 8 NOVEMBER 2001 | www.nature.com
letters to nature However, more recent studies, carried out in both awake16 and anaesthetized17 animals, have indicated that at least a proportion of neurons in A1 might be adequately described as linear ®lter elements that perform simple additive operations within their frequency±time response ®elds (FTRFs). The response properties of these neurons may therefore be analogous to those of simple cells in the primary visual cortex18. The FTRFs of A1 neurons have been measured using reverse correlation to stimuli presented either in the free ®eld16 or through an earphone to the contralateral ear (the ear on the opposite side of the cerebral hemisphere from which recordings were made) only17. Consequently, these studies were not able to estimate the relative contributions of inputs to each ear, or to derive predictions for responses to binaural stimulation (stimulation of both ears). Therefore, to measure binaural FTRFs of neurons in A1 of the anaesthetized ferret, we have extended this reverse correlation technique16. We concentrated on the dorsal 80% of A1 where frequencies over 4 kHz are represented19, because we are primarily interested in the role of spectral cues to sound localization. In ferrets, directional ®ltering by the structures of the external ear has little effect on frequencies below about 5 kHz and produces very marked spectral patterns only for frequencies of approximately 10 kHz and above20. Using the binaural FTRFs and measurements of the acoustic localization cues generated by the animal's head and external ears we generated predictions for the shape of each neuron's spatial a
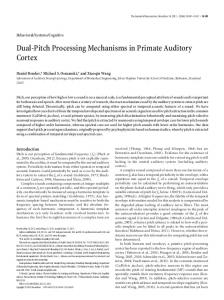
Frequency–time response fields for left and right ear
response ®eld (SRF). These were then compared to detailed maps of the actual SRFs of the same neurons, which were recorded using individualized virtual acoustic space (VAS) stimuli. Figure 1 illustrates how the observed and predicted SRF maps were produced. Sixty-nine neurons (single units) from four animals were characterized in this manner. The data shown in Fig. 1d and Fig. 2 indicate that the linear model was often highly successful at predicting the shape of the SRF (although there were some notable exceptions, see Fig. 2f). The match between the observed and predicted SRF was quanti®ed by calculating the correlation coef®cient for observed versus predicted responses over all those stimulus directions that evoked a measurable (supra-threshold) response in the observed SRF. Figure 3 shows the distribution of correlation coef®cients obtained. In a few cases (Fig. 2f) the model clearly failed to predict the observed SRF, indicating that some high-frequency neurons behaved in a highly nonlinear manner. The predictions also failed for the very few units we recorded which had best frequencies fB well below 4 kHz. This is probably because our binaural FTRFs cannot reveal ITD sensitivity, which can occur in A1 neurons responsive to these relatively low frequencies21. However, 51/69 (74%) of the units with f B . 4 kHz gave r values (correlation coef®cients) above 0.6 and almost half (33/69) gave r . 0:7. These values, as well as the examples in Fig. 2a±e, illustrate that the linear model produced, in most cases, a close approximation of the spatial response pro®le for
b Virtual acoustic space stimuli 16
Frequency (kHz)
4
e Elevation (deg)
1
16
4
60 0 –60 –180 –120
–60
0
60
120
180
Azimuth (deg) 1 –200
–100 Time (ms)
0
–5 0 5 10 dB
f
1
Rate (Hz)
Response
c
0.5 0 200
200 0
100 Time (ms) +90°
d
0
0
g
100 Time (ms) +90°
200
+60°
+60° +30°
+30°
0°
0° –30°
–30° –60° –180°–90°
0°
+90° +180°
Figure 1 Predicting spatial responses from frequency-®ltering characteristics. a, Frequency±time response ®elds (FRTFs) of A1 neurons measured by reverse correlation (see Methods). Convolving (matrix multiplying) the FTRFs with the energy spectrum vectors of the virtual acoustic space (VAS) stimuli for each ear (b) generates a (time-reversed) prediction for the response post stimulus time histogram (PSTH). Summing the predicted PSTHs over all VAS stimuli we obtain a `pooled prediction' (in arbitrary units) (c) which resembles the observed pooled PSTH (f) obtained from the actual NATURE | VOL 414 | 8 NOVEMBER 2001 | www.nature.com
–60° –180°–90°
0°
+90° +180°
responses to VAS stimuli. d, Predicted spatial response ®eld (SRF) generated by measuring the size of the predicted response peak for each VAS position in turn. e, `Raw' SRF, measured with VAS stimuli; the diameter of the red circles is proportional to the mean response. g, Observed SRF map after interpolation and smoothing. Stimulus levels were as follows. VAS (dB above unit threshold): 25; FTRF-weighted VAS (dB SPL): 71; Single tonal revcor component (dB SPL): 60 (see Methods).
© 2001 Macmillan Magazines Ltd
201
letters to nature a
Max
b
8 4 2
Max 16
kHz
kHz
16
8 4
–100
–200
0
–200
Time (ms) Observed
0
–100
Min
–100
–200
Observed
+30°
+30°
0°
0°
Predicted
–60° –180° –90°
0° +90° +180°
Predicted
+90°
0° +90° +180°
+60° +30°
0°
0°
–30°
–30° –60° –180° –90°
–60° –180° –90°
0° +90° +180°
c
Max
0° +90° +180°
d
Max 16
kHz
16
kHz
r = 0.8
+90°
+60° +30°
8
8 4
4 –200
–100
0
–200
Observed
0
–100
Time (ms)
Min
–200
–100
0
–200
0
–100
Time (ms) Observed
r = 0.85
+90°
2
Min
r = 0.81
+90° +60°
+60° +30°
+30°
0°
0° –30°
–30° –60° –180° –90°
Predicted
–60° –180° –90°
0° +90° +180°
Predicted
+90°
0° +90° +180°
+90° +60°
+60° +30°
+30°
0°
0° –30°
–30° –60° –180° –90°
–60° –180° –90°
0° +90° +180°
e
Max
0° +90° +180°
f
Max 16
kHz
16
kHz
Min
–30° –60° –180° –90°
8
8 4
4 –200
–100
0
–200
Time (ms) Observed
+90°
0
–100
Min
r = 0.87
2
–200
–100
0
–200
Time (ms) Observed
+90°
0
–100
Min
r = 0.22
+60°
+60° +30°
+30°
0°
0° –30°
–30° –60° –180° –90°
Predicted
–60° –180° –90°
0° +90° +180°
Predicted
+90°
0° +90° +180°
+90° +60°
+60° +30°
+30° 0°
0°
–30°
–30° –60° –180° –90°
–60° –180° –90°
0° +90° +180°
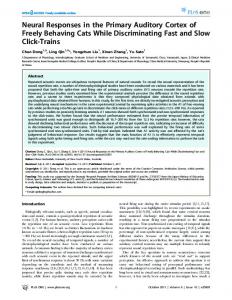
Figure 2 Examples of binaural FTRFs, shown alongside observed and predicted SRFs for six units. Five units generated good predictions (a±e) and for one unit the prediction failed (f). As none of the units illustrated here exhibited signi®cant patterns in their binaural FTRFs at frequencies below 2 kHz, only the top four octaves of the measured binaural 202
0
–100
+60°
–30°
2
–200
+90°
+60°
2
0
Time (ms)
r = 0.85
+90°
2
0° +90° +180°
FTRFs are shown. Correlation (r values) between observed and predicted responses are also given. Stimulus levels for a to f, respectively were as follows. VAS (dB above unit threshold): 20, 40, 20, 25, 15 and 25; FTRF-weighted VAS (dB SPL): 31, 70, 25, 27, 25 and 38; single tonal revcor component (dB SPL): 50, 46, 50, 40, 35 and 50.
© 2001 Macmillan Magazines Ltd
NATURE | VOL 414 | 8 NOVEMBER 2001 | www.nature.com
letters to nature
Number of units
20
15
10
5
0
0
0.2 0.4 0.6 0.8 Correlation coefficient
Figure 3 Distribution of correlation coef®cients for predicted versus observed spatial response ®eld maps.
high-frequency neurons in A1. The use of VAS stimuli that mimic the acoustic properties of the head and outer ears of other individuals, rather than the animal's own, can lead to marked changes in the shapes of the observed SRF22. When we were able to record the binaural FTRF as well as own-ear and foreign-ear SRFs for the same unit, we invariably found that the changes produced by switching to foreign-ear VAS stimuli were also well predicted by the linear model. Figure 4 shows one example for which the differences between the own-ear and foreign-ear SRFs were particularly conspicuous. The successful prediction of the SRFs measured using both sets of VAS stimuli provides a further illustration of the fact that most A1 neurons are well approximated by a binaural linear ®lter model. The behaviour of all but the simplest physical systems is at best only approximately linear over a limited range of input intensities. Nevertheless, linear models can be of great value if they produce good approximations for a suf®ciently large range of inputs. In this study, no attempt was made to match the sound level of the VAS stimuli used to map SRFs to that of the random chord sequences used to estimate binaural FTRFs. VAS stimulus levels within the excitatory bands revealed by the binaural FTRFs were estimated after the measurements and found to be distributed randomly, with a 640 dB range, relative to the level of the random chord stimuli (see Methods). The fact that the linear model generated useful predictions despite these variations in level gives some con®dence that the model holds over a range of sound levels. Also, in a small number of cases, we were able to repeat the SRF mapping at two or three different sound levels. In keeping with previous studies of A1 (refs 23±25), we found that the size and shape of the observed SRFs varied with the sound level used, the fB of the units and the nature of a Own ears Observed +60°
their binaural response properties. In general, units with high fB values and with excitatory inputs from the contralateral ear and inhibitory inputs from the ipsilateral ear (the ear on the same side as the cerebral hemisphere from which recordings were taken) showed the sharpest spatial tuning. At sound levels very close to the neurons' threshold, the observed SRF typically covered just the tip of the predicted SRF shape, whereas, with increasing level, progressively more of the predicted SRF exceeded the threshold and became visible in the observed SRF. Marked nonlinearities have been described at practically all levels of the auditory pathway, beginning with the mechanical response of the basilar membrane26. As in other parts of the central auditory pathway, responses of A1 neurons are known to exhibit a number of well documented nonlinearities, including non-monotonic ratelevel functions and binaural facilitation or occlusion (reviewed in ref. 21). Against this background, the good performance of our linear, binaural ®lter model may seem surprising, particularly as linear operations have little computational power. Nonlinear operations, in contrast, help neurons develop highly selective and speci®c tuning properties, and underlie the sensitivity of auditory neurons to acoustic localization cues6±8 and to combinations of those cues9. If one of the main functions of A1 is indeed to compute the location of a sound source2±5, we might expect neurons in this cortical ®eld to make extensive use of the power inherent in nonlinear operations. On the other hand the amount of information a highly selective neuron transmits on average about the sensory environment will be reduced, because it conveys no information at all about the many aspects of the environment to which its selective properties have rendered it insensitive. In contrast, linear operations, being invertible, may help preserve information. In other words, speci®c nonlinearities are a desirable property in a feature detector, but not necessarily in a neural relay. Accordingly, in as far as A1 neurons act as general purpose gateways to more specialized cortical areas10,11, their approximately linear response properties might help ensure an ef®cient transmission of information to these secondary areas. As in most previous neurophysiological and behavioural studies of auditory localization, we determined the SRFs of A1 neurons using brief noise bursts corresponding to single, stationary sound sources. Examination of the responses of A1 neurons to other stimulus properties suggests that anatomically and functionally distinct regions may exist within this cortical ®eld27,28. Consequently, our ®nding that A1 neurons analyse sound source location in a largely linear manner does not preclude the possibility that at least some of those neurons may respond to other stimulus features in a nonlinear way. For example, it has been reported that the b Foreign ears Observed +60°
+90°
+30°
+30° 0°
0°
–30°
–30° –60°
–60°
–180° –90° 0° +90° +180°
Predicted +60°
+90°
r = 0.81
–180° –90° 0° +90° +180°
Predicted +60°
+90°
r = 0.84
+30°
+30° 0°
0°
–30°
–30° –60°
+90°
–180° –90° 0° +90° +180°
Figure 4 Predicting changes in SRF structure for own-ear and foreign-ear stimuli. Spatial responses were mapped from VAS stimuli generated from the head and external ears of another ferret (foreign ears) instead of the animal's own ears. a, Own-ear and b, foreignNATURE | VOL 414 | 8 NOVEMBER 2001 | www.nature.com
–60°
–180° –90° 0° +90° +180°
ear observed and predicted SRFs for one single unit. Stimulus levels were as follows. VAS (dB above unit threshold): 35; FTRF-weighted VAS (dB SPL): 67; single tonal revcor component (dB SPL): 65.
© 2001 Macmillan Magazines Ltd
203
letters to nature responses of some A1 cells to species-speci®c vocalizations29 or to combinations of different sounds30 may be well suited for processing certain attributes of natural sound sources. M
Methods Spatial receptive ®eld measurement Extracellular recordings were performed in A1 of barbiturate anaesthetized ferrets, using standard techniques22. VAS stimuli for SRF recording were 20-ms gaussian noise bursts convolved with ®nite impulse response ®lters that mimicked the direction-dependent frequency transfer characteristics of the head and outer ears. The ®lters were based on acoustical recordings obtained from each individual animal before the electrophysiological recording sessions. Stimulus presentations from 224 virtual source directions were randomly interleaved. Responses were averaged over ®ve stimulus presentations for each virtual direction. Continuous SRF maps were generated from the averaged responses by triangulation and smoothing with a 458 wide running average ®lter. SRF maps are shown here using a quartic-authalic equal area map projection. See ref. 22 for further details.
Frequency-time response ®eld measurement Binaural FTRFs were determined by reverse correlation to random chord sequence stimuli similar to those introduced in ref. 16. Twenty-millisecond tone pips (5-ms rise/fall time) were started randomly at any of 60 frequency bands that spanned 0.5 to 32 kHz in a tenth of an octave steps. The probability of a tone pip starting in any one frequency band during any 5-ms time interval was set to values between 1 and 2%, so that, on average, 2.4 to 4.8 tone pips would be on simultaneously at any time during the random chord sequence. Tone onsets in different frequency bands and subsequent time intervals were statistically independent. Two statistically independent random chord sequences were presented simultaneously, one to each ear. Binaural FTRFs were determined by spike-triggered averaging of peri-spike random chord sequence segments. Binaural FTRFs were typically based on 500 to 1,500 spikes, which took between 15±20 min to collect. Determined in this way, FTRFs are usually interpreted as posterior probability distributions for the presence of a tonal stimulus in a particular frequency band and ear and at a particular time in the past, given that a spike was observed at time zero. To generate response predictions we use a converse interpretation, namely that the FTRF estimates a change in mean ®ring rate at a particular latency if acoustic energy is applied to a particular frequency band. Inherent in this interpretation is the assumption that the response of A1 neurons is adequately approximated as a sum of acoustic energies, weighted and delayed by frequency band according to the FTRF.
Sound levels Stimulus levels in these experiments were chosen arbitrarily, and varied from unit to unit. Our primary concern was to make good use of the available dynamic range of the digital signal processing equipment, and no attempt was made to match the sound levels of the VAS stimuli used to map the SRFs to the sound levels of the random chord sequences used to estimate the binaural FTRFs. In fact, matching the levels of these very different types of auditory stimuli would pose dif®cult technical problems. However, to allow a post hoc comparison between the sound levels used during the FTRF measurement and the SRF mapping we estimated the level of the VAS stimuli within the excitatory frequency bands revealed by the FTRF. These values are given as FTRF-weighted VAS levels (in dB relative to 20 mPa) in the ®gure legends, and give the average energy of the VAS stimuli weighted by a normalized frequency contour through the maximum of the binaural FTRF at the virtual sound direction where this value is greatest. Also stated is the approximate level of the VAS stimuli relative to the unit threshold (estimated by presenting VAS stimuli at varying attenuations) and the sound level of a single tonal component of the reverse correlation stimuli used to determine the binaural FTRF (the single tonal revcor component). In our data set, FTRF-weighted VAS levels varied from 0 to 90 dB SPL, while tonal revcor component levels varied from 30 to 70 dB SPL. VAS and revcor levels were uncorrelated, and over the range of levels tested, the quality of the linear predictions was independent of sound levels. Received 25 May; accepted 7 September 2001. 1. King, A. J., Schnupp, J. W. H. & Doubell, T. P. The shape of ears to come: dynamic coding of auditory space. Trends Cogn. Sci. 5, 261±270 (2001). 2. Jenkins, W. M. & Merzenich, M. M. Role of cat primary auditory cortex for sound-localization behavior. J. Neurophysiol. 52, 819±847 (1984). 3. Kavanagh, G. L. & Kelly, J. B. Contribution of auditory cortex to sound localization by the ferret (Mustela putorius). J. Neurophysiol. 57, 1746±1766 (1987). 4. Masterton, R. B. in Acoustical Signal Processing in the Central Auditory System (ed. Syka, J.) 1±17 (Plenum, New York, 1997). 5. Heffner, H. E. & Heffner, R. S. Effect of bilateral auditory cortex lesions on sound localization in Japanese macaques. J. Neurophysiol. 64, 915±931 (1990). 6. Goldberg, J. M. & Brown, P. B. Response of binaural neurons of dog superior olivary complex to dichotic tonal stimuli: some physiological mechanisms of sound localisation. J. Neurophysiol. 32, 613±636 (1969). 7. Kitzes, L. M., Wrege, K. S. & Cassady, J. M. Patterns of responses of cortical cells to binaural stimulation. J. Comp. Neurol. 192, 455±472 (1980). 8. Yu, J. J. & Young, E. D. Linear and nonlinear pathways of spectral information transmission in the cochlear nucleus. Proc. Natl Acad. Sci. USA 97, 11780±11786 (2000). 9. PenÄa, J. L. & Konishi, M. Auditory spatial receptive ®elds created by multiplication. Science 292, 249± 252 (2001). 10. Tian, B., Reser, D., Durham, A., Kustov, A. & Rauschecker, J. P. Functional specialization in rhesus monkey auditory cortex. Science 292, 290±293 (2001).
204
11. Recanzone, G. H., Guard, D. C., Phan, M. L. & Su, T. K. Correlation between the activity of single auditory cortical neurons and sound-localization behavior in the macaque monkey. J. Neurophysiol. 83, 2723±2739 (2000). 12. Wightman, F. L. & Kistler, D. J. in Human Psychophysics (eds Yost, W. A., Popper, A. N. & Fay, R. R.) 155±192 (Springer, New York, 1993). 13. Hofman, P. M. & Van Opstal, A. J. Spectro-temporal factors in two-dimensional human sound localization. J. Acoust. Soc. Am. 103, 2634±2648 (1998). 14. Wightman, F. L. & Kistler, D. J. Monaural sound localization revisited. J. Acoust. Soc. Am. 101, 1050± 1063 (1997). 15. Clarke, S., Bellmann, A., Meuli, R. A., Assal, G. & Steck, A. J. Auditory agnosia and auditory spatial de®cits following left hemispheric lesions: evidence for distinct processing pathways. Neuropsychologia 38, 797±807 (2000). 16. deCharms, R. C., Blake, D. T. & Merzenich, M. M. Optimizing sound features for cortical neurons. Science 280, 1439±1443 (1998). 17. Kowalski, N., Depireux, D. A. & Shamma, S. A. Analysis of dynamic spectra in ferret primary auditory cortex. II. Prediction of unit responses to arbitrary dynamic spectra. J. Neurophysiol. 76, 3524±3534 (1996). 18. Movshon, J. A., Thompson, I. D. & Tolhurst, D. J. Spatial summation in the receptive ®elds of simple cells in the cat's striate cortex. J. Physiol. Lond. 283, 53±77 (1978). 19. Phillips, D. P., Judge, P. W. & Kelly, J. B. Primary auditory cortex in the ferret (Mustela putorius): neural response properties and topographic organization. Brain Res. 443, 281±294 (1988). 20. Carlile, S. The auditory periphery of the ferret. II: The spectral transformations of the external ear and their implications for sound localization. J. Acoust. Soc. Am. 88, 2196±2204 (1990). 21. Clarey, J. C., Barone, P. & Imig, T. J. in The Mammalian Auditory Pathway: Neurophysiology (eds Popper, A. & Fay, R.) 232±334 (Springer, New York, 1992). 22. Mrsic-Flogel, T. D., King, A. J., Jenison, R. L. & Schnupp, J. W. H. Listening through different ears alters spatial response ®elds in ferret primary auditory cortex. J. Neurophysiol. 86, 1043±1046 (2001). 23. Brugge, J. F. et al. Simulation of free-®eld sound sources and its application to studies of cortical mechanisms of sound localization in the cat. Hear. Res. 73, 67±84 (1994). 24. Middlebrooks, J. C. & Pettigrew, J. D. Functional classes of neurons in primary auditory cortex of the cat distinguished by sensitivity to sound location. J. Neurosci. 1, 107±120 (1981). 25. Samson, F. K., Barone, P., Clarey, J. C. & Imig, T. J. Effects of ear plugging on single-unit azimuth sensitivity in cat primary auditory cortex. II. Azimuth tuning dependent upon binaural stimulation. J. Neurophysiol. 71, 2194±2216 (1994). 26. Ruggero, M. A. in The Mammalian Auditory Pathway: Neurophysiology (eds Popper, A. N. & Fay, R. R.) 34±93 (Springer, New York, 1992). 27. Schreiner, C. E. Spatial distribution of responses to simple and complex sounds in the primary auditory cortex. Audiol. Neurootol. 3, 104±122 (1998). 28. Read, H. L., Winer, J. A. & Schreiner, C. E. Modular organization of intrinsic connections associated with spectral tuning in cat auditory cortex. Proc. Natl Acad. Sci. USA 98, 8042±8047 (2001). 29. Wang, X. On cortical coding of vocal communication sounds in primates. Proc. Natl Acad. Sci. USA 97, 11843±11849 (2000). 30. Nelken, I., Rotman, Y. & Bar Yosef, O. Responses of auditory-cortex neurons to structural features of natural sounds. Nature 397, 154±157 (1999).
Acknowledgements We are grateful to D. Moore and A. Parker for comments on an earlier draft of this manuscript. This work was supported by Defeating Deafness (Dunhill Research Fellowship to J.W.H.S.) and by the Wellcome Trust (Wellcome Prize Studentship to T.D.M.F. and Wellcome Senior Research Fellowship to A.J.K.). Correspondence and requests for materials should be addressed to J.W.H.S. (e-mail:
[email protected]).
................................................................. Target neuron prespeci®cation in the olfactory map of Drosophila
Gregory S. X. E. Jefferis*²³, Elizabeth C. Marin²³, Reinhard F. Stocker§ & Liqun Luo*² * Neurosciences Program, ² Department of Biological Sciences, Stanford University, Stanford, California 94305, USA § Department of Biology and Program in Neuroscience, University of Fribourg, CH-1700 Fribourg, Switzerland ³ These two authors contributed equally to this work ..............................................................................................................................................
In Drosophila and mice, olfactory receptor neurons (ORNs) expressing the same receptors have convergent axonal projections to speci®c glomerular targets in the antennal lobe/olfactory bulb, creating an odour map in this ®rst olfactory structure of the central nervous system1±3. Projection neurons of the Drosophila
© 2001 Macmillan Magazines Ltd
NATURE | VOL 414 | 8 NOVEMBER 2001 | www.nature.com