tion scheme where spectral peaks are chosen as points of po- tential importance. .... Mel-Frequency Cepstral Coefficient (MFCC) used as the state-of-the art ... be see that it is possi- ble to better model the time-trajectory of the prominent time-.
Spectro-Temporal Activity Pattern (STAP) Features for Noise Robust ASR Shajith Ikbal, Mathew Magimai.-Doss , Hemant Misra , Herv´e Bourlard IDIAP, Martigny, Switzerland. �
ikbal,mathew,misra,bourlard @idiap.ch �
Abstract In this paper, we introduce a new noise robust representation of speech signal obtained by locating points of potential importance in the spectrogram, and parameterizing the activity of time-frequency pattern around those points. These features are referred to as Spectro-Temporal Activity Pattern (STAP) features. The suitability of these features for noise robust speech recognition is examined for a particular parameterization scheme where spectral peaks are chosen as points of potential importance. The activity in the time-frequency patterns around these points are parameterized by measuring the dynamics of the patterns along both time and frequency axes. As the spectral peaks are considered to constitute an important and robust cue for speech recognition, this representation is expected to yield a robust performance. An interesting result of the study is that inspite of using a relatively less amount of information from the speech signal, STAP features are able to achieve a reasonable recognition performance in clean speech, when compared to the state-of-the-art features. In addition, STAP features produce a significantly better performance in high noise conditions. An entropy based combination technique in tandem frame-work to combine STAP features with standard features yields a system which is more robust in all conditions.
1. Introduction Speech signal exhibits spectral and temporal amplitude modulations [1]. The spectral modulation describe the harmonic and formant structure of the speech, where as temporal modulation is due to the syllabic structure. Standard features for automatic speech recognition (ASR) systems, such as mel-frequency cepstral coefficients (MFCC), typically represent the power spectral envelope. In such case, temporal characteristics are typically modeled through the use of derivatives of the static features or the use of contextual information, as done in hybrid HMM systems [2]. In recent years, features explicitly modeling the temporal characteristics, such as TRAPS [3], MCMS [4], FDLP [5], have been used successfully for speech recognition. However, most of the current features give importance either to the temporal modulation or to the frequency modulation, at a time. Where as, physiological studies conducted on different mammal species has revealed that a joint spectro-temporal modeling is necessary for the sound perception [6]. These studies have shown that the mammalian auditory cortical neurons recognize spectro-temporal patterns in the incoming signal during the process of recognizing the sound. In the current work, we explore the possibility of parameterizing the the sound specific activity found in such spectrotemporal patterns for use as features in ASR systems. These features are referred to as Spectro-Temporal Activity Pattern �
Also with EPFL, Lausanne, Switzerland.
(STAP) features. In addition to the joint spectro-temporal modeling of speech signal, our aim in such an exploration is also to generate features that are robust to noisy conditions. In the next section, we first explain the STAP features and then discuss their parameterization. In Section 3, we explain the experimental set up used to evaluate the STAP features. In Section 4, we present and discuss the experimental results.
2. Spectro-Temporal Activity Pattern (STAP) Feature extraction block in a typical speech recognition system divides the speech signal into a sequence of short segments, typically of length 20-30 msec, and extract feature vectors from them. Traditional features typically model the power spectral envelope of the signal within these segments. This paper attempts to find a noise robust parameterization of the time-frequency patterns found in the spectrogram of the speech signal. For this, a certain number of points in the spectrogram are chosen as points of potential importance and the activity of the time-frequency patterns found around those points are parameterized. This is because not all the points in the spectrogram have reliable and robust time-frequency patterns around them for required for sound classification. This new parameterization of speech is referred to as Spectro-Temporal Activity Pattern (STAP) features. Since our aim is also to obtain features that are robust in noisy conditions, the criteria used for identifying the points of potential importance is high Signal-to-Noise Ratio (SNR). Spectral peaks constitute locations of high SNR and are less disturbed by noise. Some of the human perceptual experiments also show that the spectral peaks constitute an important cue for speech recognition. More over, a recent study showing generation of noise robust features involves emphasis of spectral peaks [7]. Hence, we believe, the parameterization of activity of time-frequency pattern around spectral peaks would constitute a robust feature. In the next subsection we explain the dynamic programming algorithm used for identification of the spectral peaks. 2.1. Spectral Peak Identification Peaks of the spectrum are identified using a simple dynamic programming algorithm which serves as a filter yielding peak locations as its output. This algorithm is explained as follows: Figure 1 shows a fully-connected state sequence of two states that are assumed to have emitted the spectrum. The emission likelihood of the spectral energy value for state 1 at any point in the frequency axis is assumed to be the positive value of the energy slope along frequency axis at that point. Likewise, the emission likelihood for the state 2 is negative value of the energy slope. A Viterbi alignment of these two states along the
frequency axis of the spectrum would yield high score only when the state 1 is aligned to the positive sloped regions of the spectrum and state 2 is aligned to the negative sloped regions. Points of transition from state 1 to state 2 constitute the spectral peaks.
5
10
15
20
I
1
F
2
10
20
30
40
50
60
70
80
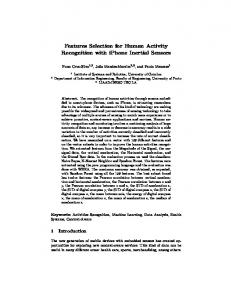
Figure 4: Peak locations identified from the mel-warped filterbank spectrogram of the sample speech utterance. Figure 1: Illustration of spectral peak identification algorithm. In order to avoid the identification of spurious peaks in the spectrum, which usually occur for a short length, both the states 1 and 2 are imposed with minimum duration constraints. This avoids identification of peaks of length less than a certain minimum value. Figure 2 shows the peak location identified by the algorithm for an example spectrum of phoneme ‘ih’. 11 10
Energy
9 8 7 6 5 0
5
10 15 Frequency
20
25
Figure 2: Spikes show the locations of peaks identified in an example filter-bank spectrum corresponding to phoneme ‘ih’. Figure 3 shows mel-warped filter-bank spectrogram of a sample speech utterance taken from OGI Numbers95 database. Figure 4 shows locations of the peaks identified by the algorithm from the spectrogram. From the figures it is clear that there is a close resemblance between the spectral peak trajectories and the trajectories of the peak locations identified.
work, parameters considered for measuring the spectral activity are: 1. frequency index of the peak location ( ), 2. energy level at the peak location ( ), 3. delta of energy around the peak ), 4. acceleration of energy location along the time axis ( along time ( ), 5. delta of energy along frequency ( ), ). These parameand 6. acceleration of along frequency ( ters identified from the spectrogram and are used as the feature components in STAP features. However, since the peak identifying algorithm has no constraints on the number of peaks that can be identified, other than the constraints provided by the spectral dimension and the minimum duration of peaks, the STAP feature dimension can differs for different frames. Hence, to use these features in the conventional speech recognition systems they should be converted into uniform dimensional vectors. This is done by applying masks whose values are non-zeros at the locations of peaks. For example, the part of STAP feature corresponding to parameter is obtained by masking the non-peak locations in the energy normalized spectrogram to zeros. Figure 5 shows a sequence of such uniform dimensional feature vectors for the spectrogram of Figure 3. These features, in fact, have both and information, as the frequency index of the peak locations are also encoded in them. In a similar way, part of the feature corresponding to are obtained by applying the mask on the delta spectrogram, and so on.
�
�����
���� �
�����
� �� �
�
�
� � �
5
10 5
15 10
20 15
10
20
30
40
50
60
70
80
20
10
20
30
40
50
60
70
80
Figure 3: Mel-warped filter-bank spectrogram of a sample speech utterance taken from OGI Numbers95 database.
2.2. Activity Parameterization
Figure 5: Sequence of STAP features where only formation are used.
and
in-
As the spectral peaks are relatively less influenced by the external noise than the other parts of the spectrum, algorithm is expected to yield a similar peak identification result in noisy spectrogram. Figure 6 shows filter-bank spectrogram of the sample speech utterance of Figure 3 added with factory noise from Noisex92 database at 6dB SNR. Figure 7 shows part of the STAP feature obtained from this noisy spectrogram. �
Having identified peak locations, the next step is to parameterize the activity of time-frequency pattern around them. In this
�
� �
�
A visual comparison of this plot with Figure 5 show that the peak identification is reasonably robust and yields a vector similar to that in the clean case. This is in fact validated through the speech recognition experimental results given in the later sections of this paper for noisy conditions. �
� �
�
5
10
15
20
10
20
30
40
50
60
70
80
Figure 6: Mel-warped filter-bank spectrogram of the sample speech utterance added with factory noise from Noisex92 database at 6 dB Signal-to-Noise Ratio (SNR).
5
10
15
20
10
20
30
40
50
60
70
80
Figure 7: Peak locations identified from the mel warped filterbank spectrogram of the noisy speech utterance.
In the next section we explain the experimental setup used for evaluating the STAP features in clean and noisy conditions.
3. Experimental Setup The database used for the experiments is the OGI Numbers95 connected digits telephone speech database [11], having a lexicon size of 30 words, and 27 different phonemes. For additive noise experiments, factory noise from Noisex92 database [12] has been added with Numbers95 database at noise levels such as 12dB, 6 dB, and 0 dB Signal-to-Noise Ratio (SNR). The speech recognition systems used are 1. hybrid HMM system [2] to test the characteristics of STAP features and 2. tandem system [8] to compare the STAP features with state-of-the-art features. MLP used for hybrid HMM system takes 9 or more frames of contextual input and has 27 output units, corresponding to the number of context-independent phones. Hidden layer size is linearly increased with the input feature dimension1 . Tandem systems use pre-nonlinearity outputs taken from a discriminatively trained MLP as feature inputs to standard GMM-HMM system. Hidden Markov Model (HMM) system consists of 80 triphones, 3 left-to-right states per triphone, and 1 This
may raise speculations about the use of different number of parameters for different features. But it has been verified through experiments that the individual performances do not change significantly with increase in the number of parameters.
12 mixture Gaussian Mixture Model (GMM) to estimate emission probability within each state. HMMs are trained using HTK. Mel-Frequency Cepstral Coefficient (MFCC) used as the state-of-the art feature for the experiments are of dimension 39, including 13 static coefficients, 13 delta coefficients, and 13 delta-delta coefficients. STAP feature dimension varies based on how many of the activity describing parameters are used. The parameters are basically extracted from spectrogram obtained with 24 dimensional mel-warped filter-bank spectrum. As we have seen in previous section, STAP feature has many of its components as zeros, because of the masking done to convert all the vectors into uniform dimensional vectors. This in addition with the minimum duration constraint imposed by the peak picking algorithm allow us to down sample the STAP features. Thus in our case, each of the parameter used for STAP feature contributes 12 dimension. Out of the parameters, as mentioned already, and can be encoded in a single 12 dimensional vector. Hence, the use of all the parameters in STAP feature becomes would make its dimension 60.
�
4. Results and Discussion In the first set of experiments, the relative importance of various time-frequency pattern activity describing parameters used in the STAP features is analyzed. These experiments are conducted in a hybrid HMM system whose MLP takes 9 frames of contextual input. Table 1 gives a comparison of the speech recognition performances when the activation describing parameters incorporated in STAP features is varied. First column in the table gives the description of features used and the second column gives the word error rates. It is clear from the results that incorporation of more and more information about the activity of time-frequency patterns around the spectral peaks improves the speech recognition performance. The use of full set of the activity describing parameters gives a recognition performance inferior to the performance of MFCC2 , which is given in the first row of the table. However, this is yet an interesting result considering the fact the information used to achieve this performance is less compared to the one used in MFCC. From the observations we made on the feature vectors, typically 2-4 coefficients of the 12 dimensional feature vectors are non-zeros after masking. Looking at the Figure 5, one can be see that it is possible to better model the time-trajectory of the prominent timefrequency activities with STAP feature than the original spectrogram. This is because the STAP feature in actual has a relatively less information than its capacity and thus an additional source of information incorporated by increasing temporal context can be modeled better. Further more, the information that we consider as disrupting are also masked to zeros. Thus in the next set of experiments, the contextual input to the MLP is increased to 19. The results of these experiments are given in the third column of the Table 1. Results show an improvement in recognition performance with more contextual input for the case of STAP feature vectors, where as for MFCC features it is not the case. In the next set of experiments, a comparison of performances of STAP and MFCC features is made for clean and noisy conditions, using the state-of-the-art tandem system. For 2 As the MFCC features are just a linearly transformed version of the mel-frequency filter-bank spectrum, STAP features are compared, through out this paper, against MFCC instead of directly against melfrequency filter-bank spectrum, which one would think as the right comparison.
Feature used MFCC �
� � � ��� � � � � � �� � � � � � � ��� � �� � � �� � ��� � �� � �
�
�
�
�
�
�
% WER in clean speech for MLP input context size 9 19 8.1 9.0 59.2 47.8 24.8 20.1 16.6 14.4 13.9 10.4
Table 1: Comparison of the speech recognition performances of STAP features incorporated with various time-frequency pattern activity describing parameters.
these experiments, the full set of STAP parameters as given in the final row of Table 1 is used as the STAP feature. First two rows in the table gives the recognition performances of these features. The STAP feature gives a significantly better recognition performance in high noise conditions3 . The last row of the Table 1 give results of a multi-stream combination of STAP and MFCC features in the tandem frame work. The algorithm used for the combination is as follows: The combination is performed at the posterior outputs of the MLPs corresponding to the two features, based on the entropy values of the MLP outputs[9]. The logarithmic posteriors from the outputs of the MLP are weighted with a normalized inverse entropy value and added together to give a representation which are further used as features for HMM-GMM system. The results show that the combination performance is robust in all conditions. Interestingly, in noisy speech, the combination always gives better recognition performance than the better performing feature. Feature MFCC STAP STAP + MFCC
clean 4.7 10.4 6.4
%WER for SNR 12 dB 6 dB 0 dB 12.9 25.8 52.4 15.9 24.3 41.8 12.6 20.9 38.9
Table 2: Performance comparison of STAP and MFCC features in tandem system. Last row give the performance of combination of the two features.
5. Conclusion We have introduced a new representation of speech signal, called Spectro-Temporal Activity Pattern (STAP) features, obtained by parameterization of the activity of the time-frequency patterns around spectral peaks. In spite of the fact that these features use relatively less amount of information from the speech signal than the regular features, they achieve a reasonable recognition performance, when compared to the state-of-the-art features in clean speech. The main advantage of these features is in high noise conditions where they show a significant improvement in recognition performance. Using these features as a complementary features, a multi-stream combination of STAP with MFCC show a robust performance in all conditions. These results point to an interesting future work, where a better parameterization of the activity in the time-frequency pattern, possi3 The recognition performances of STAP features given in Table 1 for noisy conditions are in fact comparable to the performance of standard noise robust features reported in [10, 7].
bly in the neural network frame work could yield better features than the simple parameterization along the time and frequency axes that is used in this paper. Acknowledgments: The authors thank the Swiss National Science Foundation for the support of their work through grant MULTI: FN 2000-068231.02/1 and through National Center of Competence in Research (NCCR) on “Interactive Multimodel Information Management (IM2)”, as well as DARPA for supporting through the EARS (Effective, Affordable, Reusable Speech-to-Text).
6. References [1] M. Kleinschmidt, “Robust Speech Recognition Based on Spectro-Temporal Processing,” Ph.D Dissertation, University of Oldenburg, 2003. [2] H. Bourlard, and N. Morgan, ”Connectionist Speech Recognition: A Hybrid Approach,” The Kluwer International Series in Engineering and Computer Science, Kluwer Academic Publishers, Boston, USA, 1993, Vol. 247. [3] H. Hermansky, “TRAP-TANDEM: Data Driven Extraction of Temporal Features from Speech,” in Proc. of IEEE ASRU 2003 Workshop, St. Thomas, Virgin Islands, USA. Nov-Dec, 2003. [4] V. Tyagi, I. McCowan, H. Misra, and H. Bourlard, “MelCepstrum Modulation Spectrum (MCMS) Features for Robust ASR.” in Proc. of IEEE ASRU 2003 Workshop, St. Thomas, Virgin Islands, USA. Nov-Dec, 2003. [5] H. Athineos, and D.P.W. Ellis, “Frequency-Domain Linear Prediction for Temporal Features,” in Proc. of IEEE ASRU 2003 Workshop, St. Thomas, Virgin Islands, USA. Nov-Dec, 2003. [6] D. Depireux, J. Simon, D. Klein, and S. Shamma, “Spectro-Temporal Response Field Characterization with Dynamic Ripples in Ferret Primary Auditory Cortex.” in Journal of Neurophysiology, 2001, 85:1220-1234. [7] S. Ikbal, H. Hermansky, and H. Bourlard, “Nonlinear Spectral Transformations for Robust Speech Recognition,” in Proc. of IEEE ASRU 2003 Workshop, St. Thomas, Virgin Islands, USA. Nov-Dec, 2003. [8] H. Hermansky, D. Ellis, and S. Sharma, “Tandem Connectionist Feature Extraction for Conventional HMM Systems,” in Proc. of ICASSP-00, Istanbul, June 2000. [9] H. Misra, H. Bourlard, and V. Tyagi, “New Entropy based Combination Rules in HMM/ANN Multi-Stream ASR,” in Proc. of ICASSP-03, Hong Kong, Apr. 2003, II-741–II744. [10] S. Ikbal, H. Misra, and H. Bourlard, “Phase AutoCorrelation (PAC) derived robust speech features,” in Proc. of ICASSP-03, Hong Kong, Apr. 2003, II-133–II-136. [11] R. Cole, M. Noel, T. Lander, and T. Durham, “New telephone speech corpora at CSLU,” in Proceedings of European Conference on Speech Communication and Technology, 1995, vol. 1, pp. 821–824. [12] A. Varga, H. Steeneken, M. Tomlinson, and D. Jones, “The NOISEX-92 study on the affect of additive noise on automatic speech recognition,” Technical report, DRA Speech Research Unit, Malvern, England, 1992.