of paracetamol and diclofenac sodium in bulk drug and tablet dosage form. Simultaneous equation method, absorption ratio method and dual wavelength ...
Rajesh Sharma et al /J. Pharm. Sci. & Res. Vol.2 (12), 2010,821-826
Spectrophotometric Methods for Simultaneous Estimation of Paracetamol and Diclofenac Sodium in Combined Dosage Form by Application of Hydrotropic Solubilization Rajesh Sharma, Geetam Pathodiya, Ganesh Prasad Mishra, Jitendra Sainy School of Pharmacy, Devi Ahilya Vishwa Vidyalaya, Takshashila Campus, Khandwa Road, Indore, Madhya Pradesh, India –452 017 Abstract: In the present investigation, 1.0 M urea solution was employed as hydrotropic solubilizing agent to solubilize poorly water-soluble drug paracetamol for its spectrophotometric analysis. The proposed method is new, simple, environmentally friendly, accurate, reproducible, precise and validated statistically for simultaneous estimation of paracetamol and diclofenac sodium in bulk drug and tablet dosage form. Simultaneous equation method, absorption ratio method and dual wavelength method have been used in the estimation of both the drugs. All the three methods show good accuracy and precision which was validated statistically. The optimized methods showed good reproducibility and recovery with standard deviation of < 1.0% and percent relative standard deviation less then 2.0%, standard error in case of recovery studies are satisfactorily low and allow the simultaneous estimation of paracetamol and diclofenac sodium in concentration ranges employed for this purpose in the assay of bulk drug and tablets. It is, thus, concluded that the proposed method is new, simple, cost-effective, safe, accurate, precise and environmentally friendly. This method can be successfully employed in the routine analysis of both the drugs in tablet dosage form. [[[
Keywords:Paracetamol, Diclofenac Sodium, Simultaneous equation method, Absorption ratio method, Dual wavelength spectrophotometric method, Validation, Hydrotropic solubilizing agent.
Introduction: Chemically Paracetamol (PA) is 4 –hydroxy acetanilide, has analgesic and antipyretic activity[1],[2]. Literature survey revealed that chromatographic method was reported for its estimation from tablet formulation [3],[4] and spectroscopic methods for estimation in combined dosage forms[5]. Diclofenac Sodium(DS) is chemically Sodium salt of 2[{2,6-dichlorophenyl}amino] benzene acetic acid. It is having anti-inflammatory and analgesic properties [1],[2]. Literature survey revealed that chromatographic method was reported for its estimation from tablet dosage form [6] and spectroscopic methods for estimation in combine dosage forms [7]. But so far no spectrophotometric methods has been reported for simultaneous estimation of PA and DS in combined dosage form, hence an attempt has been made to develop simple, sensitive, economical, rapid, precise and accurate methods to analyze the drugs simultaneously, for this, three spectrophotometric methods simultaneous equation method, absorption ratio
method and dual wavelength method have been developed for simultaneous estimation of PA and DS in bulk and tablet dosage form. There was marked enhancement in the solubility of PA in 1.0 M urea solution (hydrotropic agent) as compared to the solubility in distilled water and buffer solutions. Therefore, it was thought worthwhile to extract out the drug from fine powder of tablets with 1.0 M urea solution to carryout the spectrophotometric analysis. Experimental: Materials and Methods: UV-Visible double beam spectrophotometer, Shimadzu model-1700 having spectral bandwidth 3nm and of wavelength accuracy ±1nm, with 1cm quartz cells was used. Pure sample of PA and DS was obtained as gift sample from Zenith Pharma Ltd., Indore (MP). The tablet dosage form, Diclogesic (contain PA 500mg, DS 50Mg) was procured from the local market,Indore,India.1.0 M urea was selected as hydrotropic solubilizing agent. All other material used was of analytical reagent grade.
821
Rajesh Sharma et al /J. Pharm. Sci. & Res. Vol.2 (12), 2010,821-826
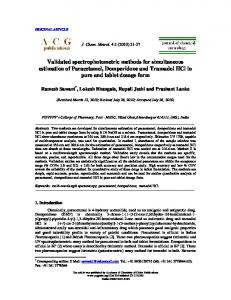
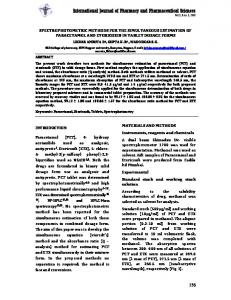
Vierordt’s simultaneous equation method ( Method A): For selection of analytical wavelength for Simultaneous Equation Method [8] the wavelength 247 nm (λmax of PA) and 276 nm (λmax of DS) was selected (Figure 1 and 2). The absorbencies of PA and DS were measured at 247 nm and 276 nm. This method of analysis is based on the absorption of drugs X and Y at the wavelength maxima of the other. The quantification analysis of PA and DS in a binary mixture were performed by using Eqn-1 and Eqn-2. Where Cx and Cy are the concentrations of PA and DS respectively in the diluted sample, ax1 and ax2 are absorptivities of PA at λ1 and λ2 having values 317.80 and 194.00, ay1 and ay2 are absorptivities of DS at λ1 and λ2 having values 144.70 and 304.10 respectively. A1 and A2 are the absorbances of samples at the 247 and 276 nm respectively. CX = A2ay1- A1ay2 / ax2ay1- ax1ay2 CY = A1ax2- A2ax1 / ax2ay1-ax1ay2
Eqn.1 Eqn.2
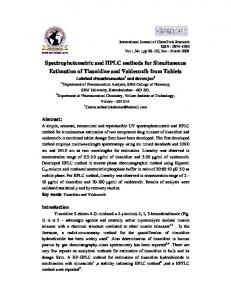
Graphical absorbance ratio Q-Analysis method (Method B): In absorption ratio method [9], absorbances of both the drugs were calculated at two selected wavelengths; among which λ1 is the wavelength of isoabsorptive point of both drugs and λ2 is the λmax of either drug among both drugs. From the overlain spectra (Figure 3) wavelength 268 (isoabsorption point) and 276(λmax of DS) were selected for study. The absorbencies at 268 nm and 276 nm for DS were obtained and similarly for PA absorbencies are measured at 268 nm and 247 nm. The concentration of the individual components were calculated by using the following equations;Cx = Qm-Qy/Qx-Qy)×A1 /ax 1(Eqn.3), Cy = Qm-Qy/Qy-Qx)×A1 /ax 1(Eqn.4) where Qm = A2 /A1 , A 1 is absorbance of sample at isoabsorptive point, A2 is absorbance of sample at λmax of one of the two components, Qx = ax2 /ax1 , Qy = ay2 /ay1, ax 1 and ax 2 represent absorptivities of PA at λ1 and λ2 and ay 1 and ay 2 denote absorptivities of DS at λ1 and λ2 respectively; Cx and Cy be the concentration of PA and DS respectively.
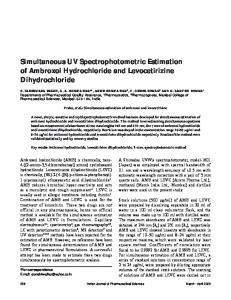
Figure 1: Absorbance graph of PA.
Figure 3: Overlain spectra of PA and DS
Figure 2: Absorbance graph of DS.
Dual wavelength spectrophotometry (Method C): In this method [10],[11], two wavelengths were selected for each drug in a way so that the difference in absorption is zero for one drug at a time. As per spectrum, we found that absorption of PA was same at 245 and 249nm so that these wavelengths were selected for estimation of DS and same as in 257 and
822
Rajesh Sharma et al /J. Pharm. Sci. & Res. Vol.2 (12), 2010,821-826
294nm, absorption of DS were same hence these two wavelengths were selected for estimation of PA. All the mixed standard were scanned at these selected wavelengths and a calibration curve was plotted between absorbance difference and the respective concentrations. The value of coefficient of correlation was 0.9989 and 0.9991 for PA and DS respectively. The sample solutions were measured at selected wavelengths and the values of difference in absorbance were extrapolated on the working standard curve to get the concentration. Preliminary solubility studies of drugs: [12] Solubility of both drugs was determined at 28 ± 2 0C. An excess amount of drug was added to two screw capped 30ml glass vials containing different aqueous systems viz distilled water, buffer of pH 6.4, buffer of pH 8.2, and 1.0 M urea. The vials were shaken mechanically for 12 h at 28+1˚ in a mechanical shaker. These solutions were allowed to equilibrate for next 24 h and then centrifuged for 5 min at 2000 rpm. The supernatant liquid was taken for appropriate dilution after filtered through whatmann filter paper # 41 and analyzed spectrophotometrically against corresponding solvent blank. After analysis, it was found that the enhancement in the solubility of PA and DS was found to be more than 60 and 10 folds respectively in 1.0 M urea as compared to solubility studies in other solvents. Preparation of standard stock solution and calibration curves of PA and DS: About 50mg each of PA and DS were accurately weighted and transferred to 50ml of volumetric flask separately. 40 ml, 1.0 M urea was used to solubilize after shaking for 10 to 15 minutes. Rest of the volume was made up with distilled water to get solution of 1000mcg/ml. Stock solutions of 100mcg/ml of each drugs were prepared by further dilution and scanned over the range of 400nm-200nm in the spectrum mode to get the overlain spectra of both drugs. The spectra exhibit major absorbance maxima at 247 nm and 276 nm for PA and DS respectively and isobestic point at
268nm (Figure 3). In two wave length method absorption difference at 245 and 249, 257 and 294 were calculated and plot calibration curve against concentration to get the linearity of both drugs. Beers-Lambert law obeyed in the range of 5-35 mcg/ml and 5-40 mcg/ml for PA and DS respectively. Five mixed standards 5,10,15,20,25,30 for PA; and 30,25,20,15,10,5 for DS were prepared from stock solutions of PA and DS for further study. Analysis of Tablet Formulation: Twenty tablets (brand name- Diclogesic) were taken and their average weight was determined, they were crushed to fine powder. Then powder equivalent to 50mg (74.96 mg) of PA was taken in 50ml volumetric flask and 40 ml, 1.0 M urea was used to solubilize after shaking for 10 to 15 minutes. Rest of the volume was made up with distilled water to get solution of 1000mcg/ml. Stock solutions of 100mcg/ml of each drugs were prepared by further dilution. The supernatant liquid was transferred to 50ml of volumetric flask through a whatman No-41 filter paper. The residue was washed twice with water and the combined filtrate was made up to 50ml mark with water. The above solution was further diluted to get a solution containing 20 mcg/ml of PA and 2 mcg/ml of DS. The above binary mixture was analyzed at appropriate wavelengths and values of the absorptions were substituted in the respective formulas (Eqn.1,2,3,4) to obtain the content of PA and DS. In two wave length method the sample solution was scanned at 247 nm, 276 nm, 268 nm, 276 nm and the concentration of PA and DS was determined from their calibration curve plotted between absorption difference and concentration. The results of analysis were given in Table 1. Recovery studies: To check the accuracy of the developed methods and to study the interference of formulation additives, analytical recovery experiments was carried out by standard addition method. From that total amount of drug found and percentage recovery was calculated. The results were reported in Table 2.
823
Rajesh Sharma et al /J. Pharm. Sci. & Res. Vol.2 (12), 2010,821-826
Table 1: Result of pharmaceutical formulation analysis Method-A Parameters PA DS 500 50 Label claim (mg/Tab)
Method-B PA DS 500 50
Method-C PA DS 500 50
Found (mg/Tab) Drug contenta
500.01 100.70
49.11 99.54
500.03 100.05
50.75 100.29
498.13 99.72
51.34 101.90
±S.D
0.230
0.197
0.222
0.642
0.320
0.586
%COV
0.187
0.120
0.487
0.290
0.394
0.455
SE
0.311
0.332
0.339
0.508
0.228
0.629
a
Value for drug content (%) are the mean of five estimation
Method-A: Vierordt’s simultaneous equation method Method-B: Graphical absorbance ratio Q-Analysis method Method-C: Dual wavelength spectrophotometry. S.D: Standard deviation , COV : Coefficient of variance and S.E : Standard error.
Table 2: Result of Recovery studies Method
Drug
Labelclaim (mg/tab)
PA
500
DS
50
PA
500
DS
50
PA
500
DS
50
Method-A
Method-B
Method-C
Amount (mg/ml) taken
added
20 60 80 20 60 80 20 60 80 20 60 80 20 60 80 20 60 80
5 10 15 5 10 15 5 10 15 5 10 15 5 10 15 5 10 15
COV% 100.67±0.300 100.00±0.620 100.43±0.418 100.11±0.398 99.95±0.491 99.97±0.221 100.01±0.110 100.21±0.127 99.48 ± 0.204 99.81±0.286 100.1±0.691 101.16±0.23 100.21±0.115 99.65±0.190 100.17±0.436 100.77±0.745 100.20±0.332 101.00±0.690
% Recovery±S.D 0.314 0.311 0.23 0.319 0.613 0.309 0.912 0.172 0.128 0.133 0.6 0.417 0.292 0.091 0.046 0.572 0.228 0.246
%Recovery is mean of three estimation, Method-A: Vierordt’s simultaneous equation method, Method-B: Graphical absorbance ratio Q-Analysis method, Method-C: Dual wavelength spectrophotometry S.D is standard deviation and COV is coefficient of variance.
824
Rajesh Sharma et al /J. Pharm. Sci. & Res. Vol.2 (12), 2010,821-826
Table 3: Intraday , Interdays , LOD and LOQ data of tablet formulation Interday precision %COV Intraday precision Method Drug %COV(n =3) Day 1a Day 2 a Day 3 a PA 0.390 0.225 0.277 0.154 Method A DS 0.190 0.210 0.361 0.086
Method B
LOD (µg/ml) 0.667
LOQ (µg/ml) .990
0.204
1.201
PA
0.112
0.178
0.139
0.115
0.102
1.006
DS
0.202
0.522
0.114
0.102
0.239
0.621
PA
0.343
0.319
0.101
0.213
0.575
0.917
DS
0.177
0.509
0.211
0.513
0.300
1.017
Method C a
Mean of five determinations, COV is coefficient of variance, LOD is least of detection, and LOQ is least of quantitation.
Validation of the developed methods: [13],[14] The developed methods for simultaneous estimation of PA and DS were validated as per ICH guidelines. Accuracy:To check the accuracy of the developed methods and to study the interference of formulation additives, analytical recovery experiments was carried out by standard addition method. Total amount of drug found and percentage recovery was calculated and results were reported in Table 2. Precision:Precision of the method was verified by repeatability and intermediate precision studies. Repeatability:To check the degree of repeatability of the methods, suitable statistical evaluation was carried out. Five samples of the tablet formulations were analyzed for the repeatability study. The standard deviation, coefficient of variance and standard error was calculated. The results were reported in Table 1. Intermediate precision (inter-day and intraday precision):Intermediate precision of the method was checked by assay the sample solution on same day at an interval of one hour (intraday precision) for three hours and on three different days (interday precision) the result was reported in Table 3. This study indicates
that the solutions can be analyzed within 48-72 h without having any bad effect on chemical stability of the drug in presence of urea. Limit of detection (LOD) and limit of quantitation (LOQ):The LOD and LOQ were separately determined based on the standard deviation of response of the calibration curve. The standard deviation of Y-intercept and slope of the calibration curves were used to calculate the LOD and LOQ by using the equations 3.3σ/s for LOD and 10σ/s for LOQ, where σ stands for standard deviation of Y-intercept and S stands for slope of the calibration curve. The results of the same were given in Table 3. Results and Discussion: The mean percent drug estimated was 100.16 and 100.57 for PA and DS respectively indicating the accuracy of the proposed analytical method. Mean Standard deviation for PA and DS was found to be 0.257 and 0.475 respectively. Mean Percent coefficient of variation for PA and DS was found to be 0.356 and 0.288 respectively. Mean standard error for PA and DS was found to be 0.291 and 0.482 respectively(Table 1). The low values of these statistical parameters validated the method. The values of mean percent recoveries for PA and DS was 100.11 and 99.56 respectively(Table 2). This fact, together with satisfactorily low values of statistical parameters (Table 3),
825
Rajesh Sharma et al /J. Pharm. Sci. & Res. Vol.2 (12), 2010,821-826
further validated the method. There was no interference of urea in the estimation. The proposed method can be successfully employed in the routine analysis of PA and DS containing dosage forms. Conclusion: From Table 1, it is evident that there is good agreement between the amounts estimated and those claimed by the manufacturers. Percent label claims are very close to 100 with low values of standard deviation, % coefficient of variation and standard error. Thus, it may be concluded that the proposed method is new, simple, eco-friendly and may prove to be of great importance in pharmaceutical analysis. Reference:
[1]. Budavari S editors, In The Merck Index, 13th
Eds. Merck & Co.Inc. Whitehouse Station (NJ) 2001. [2]. British Pharmacopoeia, Deptt. of health and stationary office under the license from the controller of her majesty office for the health minister, UK, 2007, II, pp. 666 - 672. [3]. Subramanian, G., Shetty, R., Agarwal, S., Udupa, N. Simultaneous reverse phase HPLC estimation of paracetamol and rofecoxib tablets, Ind. J. Pharm.sci. 2005 67, 247-249. [4]. Dinc, F., A comparative study of ratio spectra derivative spectrophotometry vierodt ‘s method and HPLC applied to simulataneous analysis of caffeine and paracetamol in tablet, J. Pharm. Biomed. Anal 1999, 21, 723730. [5]. Aditya, N. Arora, R. K., Tiwari, M., Simultaneous spectrophotometric estimation of valdecoxib and Paracetamol in tablet formulation, Ind. J. Pharm.sci. 2006, 68, 370-373. [6]. Nagoji, K. E. V., Vijayasrinivas, S., Kumar, M., Mathivanan, N., Kumar, S. M., Rao, M. E. B., Simultaneous RPHPLC estimation of
nimesulide and diclofenac sodium, Ind. J. Pharm.sci 2003, [7]. Nagoji, K. E. V., Kumar, K. M., Rao, M. E.B., Rao, K.V., Spectrophotometric Method for simultaneous estimation of nimesulide and diclofenac sodium from Combined dosage form, Ind. J. Pharm.sci. 2003, 65, 404-406. [8]. Davidson, A.G., Beckett, A. H., Stenlake, J.B., Practical Pharmaceutical Chemistry, CBS Publishers & Distributor, 4th ed., New Delhi, 2001, pp. 286-288. [9]. Pernarowski, M., Kneval, A. M., Christian, J.E., Application of absorbency ratios to the analysis of Pharmaceutics, Theory of analysis of binary mixtures. Indian J Pharm. Sci. 1960, 50, 943-947. [10]. Abdel-Aziz, M. W., Omayama, A. R., Azza, A. G., Hoda, M., Marwa, S. M., Spectrophotometric determination of Omeprazole, Lansoprazole and Pantoprazole in Pharmaceutical formulation. J Pharm. Biomed. Anal. 2002, 30, 1133-1142. [11]. Zahran, F., Gouda, A. A., Amin, A. S., Elsheikh, R., Spectrophotometric determination of Pipezethate HCl, dextromethorphan HBr and drotaverine HCl in their pharmaceutical preparations. Spectrochim Acta. A. 2007, 67, 1088- 1093. [12]. Shinde, V. M., Desai, B. S., Tendolakar, N. M.,Selective determination of Fluoroquinolone derivative from tablets by phase HPLC. Indian Drugs. 1998 35, 715717. [13]. Cerci, C. G., Tazo, H. R., Salgado, N., The simultaneous separation and determination of five Quinoline antibiotics using isocratic RPHPLC, application to stability studies on Ofloxacin tablet formulation, J Pharm.Biomed. Anal. 2006, 37, 443-445 [14]. International Conference on Harmonization (ICH), Q2A: Text on Validation of Analytical Procedures: Definitions and Terminology, US FDA Federal Register, 1995.
826