Acta Poloniae Pharmaceutica ñ Drug Research, Vol. 69 No. 6 pp. 1195ñ1199, 2012
ISSN 0001-6837 Polish Pharmaceutical Society
SPECTROPHOTOMETRIC METHODS FOR SIMULTANEOUS ESTIMATION OF ESOMEPRAZOLE MAGNESIUM AND NAPROXEN IN A TABLET DOSAGE FORM NILESH JAIN1*, SNEHA KULKARNI1, DEEPAK KUMAR JAIN2 and SURENDRA KUMAR JAIN1 1
Sagar Institute of Research and Technology-Pharmacy, Bypass Road, Bhopal, M.P-462038 India 2 Truba Institute of Pharmacy, Karond Gandhi Nagar Bypass Road, Bhopal, M.P-462038 India Keywords: esomeprazole, naproxen, simultaneous estimation, Qñanalysis
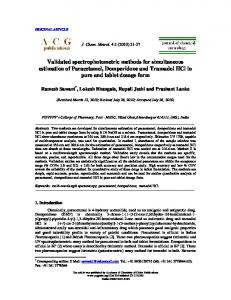
Esomeprazole (ESO) is a proton pump inhibitor which is used as antiulcer agent. It is official in IP and USP. Chemically it is (Fig-1A) (S)-5methoxy-2-[(4-methoxy-3,5-dimethylpyridine-2yl) methylsulfinyl]-3H-benzimidazole (1-3). Several methods have been employed for the estimation of esomeprazole such as spectrophotometric method and RP-HPLC method (5-8). Naproxen (NAP); (Fig-1B) (S)-2-(6-methoxynapthalen-2-yl) propionic acid is used as non steroidal anti-inflammatory agent (1, 2, 4). Literature survey reveals that there are some UV and HPLC method for the estimation of naproxen in pharmaceutical formulations (9, 10). The review of literature revealed that no method was yet reported for the simultaneous estimation of both the drugs in combined dosage forms. This paper describes two simple, rapid, accurate, reproducible and economic methods for the simultaneous estimation of esomeprazole and naproxen in
tablet formulations using simultaneous equation and absorbance ratio method. EXPERIMENTAL Instrument The proposed work was carried out on a Shimadzu UV-visible spectrophotometer (Model UV-1700 series), which possesses a double beam, double detector configuration with matched 1 cm quartz cells. Reagents and standards Reference standard of ESO was a generous gift from Glenmark Pharma Ltd., Baddi, and NAP was obtained from Aurbindo Pharma Ltd., Hyderabad. Methanol was obtained from Merck Chemical Division, Mumbai. Reverse osmosis water was used throughout the study. Commercial tablets of ESO and NAP, VIMOVO (AstraZeneca Mumbai Ltd.)
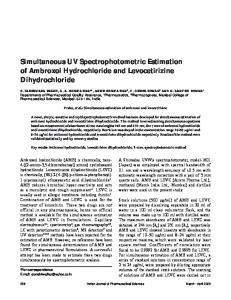
Figure 1. Chemical structure of A ñ esomeprazole and B ñ naproxen
* Corresponding author: e-mail:
[email protected]; mobile: +919425074520
1195
1196
NILESH JAIN et al.
was procured from the local drug market. Label claim of ESO and NAP in tablet is 20 and 500 mg, respectively.
drugs can be simultaneously estimated by simultaneous equation method (Method-1) and absorbance ratio method (Method-II).
Preliminary solubility studies Solubility of ESO and NAP was determined at 25±1OC. Accurately weighed 10 mg ESO and NAP was added in different 10 mL volumetric flasks containing different solvents. It was found that both the drugs are having good solubility in methanol 50%.
Simultaneous equation method (Method I) From the stock solution of 100 µg/mL, working standard solutions of drugs were prepared by appropriate dilution and were scanned in entire UV range to determine the λmax values. Esomeprazole has λmax of 301.60 nm while naproxen has λmax at 330.20 nm, respectively (Fig. 2). Standard solutions were prepared having concentration 5 ñ 25 µg/mL for esomeprazole and 50 ñ 250 µg/mL for naproxen. The absorbances of these standard solutions were measured at 301.60 nm and 330.20 nm and calibration curves were plotted at these wavelengths. Two simultaneous equations (in two variables C1 and C2) were formed using these absorptivity coefficient values. A1 = (0.0487) C1 + (0.0079) C2 (1) A2 = (0.00308) C1 + (0.0065) C2 (2) where, C1 and C2 were the concentrations of ESO and NAP measured in µg/mL, in sample solutions. A1 and A2 were the absorbances of mixture at selected wavelengths 301.60 nm and 330.20 nm, respectively. By applying the Cramerís rule to equation 1 and 2, the concentration CESO and CNAP, can be obtained as follows: A2 (0.0079) ñ A1 (0.0065) (3) CESO = óóóóóóóóóóó A2 (0.0079) ñ A1 (0.0065)
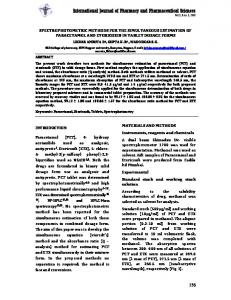
Preparation of standard solution Standard stock solutions were prepared by dissolving separately 100 mg of ESO and 500 mg of NAP in 50 mL of methanol 50% solution and the flask was sonicated for about 10 min to solubilize the drug and the volume was made up to the mark (100 mL) with the same solvent to get a concentration of 1000 µg/mL and 5000 µg/mL for both the drugs respectively. Solutions were diluted with methanol 50% to obtain concentrations in the range 5 ñ 25 µg/mL for ESO and 50 ñ 250 µg/mL for NAP, respectively, for direct analysis. Preparation of overlay spectra Working standard solution from the standard stock solution prepared as stated above of 20 µg/mL of ESO and 200 µg/mL of NAP were scanned in the spectrum mode over the range of 200-400 nm against 50% methanol as blank and the overlaid spectra of the two were recorded. ESO showed an absorbance peak at 301.60 nm whereas NAP shows an absorbance peak at 330.20 nm. The overlaid spectra also showed isoabsorptive points at 311.50 nm (Fig. 2). Due to difference in absorbance maxima and having no interference with each other, both
Figure 2. Overlaid spectra of ESO and NAP
A1 (0.00308) ñ A2 (0.0065) CNAP = ñóñóóóóóóóóóó 0.000293
(4)
Absorbance ratio method (Method II) Q-absorbance method uses the ratio of absorbances at two selected wavelengths, one at isoabsorptive point and other being the λmax of one of the two compounds. From the stock solutions, working standard solutions of esomeprazole (20 µg/mL) and naproxen (200 µg/mL) were prepared by appropriate dilution and were scanned in the entire UV range to determine the maximum absorbance (λmax) and isoabsorptive point. Esomeprazole and naproxen have λmax at 301.60 nm and at 330.20 nm, respectively. Both the drugs were found to have the same absorbance at 311.50 nm (isoabsorptive point). The wavelengths selected for analysis were 311.50 nm and 330.20 nm, respectively (Fig. 2). A series of standard solutions ranging from 5 to 25 µg/mL for esomeprazole and 50ñ250 µg/mL for naproxen were prepared and the absorbance of the solution were measured at 311.50 and 330.20 nm to plot a calibration curve of concentration versus absorbance. The
1197
Spectrophotometric methods for simultaneous estimation of omeprazole...
Table 1. Results of linearity of esomeprazole (ESO) and naproxen (NAP).
METHOD I
PARAMETER
METHOD II
ESO
NAP
ESO
NAP
Working λ
301.6 nm
330.2 nm
311.5 nm
330.2 nm
Beerís law limit (µg/mL)
5ñ25
50ñ250
5ñ25
50ñ250
Correlation coefficient (r )*
0.9994
0.9999
0.9999
0.9999
Slope (m)*
0.0440
0.0068
0.0350
0.0068
Intercept (c)*
0.0015
0.0021
-0.0011
0.0021
2
* Average of five determinations, ESO = esomeprazole, NAP = naproxen
Table 2. Results of recovery studies on marketed formulations.
% Recovery (mean ± SD)*
Recovery level %
METHOD I
METHOD II
ESO
NAP
ESO
NAP
80
98.50 ± 0.064
98.90 ± 0.234
98.50 ± 0.064
97.59 ± 0.358
100
96.70 ± 0.204
99.10 ± 0.176
95.98 ± 0.061
98.03 ± 0.274
120
99.70 ± 0.055
98.40 ± 0.214
98.24 ± 0.098
98.48 ± 0.507
*Average of 5 determinations. ESO = esomeprazole, NAP = naproxen.
Table 3. Results of validation (mean ± SD).
METHOD I
PARAMETER
METHOD II
ESO
NAP
ESO
NAP
Repeatability
97.88 ± 0.05
98.22 ± 0.64
98.64 ± 0.09
99.22 ± 0.49
Precision
Day to day
98.97 ± 0.06
98.97 ± 0.54
99.42 ± 0.08
98.77 ± 0.40
(mean ± SD)*
Analyst to analyst
96.82 ± 0.12
96.82 ± 0.44
96.22 ± 0.09
97.77 ± 0.38
Reproductibility
99.28 ± 0.04
99.10 ± 0.51
98.47 ± 0.20
99.06 ± 0.61
*Average of 5 determiations, ESO = esomeprazole, NAP = naproxen.
Table 4. Results of validation (%RSD).
METHOD I
PARAMETER
Precision (%RSD)*
METHOD II
ESO
NAP
ESO
NAP
Repeatability
0.662
0.643
0.096
0.493
Day to day
0.066
0.540
0.080
0.403
Analyst to analyst
0.122
0.441
0.092
0.384
Reproductibility
0.049
0.517
0.206
0.617
Robustness*
0.099
0.434
0.091
0.822
*Average of 5 determinations, ESO = esomeprazole, NAP = naproxen.
1198
NILESH JAIN et al.
Table 5. Results of statistical parameters for tablet analysis. Drug Method I Method II
Label claim
Amount found
Mean*
S.D.*
%COV*
Std. error*
ESO
20
19.85
99.40
0.187
1.33
0.079
NAP
500
498.64
98.09
0.780
0.641
0.124
ESO
20
19.92
99.39
0.070
0.748
0.013
NAP
500
497.64
98.91
0.392
0.388
0.011
*Average of 5 determinations, ESO = esomeprazole, NAP = naproxen.
calibration curves were found to be linear in the concentration range under study. The concentration of two drugs in mixture was calculated by using following equations: Qm ñ Qy A1 CESO = óóóóóóó (5) Qx ñ Qy ax1 Qm ñ Qx A2 CESO = óóóóóóó (6) Qy ñ Qx ay1 where, A1 and A2 are the absorbances of mixture at 311.50 nm and 330.20 nm and ax1 (0.0349), ax2 (0.0087) and ay1 (0.00349), ay2 (0.0065) are absorptivities E (1%, 1 cm) of esomeprazole and naproxen at 311.50 nm and 330.20 nm and Qm = A2/A1, Qy = ay2/ay1 and Qx = ax2/ax1. Recovery studies The accuracy of the proposed methods was assessed by recovery studies at three different levels i.e., 80%, 100% and 120%. The recovery studies were carried out by adding known amount of standard solution of ESO and NAP to preanalyzed tablet solutions. The resulting solutions were then re-analyzed by proposed methods. The whole analysis procedure was repeated to find out the recovery of the added drug sample. This recovery analysis was repeated at 3 replicate of 3 concentrations levels. Precision studies To evaluate precision at different parameter like repeatability, intermediate precision, and five dilutions in three replicates were analyzed in same day, in two different days by two analysts for day to day and analyst to analyst variation. Robustness As per ICH norms, small but deliberate variations by altering the pH and/or concentration of the solvent were made to check the methods capacity to remain unaccepted. The change was made in the combination of solvent system, containing 50%
methanol. Instead the 50 : 50 ratios of methanol and water, 60 : 40 methanol and water were used as solvent. Analysis of tablet formulation ESO: An amount of 10 mg was weighed from powdered mass of 20 tablets of VIMOVO (AstraZeneca) with the accuracy up to 0.1 mg. This powder was then transferred to 10 mL volumetric flask. The NAP present in this amount of tablet powder was 250 mg. The weighed amount of powder was poured with 8 mL of methanol 50% and sonicated for 15 min to solubilize the drug and then volume was made up to the mark with the same solvent. After sonication, filtration was done through Whatman filter paper No. 41. Filtrate was collected and further diluted with methanol 50% to get the final concentrations of both drugs in the working range. The absorbances of final dilutions were observed at selected wavelengths and the concentrations were obtained from both the methods. The procedure was repeated for three times. RESULTS For both the two methods linearity was observed in the concentration range of 5ñ25 µg/mL for esomeprazole and 50ñ250 µg/mL for naproxen (Table 1). The proposed methods were validated as per ICH guidelines. The accuracy of the method was determined by calculating the mean percentage recovery at 80, 100 and 120% level. The % recovery ranges from 95.98 to 99.70 for esomeprazole and naproxen for both two methods (Table 2). Precision was calculated as repeatability (SD and % RSD is less than 2) and inter and intraday variations (SD and % RSD is less than 2) for both the drugs. The repeatability data and reproducibility data are presented in Tables 3 and 4, respectively. Marketed brand of tablet was analyzed and amount of esomeprazole and naproxen determined by proposed
Spectrophotometric methods for simultaneous estimation of omeprazole...
methods ranges from 98.09 to 99.40 as shown in Table 5. DISCUSSION AND CONCLUSION The proposed methods were found to be simple, accurate and rapid for the routine determination of esomeprazole and naproxen in tablet formulation. To study the validity and reproducibility of proposed methods, recovery studies were carried out. The methods were validated in terms of linearity, accuracy, precision, specificity and reproducibility. Both methods can be successfully used for simultaneous estimation of esomeprazole and naproxen in combined dosage form. REFERENCES 1. Budavari S.E.: The Merck Index. 13th edn. p. 809, Merck & Co. Inc., Whitehouse Station NJ 1569. 2. Indian Pharmacopoeia, pp. 96ñ97, 128ñ129, Government of India, The Controller of Publication, New Delhi 2007.
1199
3. The United States Pharmacopoeia, p. 1809, The United States Pharmacopoeial Convention Inc., Rockville MD 2007. 4. Goodman and Gilmanís. The Pharmacological Basis of Therapeutics, Brunton L.L., Lazo J.S., Keith L.P. Eds., 11th edn., p. 1798, McGrawHill, New York 2006. 5. Trivedi P.D., Maheshwari G.D.: Int. J. ChemTech. Res. 1598 (2010). 6. Gawande V.V., Chandvekar A.V.: Int. J. PharmTech. 617 (2010). 7. Patil S.S., Dhabale P.N., Kuchekar B.S.: Asian J. Res. Chem. 154 (2009). 8. Patel R.K., Rawal B.K., Patel B.H., Patel L.J.: Der Pharma Chemica 251 (2010). 9. Kumar P.R., Shyale S., Gunda M.M., Shantakumar S.M.: J. Chem. Pharm. Res. 484 (2010). 10. Wahbi A.A.M., Mabrouk M.M, Moneeb M.S, Kamal A.H.: Pak. J. Pharm. Sci. 87 (2009). Received: 07. 07. 2011