For this, the correlation functions and the power spectral density (PSD) .... When dealing with spectra, in some derivations we deal with the PSD of x (t), in.
Chapter 20
Spectrum of Quantization Noise and Conditions of Whiteness
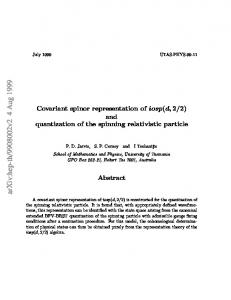
When the input to a quantizer is a sampled time series represented by x1 , x2 , x3 , . . . , the quantization noise is a time series represented by ν1 , ν2 , ν3 , . . . Suppose that the input time series is stationary and that its statistics satisfy the conditions for multivariable QT II (it would be sufficient that two-variable QT II conditions were satisfied for x1 and x2 , x1 and x3 , x1 and x4 , and so forth, because of stationarity). As such, the quantization noise will be uncorrelated with the quantizer input, and the quantization noise will be white, i.e. uncorrelated over time. The PQN model applies. The autocorrelation function of the quantizer output will be equal to the autocorrelation function of the input plus the autocorrelation function of the quantization noise. Fig. 20.1(a) is a sketch of an autocorrelation function of a quantizer input signal. Fig. 20.1(b) shows the autocorrelation function of the quantization noise when the PQN model applies. Fig. 20.1(c) shows the corresponding autocorrelation function of the quantizer output. Corresponding to the autocorrelation functions of Fig. 20.1, the power spectrum of the quantizer output is equal to the power spectrum of the input plus the power spectrum of the quantization noise. This spectrum is flat, with a total power of q 2 /12. When it is known that the PQN model applies perfectly or otherwise applies to a very close approximation, one can infer the autocorrelation function and power spectrum of the quantizer input from knowledge of the autocorrelation function and power spectrum of the quantizer output, since the autocorrelation function and power spectrum of the quantization noise are known, these only need to be subtracted. Spectral analysis of quantization is very simple when the quantization noise is white and uncorrelated with the quantizer input signal. We will present methods for determining the whiteness condition based on the multivariable characteristic function of the quantizer input. Other methods for doing this exist in the literature, and it is the purpose of this chapter to to explore these methods, and in some cases, to enhance them. 529
530
20 Spectrum of Quantization Noise and Conditions of Whiteness R x x (k) E{x 2 } k, lag
(a) Rνν (k) q2 12
(b)
k, lag
R x � x � (k)
2 E{x 2 } + q12
(c)
k, lag
Figure 20.1 Autocorrelation functions when the PQN model applies: (a) input autocorrelation function, (b) quantization noise autocorrelation function, (c) output autocorrelation function.
20.1
QUANTIZATION OF GAUSSIAN AND SINE-WAVE SIGNALS
In this chapter the spectra of the quantized signal and of the quantization noise will be examined. For this, the correlation functions and the power spectral density (PSD) functions will be examined. In order to obtain an overall impression about the spectral behavior of a quantized signal and quantization noise, let us consider two examples: quantization of a bandlimited Gaussian signal and of a sine wave. Example 20.1 Quantization of a Bandlimited Gaussian Signal A bandlimited Gaussian signal may be quantized by a rather rough quantizer, as illustrated in Fig. 20.2. The quantum size q as shown is approximately equal to the standard deviation σ of the input signal. The most important difference between the shapes of x(t) and that of x � (t) and ν(t) is that the latter two contain many discontinuities. It is known from signal theory that discontinuities in the time function result in a relatively broad and slowly decaying spectrum. The sparsely sampled version of the quantization noise ν(ti1 ) in Fig. 20.2(c) consists of seemingly independent (that is, uncorrelated) samples. Uncorrelated samples correspond to a white spectrum. Thus, if sampling is not too dense, whiteness may be a reasonable assumption. Uncorrelatedness of the samples depends on the density of sampling. When sampling is denser, the samples are obviously correlated, as in Fig. 20.2(d).
20.1 Quantization of Gaussian and Sine-Wave Signals
531
x(t) q 0
x(t)
−q
x � (t)
−2q −3q q 2
ν(t) = x � (t) − x(t)
(a)
ν(tk1 )
(b)
ν(tk2 )
(c)
t
0 − q2 q 2
t
0 − q2 q 2
tk1
0 − q2 (d)
tk 2
Figure 20.2 Quantization of a bandlimited Gaussian signal: (a) the input signal x(t) and the quantized signal x � (t); (b) the quantization noise ν(t); (c) sampled quantization noise, sparse sampling; (d) sampled quantization noise, dense sampling.
Example 20.2 Uniform Quantization of a Sine Wave In Fig. 20.3 a sine wave of amplitude A is quantized using a quantum size q = A/3.5. It is clear that both x � (t) and ν(t) are periodic, and, consequently, their spectra are discrete. Spectral broadening in the quantization noise means in this case that an infinite number of harmonics are produced, with a total power of about q 2 /12. Furthermore, though the samples of ν(t) do not exhibit a clear interdependence, periodicity yields a discrete spectrum, thus whiteness in the strict sense certainly does not hold. We will see instead that the power of the harmonics in a not too narrow frequency band, selected between 0 and the sampling frequency f s /2, is more or less proportional to the bandwidth. This is also a kind of “whiteness”.
In this chapter the above observations are investigated in detail. First, the possibilities for an exact mathematical treatment will be discussed, then some results from the literature will be summarized. Either the power spectral density (PSD) function or the autocorrelation function will be examined. They contain the same information since they are Fourier transforms of each other:
532
20 Spectrum of Quantization Noise and Conditions of Whiteness x(t) A
x(t) x � (t)
q 0 −q −A q 2
ν(t) = x � (t) − x(t)
(a)
ν(tk1 )
(b)
ν(tk2 )
(c)
t
0 − q2 q 2
t
0 − q2 q 2
tk1
0 − q2 (d)
tk 2
Figure 20.3 Quantization of a sine wave: (a) the input signal x(t) and the quantized signal x � (t); (b) the quantization noise ν(t); (c) sampled quantization noise, sparse sampling; (d) sampled quantization noise, dense sampling.
S( f ) = F {R(τ )} .
(20.1)
After this, a more practical approach is used to develop simple approximate formulas for design purposes. The aim is to derive expressions that enable the estimation of the impact of quantization on signal spectra, in order to promote the proper design of measurement, control, and signal-processing systems.
20.2
20.2.1
CALCULATION OF CONTINUOUS-TIME CORRELATION FUNCTIONS AND SPECTRA General Considerations
When dealing with spectra, in some derivations we deal with the PSD of x � (t), in others with the PSD of ν(t). In most cases this is not of great consequence, since
20.2 Derivation of Correlation Functions and Spectra
533
�� �� �� Rx � x � (τ ) = E{x � (t)x � (t + τ )} = E x(t) + ν(t) x(t + τ ) + ν(t + τ ) � � = Rx x (τ ) + Rνν (τ ) + Rxν (τ ) + Rνx (τ ) (20.2) and thus
� � Sx � x � ( f ) = Sx x ( f ) + Sνν ( f ) + Sxν ( f ) + Sνx ( f ) .
(20.3)
When x and ν are uncorrelated, and the mean value of ν is zero, that is, the PQN noise model is valid, the last term vanishes both in Eq. (20.2) and in Eq. (20.3), thus Sx � x � ( f ) and Sνν ( f ) depend only on each other, since Sx x ( f ) is given. In the case of correlated x and ν, Sx � x � ( f ) cannot be obtained by simple addition of Sx x ( f ) and Sνν ( f ). Before going into details, two very general results will be presented. First, if the quantization noise is uniformly distributed, that is, either QT I or QT II or QT III/A is satisfied, the variance of the quantization noise, that is, the integral of its power spectral density is known, and depends on q only: ∞ Sνν ( f ) d f = Rνν (0) = var{n} = −∞
q2 . 12
(20.4)
x � (t)
Second, since contains a series of finite discontinuities (“jumps”), the envelope of its Fourier transform (if this exists) vanishes for f → ∞ as O(1/ f ) (Bracewell, 1986, pp. 143–146). Similarly, the envelopes of Sx � x � ( f ) and Sνν ( f ) vanish as O(1/ f 2 ). Example 20.3 Power Spectral Density of a Random Bit Sequence A random bit sequence is a stochastic process which may change its sign at equidistant time instants T (see Fig. 20.4). One can show that the autocorrelation x(t) 1 t −1 T T T T T T T T T T T Figure 20.4 Random bit sequence.
function of the random bit sequence has the following form: � ⎧� ⎨ 1 − |τ | , if |τ | < T T Rx x (τ ) = ⎩ 0 elsewhere.
(20.5)
534
20 Spectrum of Quantization Noise and Conditions of Whiteness The power spectral density is the Fourier transform of the autocorrelation function: � Sx x ( f ) = F {Rx x (τ )} = T
sin(π f T ) πfT
�2 .
(20.6)
Sx x ( f ) vanishes like O(1/ f 2 ), as it is expected.
Example 20.4 Power Spectral Density of a Random Telegraph Signal The random telegraph signal is a binary (two-valued) stochastic process where the time instants of changes of the sign form a Poisson point process (that is, in any time interval the number of changes of the sign is a random variable with Poisson distribution). A time record is shown in Fig. 20.5. Let us determine the power spectral density function. x(t) 1 t −1 Figure 20.5 Random telegraph signal.
First the autocorrelation function will be calculated. The result of the multiplication of two samples can be ±1: • x(t)x(t + τ ) = 1 if in the interval τ the number of sign changes was even. ∞ � P2k (τ ), where P2k (τ ) is the probability of The probability is p1 = k=0
having exactly 2k changes of sign in the interval τ . • x(t)x(t + τ ) = −1 if in the interval τ the number of sign changes was odd. ∞ � The probability is p−1 = P2k+1 (τ ). k=0
From the above expressions, Rx x (|τ |) = (1) ·�p1 + (−1) · p−1 � ∞ � (λ|τ |)2k (λ|τ |)2k+1 − = e−λ|τ | (2k)! (2k + 1)! k=0
∞ � (λ|τ |)n −λ|τ | = (−1)n e n! n=0
= e−2λ|τ | .
(20.7)
20.2 Derivation of Correlation Functions and Spectra
535
The PSD is the Fourier transform of the autocorrelation function: Sx x ( f ) = F{Rx x (τ )} =
4λ2
4λ . + (2π f )2
(20.8)
The power spectral density function vanishes like O(1/ f 2 ), as was expected from the jumps in the time record.
20.2.2
Direct Numerical Evaluation of the Expectations
It is possible to give mathematically correct general formulas for the correlation functions and the spectra. Let us introduce the following notation (see also Fig. 20.6): • Q(x) is the quantization characteristic: x � = Q(x) • Q ν (x) is the quantization noise characteristic: ν = Q ν (x) • f (x1 , x2 , τ ) is the joint probability density function of x(t) and x(t + τ ), where x(t) is a stationary random process. x � = Q(x)
q − q2
x q 2
−q
(a) ν = Q ν (x) q 2
x
− q2 (b) Figure 20.6 Quantizer characteristics of a rounding quantizer: (a) characteristic of the input–output quantizer; (b) characteristic which generates the quantization noise from the input.
Using this notation, the correlation functions are by definition
536
20 Spectrum of Quantization Noise and Conditions of Whiteness
∞ ∞ � � � � �� Q(x1 )Q(x2 ) f (x1 , x2 , τ ) dx1 dx2 , Rx � x � (τ ) = E Q x(t) Q x(t + τ ) = −∞ −∞
�
Rνν (τ ) = E Q ν
�
(20.9)
∞ ∞ � � �� Q ν (x1 )Q ν (x2 ) f (x1 , x2 , τ ) dx1 dx2 . x(t) Q ν x(t + τ ) = −∞ −∞
(20.10) The spectra can be obtained by Fourier transformation of the above expressions. These expressions are theoretically correct. However, closed-form results usually do not exist because of the nonlinearity of Q and Q ν . Therefore, their analytic evaluation can be troublesome. Computer evaluation seems to be more hopeful because Q is piecewise constant and Q ν is piecewise linear. The power of PQN (Eq. (20.4)) can be used to check the quality of approximations and numerical calculations. However, special care should be taken when evaluating Eq. (20.9) or Eq. (20.10) for τ = 0: f (x1 , x2 , τ = 0) is a Dirac impulse sheet. Direct numerical computation may only be performed on the basis of Eq. (20.9) and Eq. (20.10) for τ � = 0, otherwise these equations must be modified as: ∞ Rx � x � (0) =
Q 2 (x) f (x) dx ,
(20.11)
Q 2ν (x) f (x) dx .
(20.12)
−∞
and similarly, ∞ Rνν (0) = −∞
Nevertheless, since the computation is three-dimensional (two independent variables and the parameter τ ), it may need much computing effort. Moreover, numerical results are generally appropriate for the purpose of analysis. To obtain usable results, restrictions (special distribution, special form of spectra, etc.) and approximations have to be introduced for well-defined cases.
20.2.3
Approximation Methods
Approximations are usually based on one of two key ideas.
20.2 Derivation of Correlation Functions and Spectra
537
Approximation Based on the Characteristic Function The first one makes use of the fact that correlation, as a second-order joint moment, can be obtained from the joint characteristic function: � 1 ∂ 2 �(u 1 , u 2 , τ ) �� � R(τ ) = 2 � ∂u 1 ∂u 2 j
,
(20.13)
u 1 =u 2 =0
where ∞ ∞ �(u 1 , u 2 , τ ) =
f (x1 , x2 , τ ) e j (u 1 x1 +u 2 x2 ) dx1 dx2 .
(20.14)
−∞ −∞
Equation (20.13) can be applied to the quantized signal or to the quantization noise (see Eqs. (8.23) and (9.4), respectively). From these expressions, the desired moments can be obtained for a rounding quantizer (Sripad and Snyder, 1977): Rx � x � (τ ) = Rx x (τ ) +
q 2π j
∞ �
∂ �x x
�
2πl1 q , u2, τ
∂u 2
l1 =−∞ l 1 � =0
�� � � � �
�� � 2πl2 ∞ � ∂ , , τ u � � x x 1 q q � + � � 2π j ∂u 1 +
l2 =−∞ l 2 � =0 ∞ 2 � q
4π 2
�
∞ �
�x x
l1 =−∞ l2 =−∞ l 1 � =0 l 2 � =0
u 2 =0
u 1 =0
(−1)l1 l1 (−1)l2 l2
2πl1 2πl2 , ,τ q q
�
(−1)l1 +l2 +1 ,(20.15) l1l2
and ∞ q2 � Rνν (τ ) = 4π 2
∞ �
l1 =−∞ l2 =−∞ l 1 � =0 l 2 � =0
� �x x
2πl1 2πl2 , ,τ q q
�
(−1)l1 +l2 +1 . l1l2
(20.16)
Eqs. (20.15) and (20.16) usually cannot be given in closed form, but the higher-order terms in the infinite sums are often negligible (depending on the form of the CF), and an approximate closed form can be obtained.
538
20 Spectrum of Quantization Noise and Conditions of Whiteness
Approximation Based on the Modulation Principle The noise spectrum can directly be obtained as follows (Claasen and Jongepier, 1981). The quantization noise as a function of the signal amplitude (see Fig. 20.6(b)) can be developed into a Fourier series. For a rounding quantizer, �
2π nx
�
sin ∞ q � q n (−1) Q ν (x) = π n
.
(20.17)
n=1
Since x = x(t) is a time function, Eq. (20.17) is a sum of phase-modulated sine waves. This phase modulation is usually wide-band, since the signal amplitude is generally larger than q. The spectrum can be approximated as follows. Each term can be expressed with the PDF of the derivative of the signal x(t) (Claasen and Jongepier, 1981),
Sνν ( f ) ≈
∞ q2 �
π2
n=1
� 1 fx˙ 2n 2
fq n
� � � d f qn
df
≈
q3 2π 2
∞ f � x˙ n=1
�
fq n 3 n
� .
(20.18)
The quality of approximation depends on the signal shape (Peebles, 1976, pp. 238– 246).
20.2.4
Correlation Function and Spectrum of Quantized Gaussian Signals
For Gaussian signals several methods can be used. We will discuss five different approaches. We will need the PDF and CF of two jointly normal random variables, given in Appendix F.3. Bennett’s Direct Analysis Bennett (1948) dealt with zero mean Gaussian signals. He accomplished a rather lengthy derivation for rounding quantizers, by directly evaluating Eq. (20.10). He obtained the following expression: Rνν (τ ) = σx2 + σx2
� � 2 2 ∞ γ � 1 − 4n2γπ 2 4n π ρ(τ ) e sinh γ π2 n2
n=1 ∞ ∞ ��
� 2 2 )π 2 2 − n 2 )π 2 ρ(τ ) � γ 1 4(m − 4(m +n γ e sinh − γ π 2 n=1 m=1 m 2 − n 2 n� =m
20.2 Derivation of Correlation Functions and Spectra
539
� � ∞ ∞ � 4 (m−0.5)2 +(n−0.5)2 π 2 � γ 1 − γ − σx2 2 e π n=1 m=1 (m − 0.5)2 − (n − 0.5)2 n� =m � ⎛ � ⎞ 4 (m − 0.5)2 − (n − 0.5)2 π 2 ρ(τ ) ⎠, × sinh ⎝− γ
(20.19)
where ρ(τ ) = Rx x (τ )/ Rx x (0) and γ = q 2 /σx2 . The complicated formula in Eq. (20.19) can be well approximated, noticing that |ρ| ≤ 1, and usually γ � 1. The value of Rνν (τ ) significantly differs from zero only if |ρ| ≈ 1. Let us determine an approximation for ρ ≈ 1: Rνν (τ ) ≈
σx2
∞ 2 2 γ � 1 − 4n π γ(1−ρ) e . 2π 2 n2
(20.20)
n=1
Note that Eq. (20.20) gives the values of Rνν (τ ) as a function of ρ (or of Rx x (τ )). Its √ behavior is illustrated in Fig. 20.7, for γ = q/σx = 1/16, exhibiting a strikingly rapid decrease as ρ moves away from 1. As a consequence of this behavior, the autocorrelation function of ν(t) will be much sharper at τ ≈ 0 than that of x(t), and this corresponds to a much broader spectrum. We will come back to this observation later.
4
Rνν σx2
2
10−4
8 6 4 2
10−5
8 6 4
2
10−6
8 6
0.9994 0.9995 0.9996 0.9997 0.9998 0.9999
ρx x 1.0
Figure 20.7 Correlation of quantization noises (“errors”) as a function of the correlation coefficient of the signal samples. 27 q ≈ 2 · 4σx → q ≈ σx /16. After Bennett (1948).
540
20 Spectrum of Quantization Noise and Conditions of Whiteness Example 20.5 Spectrum of the Quantization Noise of a Bandlimited Gaussian Signal Equation (20.20) can be used to obtain the spectrum of the bandlimited white noise, substituting the first two terms of the power series expansion (τ ≈ 0 since ρ ≈ 1),
ρ(τ ) =
(2π Bτ )2 sin(2π Bτ ) =1− + ··· , 2π Bτ 3!
(20.21)
where B is the bandlimit of the input signal. The result is as follows: q2 Sνν ( f ) ≈ 4π 3 B
2
� � 3γ f 2 3γ η , 2π 8π 2 B 2
(20.22)
where
η(y) =
2 ∞ � e−y/n . n3
(20.23)
n=1
Figure 20.8 illustrates the spectra obtained from Eq. (20.22) for some values of γ . The curves are parametrized by the bit number of the A/D converter: by setting the input range equal to (−4σx , 4σx ), the bit number can be expressed as b = log2 (8σx /q).
Application of the Characteristic Function Method An alternative form of the correlation of the quantization noise was obtained for zero mean Gaussian signals by Sripad and Snyder (1977) by using Eq. (20.16): � � 2 2 ∞ ∞ q 2 � � (−1)l1 +l2 −2π 2 σqx2 (l12 +l22 ) 4π l1l2 ρσx2 , e sinh E{ν1 ν2 } = 2 l1l2 π q2
(20.24)
l1 =1 l2 =1
To prove the equivalence of formulas (20.19) and (20.24), consider the single sum in Eq. (20.19) as a special case of the first double sum with m = 0, and write both sums into a form where the indices run from −∞ to ∞. By the following substitutions: in the first double sum l1 = m + n, l2 = m − n; in the second one l1 = m + n − 1, l2 = m − n, thus Eq. (20.24) is obtained. The equivalence of the different terms is illustrated in Fig. 20.9. The figure highlights the method by which Bennett (1948) summed the terms in his three sums, and shows why the sum of Sripad and Snyder (1977) is much simpler.
20.2 Derivation of Correlation Functions and Spectra
4
541
Sνν ( f ) σx2
2
10−5
8 6 4
6 bits
2
10−6
8 6 4
7 bits 8 bits
2
10−7
8 6 4 f
0
40 80 120 160 200 240 280 320 360 B
Figure 20.8 Quantization noise spectra of a bandlimited Gaussian signal (after (Bennett, 1948)). Frequency unit: bandwidth B of the original signal. Power unit: mean signal power (σ 2 ). The interval (−4σx , 4σx ) is equal to the input range of the A/D converter.
Analysis of the Autocorrelation Function of the Noise
Katzenelson (1962) obtained the same results by investigating the autocorrelation function. He made use of Eqs. (20.13) and (8.23), with the assumption that the conditions of QT II are approximately fulfilled. Accordingly, Rνν (τ ) ≈ Rx � x � (τ ) − Rx x (τ )
(20.25)
may be used.1 By using the joint CF of the two-dimensional normal distribution (see Eq. (F.17)), he obtained Eq. (20.20) for ρ ≈ 1. He suggested the following approximation for this expression: Rνν (τ ) ≈
2 2 ∞ q 2 � 1 −4n 2 π 2 (1−ρ(τ )) σqx2 q 2 −4π 2 (1−ρ(τ )) σqx2 e e ≈ . 12 2π 2 k2
(20.26)
k=1
1 It is possible to make the first steps of his derivation exact, using Eq. (20.13) and (8.23). However, the infinite sum will need to be approximated in any event, and the final result will be the same.
542
20 Spectrum of Quantization Noise and Conditions of Whiteness n1
n2 4
4
l1 = m 1 + n 1 l1 = m 2 + n 2 − 1
l1
3 3 2 2 −2 −2
−11 1
−1
4
1 3 2
1
2 2
11
3
4
m2 m1
3
4
l2
l2 = m 1 − n 1 l2 = m 2 − n 2
2 3 4
Figure 20.9 Illustration of the equivalence of the infinite sums (20.19) and (20.24): ◦ = terms of the simple sum in (20.19); • = terms of the first double sum in (20.19); × = terms of the second double sum in (20.19).
The last expression can be obtained by realizing that for ρ ≈ 1 the exponentials in the first few terms of the sum in Eq. (20.26) are all approximately equal to one, and that the following sum converges rapidly: ∞ � 1 π2 . = 6 k2
(20.27)
k=1
Series Representation of the Joint Normal PDF For Gaussian signals there is still another possibility to compute spectra, based on (Amiantov and Tikhonov, 1956). Based on their work, Velichkin (1962) used the following series representation of the two-dimensional Gaussian probability density with zero mean: fx1 ,x2 (x1 , x2 ) =
∞ k � d fx1 (x1 ) dk fx2 (x2 ) ρ k 2k σ . k! x dx1k dx2k
(20.28)
k=1
This formula can be proved e.g. by using Price’s theorem (Papoulis, 1991, p. 161). From Eqs. (20.28) and (20.9), by using ρ(τ )k σx2k = Rkx x (τ ), and assuming a stationary input signal (fx1 (x) = fx2 (x) = fx (x)),
20.2 Derivation of Correlation Functions and Spectra
Rx � x � (τ ) =
∞ �
⎛ ⎝
k=1
∞
−∞
543
⎞2
∞
k � Ak fx (x) ⎠ Rx x (τ ) = Q(x) dx Rk (τ ) , dx k k! σx2k x x
dk
(20.29)
k=1
and
S
x�x�
(f) =
∞ ∞ � � � Ak � k Ak F (τ ) = Ck−1 {Sx x ( f )} , R x x σx2k σx2k k=1
(20.30)
k=1
where Ck { } denotes the (k − 1)th self-convolution. This is a very interesting expression of the spectrum. The coefficients Ak do not depend on the spectrum (or the autocorrelation) of the input signal. This means that the spectral behavior of Sx � x � ( f ) directly depends on the F {Rkx x (τ )} terms. When k = 1, the corresponding component is the original input spectrum multiplied by A1 /σx2 . It can be shown that lim
q→0
A1 = 1. σx2
(20.31)
For other values of n, the Fourier transform of Rnx x (τ ) corresponds to an (n−1)th selfconvolution of Sx x ( f ). That is, with the increase of n the spectrum is increasingly “smeared” along the frequency axis. This is related to the large bandwidth of the quantization noise. Equation (20.30) can be used for the calculation of spectra, though its convergence is rather slow (Robertson, 1969). This convergence can be supervised on-line, realizing that on the one hand Rx � x � (0) =
∞ �
� Ak
k=1
μ2x + σx2 σx2
�k ,
(20.32)
and on the other hand ∞ Rx � x � (0) =
Q 2 (x) fx (x) dx .
(20.33)
−∞
Equation (20.33) can be quickly evaluated, and the result can be used for checking the convergence of the sum in Eq. (20.32). Another possibility for checking the convergence is to use R
x�x�
(0) ≈ μ2x + σx2 +
q2 , 12
(20.34)
544
20 Spectrum of Quantization Noise and Conditions of Whiteness
which is a good approximation of the mean square value for q < σx . Use of the Modulation Principle Let us use Eq. (20.18) to obtain the quantization noise spectrum. The approximation is very good, since for bandlimited Gaussian signals the so-called RMS modulation index (Peebles, 1976, pp. 245–246), which is approximately equal in our case to βrms ≈ 22σx /q, fulfills βrms > 5 .
(20.35)
This condition is amply fulfilled in practical cases. The derivative of a Gaussian process is Gaussian too. The standard deviation can be obtained for the bandlimited white noise from the integral of the spectrum of the derivative: ∞ σx˙2 =
∞ Sx˙ x˙ ( f ) d f =
−∞
(2π f )2 Sx x ( f ) d f = −∞
4π 2 2 2 B σx . 3
(20.36)
By substituting the Gaussian probability density with parameter σx˙ into Eq. (20.18) we obtain �
∞ � 1 1 q3 e √ 2π Sνν ( f ) ≈ 2 2π 2π √ Bσx k=1 k 3
− 12 �
� fq 2 k �2 2π σ B √ x 3
(20.37)
3
which is the same as Eq. (20.22). This is by no means surprising, since Peebles used the same second-order approximation of the autocorrelation function as we did when deriving Eq. (20.22).
20.2.5
Spectrum of the Quantization Noise of a Quantized Sine Wave
Quantization of sine waves presents a much more difficult problem to analyze than the quantization of Gaussian signals. The CF of a sinusoidal signal decreases slowly (see Appendix I.6, Fig. I.6), therefore the autocorrelation function and the spectrum cannot be approximated by just a few terms of the series representations. Moreover, the quantization noise is periodic having the same period length as the signal, so its spectrum is discrete, with a lot of harmonics. Example 20.6 Autocorrelation Function of the Quantization Noise of a Sine Wave The quantization noise of a sine wave can be analyzed numerically. In Fig. 20.10
20.2 Derivation of Correlation Functions and Spectra
545
the autocorrelation function is evaluated for A = 4q. Let us observe the irregular form of the autocorrelation function. This illustrates why is it difficult to handle analytically. q 2 Rνν (τ ) 12
0
τ
2
− q12
− T21
0
T1 2
T1
3T1 2
Figure 20.10 Calculated autocorrelation function of the quantization noise of a sine wave. A = 4q, T1 = 1/ f 1 .
Example 20.7 Power Spectral Density of the Quantization Noise of a Sine Wave The power spectral density function of the quantization noise of a sine wave can be analyzed using a computer, performing numerical Fourier series expansion. The spectrum is full of harmonics, placed in a rather irregular manner. However, some strange “periodic” form shows up in the envelope, and this phenomenon can be described analytically, although providing a rough approximation only.
In the following considerations a reasonable approximation of the quantization noise spectrum will be obtained. Since the characteristic function vanishes very slowly, the approximation of Eq. (20.15) or (20.16) by the first terms will not work, and so the method of phase-modulated sine waves will be used instead. The Fourier spectrum of a sine wave which is phase-modulated by another sine wave, is given in the literature (Peebles, 1976, p. 237). It consists of an infinite sum of harmonics, weighted with values of Bessel functions. For x(t) = A cos (2π f 0 t + β cos(2π f m t)), ∞ � � A2 � 2 Jk (β) δ( f − f 0 − k f m ) + δ( f + f 0 + k f m ) . Sx x ( f ) = 4 k=−∞
(20.38)
546
20 Spectrum of Quantization Noise and Conditions of Whiteness Sˆνν ( f )
2
0.23 12q f 2πq A − 1 00
f
2π A f 1 q
Figure 20.11 Numerical calculation of the power spectral density of the quantization noise of a sine wave. A = 15.5q. The mark on the vertical axis shows the value of the analytical approximation (Eq. (20.41), Fig. 20.13).
By using Eq. (20.17), a second summation is to be accomplished, and an absolute squaring of the obtained coefficients at every frequency line is necessary, in order to obtain power values (Fujii and Azegami, 1967). It is obvious that the result is not fruitful, thus another approach is to be chosen. The spectrum of a quantized sine wave was investigated by Claasen and Jongepier (1981), using Eq. (20.18). If x(t) is a sine wave, (20.39) x(t) = A sin(2π f 1 t + ϕ) , its derivative is also sinusoidal, and the PDF of the derivative is fx˙ (x) =
1 1 0 �2 , � f1 A x 1− 2π f 1 A
for |x| < 2π f 1 A .
2π 2
(20.40)
By substituting Eq. (20.40) into Eq. (20.18), the desired formula is obtained:
Sνν ( f ) ≈
q3 4π 4 f 1 A
8 � 9 9 :1− ∞ � n=1
1
fq 2π f 1 An n3
�2
,
for | f q| < 2π f 1 An ,
(20.41)
20.2 Derivation of Correlation Functions and Spectra
547
where the condition means that for each value of f only those terms are summed for which the condition is satisfied. Equation (20.18) is clearly a rather rough approximation in this case, since this is continuous, while the quantization noise is in reality periodic with the fundamental frequency f 1 (see Fig. 20.10), and has a discrete spectrum (see Fig. 20.11). However, Eq. (20.18) was successfully verified by Claasen and Jongepier, using a spectrum analyzer. The character of a measured spectrum is shown in Fig. 20.12. 0
Sνν ( f ) [dB]
−10 −20
a
−30 b
−40 −50 −60 −70
2π A f 1 q
f
Figure 20.12 Verification of the model of Eq. (20.18) for the case of a sine wave (after c Claasen and Jongepier (1981), �1981 IEEE). Signal amplitude: A = 15.5q. a – spectrum obtained from Eq. (20.18), after smoothing; b – spectrum measured by a spectrum analyzer, with f = 4.9 f 1 .
The analyzer had a resolution of 1 2π A f 1 ≈ 4.9 f 1 .
f ≈ 20 q
(20.42)
The infinite peaks in both the true spectrum and in Eq. (20.41) (see Fig. 20.13) were smoothed by the finite resolution. Verification was successful, because the smoothed versions of the two spectra are very similar. The approximate spectrum obtained from Eq. (20.41) and Eq. (20.40) contains about the same power as the true spectrum in a given bandwidth, if f > f 1 and A � q. In this sense this is a successful attempt to provide a more or less accurate, usable expression of the spectrum of a quantized sine wave.
548
20 Spectrum of Quantization Noise and Conditions of Whiteness Sνν ( f )
2
0.23 12q f 2πq A 1 00
2π A f 1 q
f
Figure 20.13 Approximate spectrum of the quantization noise of a sine wave, based on Eq. (20.41). A = 15.5q.
20.3
CONDITIONS OF WHITENESS FOR THE SAMPLED QUANTIZATION NOISE
Before going into details, let us briefly survey why a white noise spectrum is favorable: (a) The white spectrum does not depend on the form of the input spectrum, thus the spectral behavior of the quantization noise does not depend on that of the input signal. (b) The white spectrum means that the noise samples are uncorrelated, thus wellknown design formulas elaborated for measurements with uncorrelated samples can be used. (c) The power of the quantization noise is uniformly distributed between 0 and f s /2, and this is advantageous in the measurement of spectra. Example 20.8 Quantization Noise in Audio In digital audio techniques it is of outstanding importance that the quantization noise does not result in an annoying audible noise superimposed on the music. With present technology the noise level is not reduced below the hearing threshold, thus at soft parts of music the noise is audible. There are two conditions that should to be fulfilled:
20.3 Conditions of White Spectrum
549
• The noise spectrum should be white, so that the noise is heard and it is not a “tone” due to a more or less concentrated frequency spectrum. • The noise should be uncorrelated with the input signal, otherwise it would act as a kind of distortion component. The first condition will be studied in the next part of this chapter. The second one was treated in Chapter 6.
It should be mentioned here that by appropriate feedback the noise spectrum can be modified in such a way that, at the price of remarkably higher variance, a large part of the quantization noise power is “transferred” to higher frequencies. More details can be found in (Spang and Schultheiss, 1962). We have already seen in the previous sections that the spectrum of the quantization noise is usually broad and flat in a relatively wide band. If only this band is of interest, the spectrum can be considered as being white. However, the quantization noise, considered as a continuous-time stochastic process, cannot have a white spectrum, since its variance is approximately q 2 /12 (see Eq. (20.4)), while a continuous-time white spectrum would in theory have an infinite variance. On the other hand, quantization is usually performed in connection with sampling, or on already sampled data. The effect of sampling a signal is the repetition of its original spectrum. From Fig. 20.14 it is obvious that in the case of smooth spectra and significant overlapping (sufficiently small f s values) the resulting spectrum of the samples is more or less white. Thus, to provide a white spectrum, an upper bound for f s must be determined. S( f ) Sνν � ( f )
0 Sνν ( f ) − fs
0
Sνν ( f − f s ) Sνν ( f − 2 f s ) fs
2 fs
3 fs
f
Figure 20.14 The effect of sampling in frequency domain.
In the time domain, white spectrum means uncorrelated samples. This feature will be useful in understanding the following discussions; on the other hand, this ex-
550
20 Spectrum of Quantization Noise and Conditions of Whiteness
plains why whiteness of the spectrum is advantageous when the effect of quantization is investigated in many systems. Let us formulate now the conditions for a white quantization noise spectrum. The general condition of whiteness was given by Sripad and Snyder (1977). Using the characteristic function method they showed that the necessary and sufficient condition for the uncorrelatedness of noise samples is that the characteristic function of the sample pair of x(t) fulfills the equation � �x1 x2
2πl1 2πl2 , q q
� =0
(20.43)
for every integer value of l1 and l2 , except (l1 , l2 ) = (0, 0). Independence implies uncorrelatedness, thus Eq. (20.43) is a sufficient condition. The exact expression of E{ν1 ν2 } = Rν1 ν2 (τ ) was given in Eq. (20.16), and this has to be equal to zero for |τ | > 0 in order to provide uncorrelatedness. However, to formulate a usable general condition on the basis of Eq. (20.16) seems to be very difficult. Thus, in the following considerations Eq. (20.43) will be used, or Eq. (20.16) will be evaluated for special cases. In the following sections we will deal first with the conditions for a white quantization noise spectrum in the case of the two most often investigated signal types, the Gaussian noise and the sine wave, based on the previous considerations. Then a uniform condition will be formulated, which does not rely on the signal shape.
20.3.1
Bandlimited Gaussian Noise
A Condition Based on Approximate Correlation First let us consider expression Eq. (20.16) of the noise autocorrelation as applied in the Gaussian case (see Appendix F, Eq. (F.17)). The highest quantization noise correlation occurs for ρ ≈ 1, where �x1 x2 (u 1 , u 2 ) ≈ e
−4π 2 (1−ρ)
σx2 q2
.
(20.44)
Under this condition, the dominating terms in expression (20.16) belong to l1 = −l2 = ±1, that is, u 1 = −u 2 = ±2π/q. To ensure that the correlation coefficient of the quantization noise samples is less than, say, 0.1, 2
1 q 2 −4π 2 (1−ρ) σqx2 E{ν1 ν2 } ≈ 2 e < 0.1 , q 2 /12 q 2 /12 4π 2
(20.45)
the inequality ρ