IEEE TRANSACTIONS ON SPEECH AND AUDIO PROCESSING, VOL. 11, NO. 6, NOVEMBER 2003
717
Speech Enhancement Using 2-D Fourier Transform Ing Yann Soon, Member, IEEE, and Soo Ngee Koh
Abstract—This paper presents an innovative way of using the two-dimensional (2-D) Fourier transform for speech enhancement. The blocking and windowing of the speech data for the 2-D Fourier transform are explained in detail. Several techniques of filtering in the 2-D Fourier transform domain are also proposed. They include magnitude spectral subtraction, 2-D Wiener filtering as well as a hybrid filter which effectively combines the one-dimensional (1-D) Wiener filter with the 2-D Wiener filter. The proposed hybrid filter compares favorably against other techniques using an objective test. Index Terms—Noise reduction, speech enhancement, speech processing.
I. INTRODUCTION
T
HE use of speech processing systems for voice communication and voice recognition is becoming very common. This is due largely to the availability of low cost digital signal processors and memory chips. The presence of background noise affects the perceived speech quality and intelligibility as well as degrades the performance of speech coders and voice recognition systems [1], [2]. Hence, it is beneficial to incorporate some form of enhancement to reduce the effect of background noise. Many speech enhancement algorithms are implemented in a transform domain to reduce the noise component embedded in a speech signal. The motive for this is that it is normally easier to filter noise in the transform domain, as the speech signal is not present in equal power in all the transform coefficients. Hence there are noise only coefficients which can be attenuated without overly distorting the underlying speech signals. Various transforms have been used for such purposes, examples are Discrete Fourier transform [3]–[8], Discrete Cosine transform [9], [10], Karhunen Loeve transform [11]–[13], Wavelet transform [14]–[16], etc. Most of these transforms (except Wavelet transform) require a short time frame of speech signals. Filtering can be carried out in the transform domain of this short time frame, where each coefficient is attenuated independently of its neighboring coefficients. This approach is based on the assumption that the transform coefficients are independent of each other. However, performance gain using such a technique has reached a saturation point and many researchers have also attempted to exploit the correlation which still exists amongst different time frames. Boll in [6] first proposes using time averaging or taking
Manuscript received June 6, 2002; revised May 23, 2003. The associate editor coordinating the review of this manuscript and approving it for publication was Dr. Dirk van Compernolle. The authors are with the School of Electrical and Electronic Engineering, Nanyang Technological University, Singapore 639798 (e-mail:
[email protected]). Digital Object Identifier 10.1109/TSA.2003.816063
the minimum of the coefficients with that of the neighboring frames. A weighted average of several frames is also adopted in [17]. Ephraim’s decision directed a priori SNR estimation [8] uses a running average formulation which involves the previous frames. Neighboring frames are also exploited in [10] which uses one-dimensional (1-D) interpolation and in [18] which utilizes a 1-D interpolation and a 2-D smoothing scheme. Hence it is clear that some correlation exists between neighboring frames which can be utilized to achieve further gain in performance. One very natural way of exploiting this remaining correlation is to use a 2-D transform. For this purpose, multiple time frames are arranged into a block and windowed before transformation. Using a 2-D transform allows the use of both spectral subtraction as well as 2-D filtering techniques. The arrangement of the speech data in a 2-D form and its appropriate windowing such that the 2-D Fourier transform can be applied are described in Section II. In Section III, various filtering techniques applicable in the 2-D Fourier transform domain are described. The simplest is magnitude spectral subtraction, while a better scheme is the 2-D Wiener filter. The best scheme consists of a combination of the 1-D Wiener filter and the 2-D Wiener filter. A residual noise reduction scheme using time-frequency filtering can also be applied to remove the remaining residual noise. In Section IV the proposed technique is compared with other techniques such as Minimum Mean Square Error (MMSE) filtering [8] and audio masking-threshold filtering [5] using objective measures. II. BLOCKING AND 2-D TRANSFORM The additive noise model is described by the following equation: (1) is the observed noisy speech, is the clean speech where is the additive background noise. and The observed speech is then divided into overlapping frames of length of 256 samples in each frame. The amount of overlap is normally either 50% or 75%. In this paper, 75% overlapping is used throughout. The th frame, , can be represented by a column vector described by the following equation: (2) All indices used in this paper starts from zero. A speech block can be obtained by arranging a number of frames together to form a matrix. Suitable numbers of frames are found experimentally to be 8, 16 and 32. In this paper, the number of frames used is 16 throughout. Similarly each block overlaps its neighboring block by 50%. The nth speech block can be represented
1063-6676/03$17.00 © 2003 IEEE
718
IEEE TRANSACTIONS ON SPEECH AND AUDIO PROCESSING, VOL. 11, NO. 6, NOVEMBER 2003
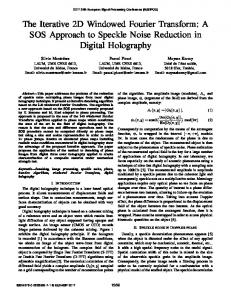
Fig. 1. The 2-D Hamming window, h.
mathematically as a matrix, the following equation:
, of size 256 by 16 as shown in
(3) Similar to the 1-D transform case, a 2-D Hamming window should be applied. The definition of a 2-D Hamming window, is as follows:
(4) A visualization of the 2-D Hamming window can be seen in the mesh plot of Fig. 1. The windowed speech block, (ignoring the block index for simplicity) can be obtained by the dot product of and (5) The 2-D discrete Fourier transform can then be applied onto the speech block. The forward 2-D discrete Fourier transform can be described by the following equation: (6) and the inverse 2-D discrete Fourier transform can be represented by
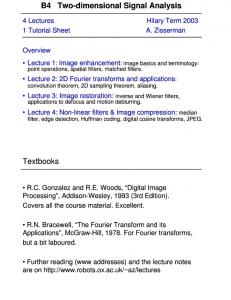
Fig. 2. Spectral magnitude subtraction.
III. TWO-DIMENSIONAL FILTERING A. Spectral Magnitude Subtraction The spectral magnitude subtraction method [6] can be applied to the 2-D Fourier transform case too. In this scheme the magnitude of the Fourier transform coefficient is attenuated by a threshold which is dependent on the expected noise magnitude. Negative resultant values are clipped to zero. The attenuated magnitude is then combined with the noisy phase before the inverse Fourier transform operation is carried out. The block diagram of the 2-D spectral subtraction scheme is given in Fig. 2. Let the transformed noisy speech block be represented by and the enhanced speech block be represented by . The enhancement process can be described by the following equation: (8)
(7) . In (6) and (7), It is clear from the definition of the 2-D Fourier transform that the transform is separable and can be implemented using two passes of the 1-D Fourier transform. One pass is applied row wise while the other pass is applied column wise. This property will be exploited in our hybrid 2-D plus 1-D filtering technique.
The noise characteristics are assumed to be known in this paper. If not, they will have to be estimated adaptively from the silence or speech pause period. , is combined with Following which the noisy phase, the enhanced magnitude as (9)
SOON AND KOH: SPEECH ENHANCEMENT USING 2-D FOURIER TRANSFORM
719
The enhanced speech block in the time domain is obtained through inverse 2-D discrete Fourier transform
In equation form the noise model can be represented as a sum of a zero mean random variable, and a constant term, (18) where
(10) (19)
The effect of windowing can be reversed by (11) The final enhanced speech is obtained by reversing the blocking and framing process
is denoted as The variance of obtained by the following equation:
and can be (20)
The 2-D Wiener filter is expressed as follows:
(12) where the relationship between , lowing equations:
and
is given in the fol-
(21) , , are the local variance of and local means of and . Although the 2-D Wiener filter is not implementable in this state as the statistics of the clean speech are not available, the following approximations can be made:
where (13) where to
denotes the largest integer which is smaller or equal
(22)
(14) and
Similarly
(23) (15)
Hence the 2-D Wiener filter based on the Maximum Likelihood approach is expressed as :
where (16) (24)
and (17) The 2-D spectral magnitude subtraction method results in a residual noise that is spectrally white. This is unlike the 1-D case, in which the residual noise sounds more musical in nature. Moreover, over subtraction of the noise magnitude can be applied resulting in much lower residual noise. However, when over subtraction is used, the residual noise sounds less uniform and is correlated to the speech.
are clipped to zero as Similarly, negative values of in the spectral subtraction case. At the location where there is low speech energy, the attenuation will be high while in the area where there is high speech energy, the attenuation will be low. To some extend, it does correspond to the masking properties of the human ear as noise is likely to be masked off in the neighborhood of a strong speech energy. If the local statistics are computed over a 3 3 window, they can be expressed mathematically as
B. Two-Dimensional Wiener Filtering
(25)
The use of spectral magnitude subtraction in the two-dimensional (2-D) Fourier transform domain does not exploit the 2-D properties, since each coefficient is attenuated independently of its neighbors. A 2-D filter which involves a number of coefficients in a local window can be developed. Furthermore, a more complex noise model can be adopted. The 2-D noise model can be thought to be made up of two components, a dc component as well as an ac component. The dc component represents the mean of the noise magnitudes which is certainly non zero, while the ac component represents the variation of the noise magnitudes.
(26) At the edges of the block, the block is assumed to wrap around so as to provide sufficient values for the computation of the local statistics. This is also justified by the periodic nature of the Fourier transform.
720
IEEE TRANSACTIONS ON SPEECH AND AUDIO PROCESSING, VOL. 11, NO. 6, NOVEMBER 2003
The use of the 2-D Wiener filter results in lower residual noise as compared to the spectral magnitude subtraction scheme as it not only removes the mean noise magnitude level but also reduces the instantaneous ac noise variation from coefficient to coefficient. In the case where only noise exists, the ac noise variance will be reduced by a factor of 9 since a 3 3 window is , is however complete. used. The removal of the mean noise, If a lower level of residual noise is required, the 2-D Wiener filter can be applied iteratively with the updated ac noise variance. The updating of the noise variance at the th iteration is as follows:
(27) Fig. 3. Hamming window for hybrid filtering.
and (28) Hence the 2-D Wiener filter for subsequent iterations, , can be described as follows:
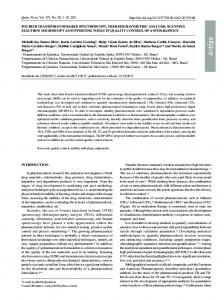
(29) The iterative 2-D Wiener filter is effective in reducing the residual noise further and three iterations are found to be sufficient as the effect of further iterations do not produce significant improvements. However the residual noise sounds nonuniform and there is a higher presence of noise during speech activity period and much lower noise during the silence period. The residual noise energy seems to be correlated to the speech energy due to the property of the 2-D Wiener filter. Since the structure of the noise is different for 1-D and 2-D filters, it is desirable to combine the two filters to produce a more effective filter. IV. HYBRID 1-D AND 2-D WIENER FILTER The 1-D and 2-D Wiener filters can be effectively combined to form a new filter which results in a better noise reduction performance. For the ease of implementing the hybrid filter, the blocking process is modified so that both 1-D and 2-D filtering can be used. The blocks will no longer overlapped each other. The blocking process is given mathematically as follows: (30) Hence, the windowing function (illustrated in Fig. 3) is now modified to one dimension only as expressed in the following equation: (31)
Fig. 4. Hybrid 1-D and 2-D wiener filtering.
The overall block diagram of the hybrid filter is shown in Fig. 4. It is clear upon examination of the block diagram why the blocking and windowing operations have to be modified to perform the 1-D Wiener filter efficiently. This modification does sacrifice some performance of the 2-D Wiener filter, but it is more than compensated by the 1-D Wiener filter. After the 2-D Fourier transform, the transform coefficients are passed to the 2-D Wiener filter block and a 1-D inverse Fourier transform block. The 1-D inverse transform is performed along the row direction and its output can be passed through the 1-D Wiener filtering without further processing. In this arrangement, the 1-D Wiener filter will process the frames which will come in exactly the same manner as in the case of 1-D Fourier transform.
SOON AND KOH: SPEECH ENHANCEMENT USING 2-D FOURIER TRANSFORM
721
A. One-Dimensional Wiener Filter The 1-D Wiener filter is commonly used and is given by the following equation. The column index, , is ignored for the moment for simplicity’s sake (32) where (33) (34) (35) will be assumed to be known in this paper. It The value of should be noted that the traditional noise model is adopted in the 1-D case. Therefore, the noise is not modeled as an ac component riding on top of the dc component as in the 2-D noise model. This is because it may be difficult to form a reasonable is estimate of the ac variance from only three data points. estimated using the approach known as Decision Directed Estimation developed by Ephraim and Malah [8]. The superiority of this estimator is covered in some detail in [19]. of is given by the following equation: The estimate
(36) is the maximum function used to ensure that a where is nonnegative value is obtained as an estimate. in the previous frame, which the estimated value of corresponds to the previous column if they are in the same block. For the first column of each block, the value can be taken from the last column of the previous block. The value of is set to 0.98 for three-quarter overlapping frames used in this paper. Smaller values of (e.g., 0.8) are found to result in a higher level of musical tone in the residual noise. On the other hand, if is set to 1, severe distortions in the speech signals were heard. This observation agrees with that in [8]. The effect of varying is discussed in detail in [20], which states that the value of has to be greater than 0.9 in order to counter the musical noise effect and 0.98 is considered a reasonable value for . The same value of is used in [19]. B. Hybrid Filtering The 1-D Wiener filtered speech and the 2-D Wiener filtered speech can be effectively combined to result in a lower residual noise level. However before that can be done, the two signals must be in an equivalent transform domain. To accomplish this, the 2-D Wiener filtered speech must be inverse Fourier transformed in the row direction. The residual noise characteristics from the two filters are different. Hence it can be reduced effectively by taking the minimum of the two magnitudes as the resultant magnitude. The process can be described as (37) is the output of the 1-D inverse Fourier transwhere form of the 2-D Wiener filtered speech. This combination actu-
Fig. 5.
Weight coefficients for harmonmic enhancing.
ally results in a much quieter enhanced speech than either the 1-D Wiener filtered speech or 2-D Wiener filtered speech. C. Harmonic Enhancer A more complex combination technique that tries not to over attenuate the voiced peaks is also possible. In this technique, a weighted combination of the maximum and minimum of the two magnitudes are taken
(38) , is set to be 1 at the location of the harmonics The weight, of the fundamental pitch frequency, and 0.5 at their neighboring frequencies. At other frequencies it is set to zero. The weighting coefficients are shaped very much like a comb filter and is depicted in Fig. 5. The fundamental pitch frequency, , and hence its multiples, can be obtained from the frequency domain using the harmonic product spectrum [21]. This algorithm is chosen over others for two reasons; it operates in the frequency domain and it is robust under noisy conditions [21]. The Wiener filtered spectra in the frequency domain is first interpolated to artificially increase the frequency resolution by a factor of ten. This is because a 256 point Fourier transform results in a frequency step size which is too coarse for accurate fundamental frequency detection. The log harmonic product spectrum can then be computed as follows: (39) where represents the indices of the interpolated spectra. One is added to the spectral magnitude before the logarithmic operation so that it is stable for zero or near zero values of the frequency spectra. However, this would also depend on the scaling of the speech data, a much smaller value may be necessary if the speech amplitudes are representing by very small numbers. The between 120 Hz and 940 Hz is compared with peak value of a threshold. If it exceeds the threshold, the frame is considered to be a voiced frame and the pitch frequency, , is given by its location. The comb weighting can then be constructed from the and its multiples. knowledge of An alternative method of pitch frequency extraction that is also suitable for noisy speech signals is proposed in [22]. The harmonics are band limited to 3 kHz and below as most of the energy for voiced speech is concentrated below this frequency. Extension of this technique to higher frequencies tends to result in audible distortions. This technique results in less attenu-
722
IEEE TRANSACTIONS ON SPEECH AND AUDIO PROCESSING, VOL. 11, NO. 6, NOVEMBER 2003
Fig. 8.
Clean speech (Jane may earn more money by working hard).
Fig. 6. Objective evaluation under white noise using SegSNR.
Fig. 9. Noisy speech (white noise).
Fig. 7.
The decision as to whether or not region B contains an isolated spectral peak is determined as follows:
Objective evaluation under car noise using SegSNR.
ation for the voiced spectral peaks and thus leads to an approximate 0.5 dB improvement in Signal to Noise Ratio (SNR) measurements. However, informal listening tests do not indicate any noticeable performance improvement which therefore does not justify the additional computation load. D. Residual Noise Reduction Although the residual noise obtained from the algorithm in the previous section is very low, it can be musical in nature. Hence a 2-D residual noise technique used in [23] can be efficiently applied. This technique, which is called time frequency filtering, detects and removes isolated peaks in the time frequency domain which corresponds to arranging all the Fourier transform frames together. Isolated peaks are the main causes of musical noise. The energies contained in local windows, A and B, are computed using the following: (40)
(41)
(42) where is a factor that can be adjusted to control the amount of residual noise removed at the expense of some speech distortion. Safe value of range from 5 to 10. For values of above 10, there is no significant effect on the residual noise reduction. In this paper the value of used is fixed at 6. If region B contains an isolated peak, its contents will be replaced by the mean of the magnitudes of region A. This is described by the following equation: (43) is an element of region B which contains an where isolated noise peak. This is a more natural scheme than that proposed in [23] which zeroes the magnitudes inside region B. Having a low residual noise floor will result in less musical tones in the residual noise.
SOON AND KOH: SPEECH ENHANCEMENT USING 2-D FOURIER TRANSFORM
Fig. 10.
MMSE filtered speech.
Fig. 11.
MBSS filtered speech.
After the time frequency filtering, the frames are inverse Fourier transformed and the enhanced speech is constructed by inverse windowing followed by the overlap-and-add operation. V. RESULTS AND DISCUSSIONS Ten different speech utterances comprising five male and five female speakers from the TIMIT database are used in our simulation study. The speech data are resampled to 8 kHz and linearly quantized at 16 bits. They are then corrupted to different global SNRs by the addition of Gaussian distributed white noise and car interior noise taken from the NOISEX database. The objective test used is the improvement in average Segmental Signal to Noise Ratio (SegSNR). SegSNR is used as an evaluation tool because it correlates better with Mean Opinion Score (MOS) than the total SNR and it is relatively simple to compute. The correlation factor is better than 0.8 according to [24]. The proposed hybrid 1-D and 2-D Wiener filters (HW2D) are compared with three other speech enhancement algorithms; the first of which is the Minimum Mean Square Error Filter (MMSE) by Ephraim and Malah [8], the second algorithm is the audio masking threshold based spectral subtraction (MBSS) by Virag [5] and the third algorithm is based on the truncated Quotient Singular Value Decomposition (QSVD) by Jensen et al. [25]. The results for the objective evaluation under white noise and car interior noise are shown in Figs. 6 and 7 respectively. The performance of HW2D is significantly better than that of
723
Fig. 12.
QSVD filtered speech.
Fig. 13.
HW2D filtered speech.
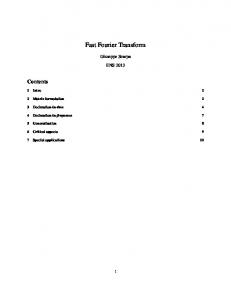
MMSE and MBSS for both noise types. MBSS is better than MMSE at higher SNRs but worse off at lower SNRs as it is difficult to obtain a good estimation of the audio masking threshold under very noisy conditions. However the QSVD is better than the HW2D in the SegSNR test for white noise but for car noise it is only superior when the input SNR is very low. One reason for the relatively good SegSNR results for the QSVD algorithm is that the energy of the enhanced speech is close to that of the original speech. For the Wiener filters used in HW2D, the energy of the enhanced speech is lower than the energy of the original speech and the difference is more significant for noisier speeches. However despite the objective test results, HW2D sounds much quieter than MMSE, MBSS and QSVD and is preferred by all listeners. The QSVD enhanced speeches sound distorted and has a ringing residual noise and is not liked by the listeners despite a higher SegSNR score. Time plots of one of the noisy speech utterances and its filtered outputs are shown in Figs. 8–13. From the time plots, it can be clearly seen that the HW2D and QSVD have lower residual noise than MMSE and MBSS. To further compare the characteristics of the HW2D versus the QSVD, the spectrogram plot of a segment of the same white noise corrupted speech processed by the two algorithms is shown in Fig. 14. In the plot, it can be seen that the QSVD has higher residual noise within the voiced segment which contributes to its poorer acceptance by listeners.
724
IEEE TRANSACTIONS ON SPEECH AND AUDIO PROCESSING, VOL. 11, NO. 6, NOVEMBER 2003
Fig. 14. Spectrogram of clean, QSVD and HW2D processed speech segments.
VI. CONCLUSION This paper describes a new technique of speech enhancement which utilizes the 2-D Fourier transform. Various noise reduction techniques applicable in the 2-D transform domain have been described. The most effective method is to use a hybrid of 2-D Wiener filter in the 2-D transform domain and the 1-D Wiener filter in the 1-D Fourier transform domain. The enhanced speech resulting from the filter is perceptually very much freer of white noise distortion. The very slight tonal residual noise which still exists can be reduced using time frequency filtering. ACKNOWLEDGMENT The authors would like to thank the reviewers for their valuable comments which have helped to improve the quality of this paper. The authors are also very grateful to Dr. C. Guo for contributing the program which implements the QSVD algorithm. REFERENCES [1] M. R. Sambur and N. S. Jayant, “LPC analysis/synthesis from speech inputs containing white noise or additive white noise,” IEEE Trans. Acoust., Speech, Signal Processing, vol. ASSP-24, pp. 484–494, 1976. [2] B. H. Juang, “Recent developments in speech recognition under adverse conditions,” in Proc. Int. Conf. Spoken Language Process, Kobe, Japan, Nov. 1990, pp. 1113–1116. [3] I. Y. Soon, S. N. Koh, and C. K. Yeo, “Improved noise suppression filter using self adaptive estimator of probability of speech absence,” Signal Process., vol. 75, pp. 151–159, 1999. [4] Z. X. Yuan, S. N. Koh, and I. Y. Soon, “Speech enhancement based on a hybrid algorithm,” Electron. Lett., vol. 35, pp. 1710–1712, 1999. [5] N. Virag, “Single channel speech enhancement based on masking properties of the human auditory system,” IEEE Trans. Speech Audio Processing, vol. 7, pp. 126–137, 1999. [6] S. F. Boll, “Suppression of acoustic noise in speech using spectral subtraction,” IEEE Trans. Acoust., Speech, Signal Processing, vol. ASSP-27, pp. 113–120, 1979. [7] R. J. McAulay and N. L. Malpass, “Speech enhancement using a softdecision noise suppression filter,” IEEE Trans. Acoust., Speech, Signal Processing, vol. ASSP-28, pp. 137–145, 1980. [8] Y. Ephraim and D. Malah, “Speech enhancement using a minimum mean-square error short-time spectral amplitude estimator,” IEEE Trans. Acoust., Speech, Signal Processing, vol. ASSP-32, pp. 1109–1121, 1984.
[9] I. Y. Soon, S. N. Koh, and C. K. Yeo, “Noisy speech enhancement using discrete cosine transform,” Speech Commun., vol. 24, pp. 249–257, 1998. [10] I. Y. Soon and S. N. Koh, “Low distortion speech enhancement,” Proc. Inst. Elect. Eng., vol. 147, pp. 247–253, 2000. [11] 5. Gazor and A. Rezayee, “An adaptive subspace approach for speech enhancement,” in Proc. ICASSP, vol. 3, 2000, pp. 1839–1842. [12] Y. Ephraim and D. Malah, “A signal subspace approach for speech enhancement,” IEEE Trans. Speech Audio Processing, vol. 3, pp. 251–266, 1995. [13] U. Mittal and N. Phamdo, “Signal/noise KLT based approach for enhancing speech degraded by colored noise,” IEEE Trans. Speech Audio Processing, vol. 8, pp. 159–167, 2000. [14] I. Y. Soon, S. N. Koh, and C. K. Yeo, “Wavelet for speech denoising,” in TENCON Proc., vol. 2, 1997, pp. 479–482. [15] J. W. Seok and K. S. Bae, “Speech enhancement with reduction of noise components in the wavelet domain,” in Proc. ICASSP, vol. 2, 1997, pp. 1323–1326. [16] I. Y. Soon, K. J. Tan, and C. K. Yeo, “Speech enhancement using wavelet packet analysis,” IEEE Asia Pacific Conf. Communications/Singapore International Conf. Commun. Syst., vol. 1, pp. 117–121, 1998. [17] Y. N. Cheng and D. O’Shaughnessy, “Speech enhancement based conceptually on auditory evidence,” IEEE Trans. Signal Processing, vol. 39, pp. 1943–1954, 1991. [18] J. Jensen and H. L. Hansen, “Speech enhancement using a constrained iterative sinusoidal model,” IEEE Trans. Speech Audio Processing, vol. 9, pp. 731–740, 2001. [19] P. Scalart and J. V. Filho, “Speech enhancement based on a priori signal to noise estimation,” in Proc. ICASSP, vol. 2, 1996, pp. 629–632. [20] 0. Cappe, “Elimination of the musical noise phenomenon with the Ephraim and Malah noise suppressor,” IEEE Trans. Speech Audio Processing, vol. 2, pp. 345–349, 1994. [21] A. N. Noll, “Pitch determination of human speech by the harmonic product spectrum, the harmonic sum spectrum, and a maximum likelihood estimate,” in Proc. Symp. Computer Proc. in Comm., Apr. 1969, pp. 779–798. [22] T. Shimamura and H. Kobayashi, “Weighted autocorrelation for pitch extraction of noisy speech,” IEEE Trans. Speech Audio Processing, vol. 9, pp. 727–730, 2001. [23] C. Whipple, “Low residual noise speech enhancement utilizing timefrequency filtering,” in Proc. ICASSP, vol. 1, 1994, pp. I/5–I/8. [24] S. Wang, A. Sekey, and A. Gersho, “An objective Measure for predicting subjective quality of speech coders,” IEEE J. Select. Areas Commun., vol. 10, pp. 819–829, 1992. [25] S. D. H. S. Jensen, P. C. Hansen, and J. A. Sorensen, “Reduction of broad-band noise in speech by truncated QSVD,” IEEE Trans. Speech Audio Processing, vol. 3, pp. 439–448, 1995.
Ing Yann Soon (M’86) was born in Singapore in 1962. He received the B.Eng. and M.Sc. degrees in 1987 and 1991, respectively, both in electrical engineering, from the National University of Singapore. He was with Chartered Industries of Singapore as a Senior Engineer before joining the Nanyang Technological University in 1991. He is currently an Associate Professor lecturing in the School of Electrical and Electronic Engineering. His current research interests include speech processing, image/video processing, and other digital signal processor based applications. Soo Ngee Koh received the B.Eng. degree from the University of Singapore and the B.Sc. degree from the University of London in 1979. He received both the M.Sc. and Ph.D. degrees from the Loughborough University of Technology, U.K., in 1981 and 1984, respectively. He worked as a Consultant in wideband speech and audio coding at the British Telecom Research Laboratories, U.K. He joined Nanyang Technological University (NTU), Singapore, in 1985. He is currently a Professor and Head of the Communication Engineering Division in the School of Electrical and Electronic Engineering of NTU. He has over 100 publications in international journals and international conference proceedings. He holds two international patents on speech coder design. Dr. Koh was a co-recipient of the IREE (Australia) Norman Hayes best paper award in 1990. His research interests include speech processing, coding, enhancement and synthesis, joint source-channel coding, audio and video coding, and communication signal processing.