Respiratory Physiology & Neurobiology 247 (2018) 133–139
Contents lists available at ScienceDirect
Respiratory Physiology & Neurobiology journal homepage: www.elsevier.com/locate/resphysiol
Spirometry reference values for an andean high-altitude population a,⁎
b,3
c,2
MARK
c,4
Orlando R. López Jové , Santiago C. Arce , Rene W. Chávez , Alejandro Alaniz , Diana Lancellottia, María Nélida Chiapellad,5, Alicia Juliánc,6, Eduardo L. De Vitob,7, Hernando L. Salad,8, GEFRA group1 a
Hospital Cetrángolo, Vicente López, Argentina Instituto de Investigaciones Médicas Alfredo Lanari, Buenos Aires, Argentina c Hospital San Roque, San Salvador de Jujuy, Argentina d Hospital Posadas, Argentina b
A R T I C L E I N F O
A B S T R A C T
Keywords: Lung function tests Spirometry Normal values Reference ranges Respiratory physiology High altitude
We compared the spirometric values of people living at High Altitude at the Andean Plateau with those predicted for lowland population. Rationale: Spirometry reference values are not yet available for the millions of people living at high altitude in the Andean High Plateau. Objective: To obtain spirometric prediction equations from a healthy subset of adults living in Argentina at 3440 m above sea level. Methods: We randomly recruited 172 healthy men and 235 healthy women, ages 20–70. Spirometry was done according to ATS/ERS standards. Reference equations were computed using regression analysis. Results: The resulting prediction equations: For men: FVC = 0.0407*height (cm)–0.0250*age(years)–0.81;SEE 0.518. FEV1 = 0.0327*height (cm)-0.0282*age(years)-0.25;SEE 0.414. For women: FVC(liters) = 0.0464*height(cm)–0.0222*age(years)–2.62;SEE 0.396. FEV1(liters) = 0.0343*height(cm)–0.0218*age(years)–1.40;SEE 0.316. Conclusions: These results establish spirometric-prediction equations for the population studied and further demonstrate: (1) a linear decline of FVC and FEV1 with age for both genders, (2) age and height satisfactorily predict both parameters, (3) supra-normal values for this population were found when compared to those predicted by lowland Caucasian equations.
1. Introduction Previous studies of healthy population-based samples of people living at high altitudes have shown spirometric values significantly higher than individuals living at sea level (Brutsaert et al., 1999; Havryk et al., 2002; Weitz et al., 2002; Weitz et al., 2016; Kiyamu et al.,
2015). The majority of that research, however, was not designed with the aim of producing spirometric-prediction equations (Kiyamu et al., 2012; Frisancho et al., 1997; Weitz et al., 2016; Kiyamu et al., 2015), while other studies had limitations that made the results unreliable for routine clinical use (Rojas and Dennis, 2010; Santolaya et al., 1984). As a consequence, spirometric studies performed on those subjects are
⁎
Corresponding author. Chief of Pulmonary Laboratory. Hospital Cetrángolo. Vicente López. Argentina. E-mail addresses:
[email protected],
[email protected] (O.R. López Jové), arcesantiago@fibertel.com.ar (S.C. Arce),
[email protected] (R.W. Chávez),
[email protected] (A. Alaniz),
[email protected] (D. Lancellotti),
[email protected] (M.N. Chiapella),
[email protected] (A. Julián),
[email protected] (E.L. De Vito),
[email protected] (H.L. Sala). 1 Section Of Respiratory Pathophysiology And Pulmonary Laboratory, Argentine Association Of Respiratory Medicine (AAMR), Argentina. 2 Jefe de Servicio de Neumonología - Hospital San Roque - Gral. San Martín 330, 4600 San Salvador de Jujuy, Jujuy. 3 Instituto de Investigaciones Médicas “Dr. Alfredo Lanari”, Universidad de Buenos Aires. Coordinator of Pulmonary Laboratory. 4 Hospital San Roque, San Salvador de Jujuy. médico neumonólogo y médico de guardia de Terapia Intensiva. 5 Hospital A Posadas - El Palomar. 6 Hospital San Roque, San Salvador de Jujuy - Lic. en Enfermería- Jefa de Consultorios Externos. 7 Instituto de Investigaciones Médicas “Dr. Alfredo Lanari”, Universidad de Buenos Aires. 8 Head of Teaching and Research Department - Hospital A Posadas - El Palomar. http://dx.doi.org/10.1016/j.resp.2017.09.016 Received 15 April 2017; Received in revised form 13 September 2017; Accepted 26 September 2017 Available online 07 October 2017 1569-9048/ © 2017 The Authors. Published by Elsevier B.V. This is an open access article under the CC BY-NC-ND license (http://creativecommons.org/licenses/BY-NC-ND/4.0/).
Respiratory Physiology & Neurobiology 247 (2018) 133–139
O.R. López Jové et al.
wheezing; congestive heart failure; present or past tuberculosis; cardiac or thoracic surgery; abdominal surgery within the previous 6 months; acute myocardial infarction within the previous 3 months; retinal detachment or ocular surgery within the previous 3 months; evident thoracic deformity; exposure to inhalation of organic and/or inorganic substances (mining, textiles, chemicals, biomass combustion); chronic sinusitis or allergic rhinitis; previous radiotherapy or any other history of respiratory illness.
interpreted and reported using reference equations generated at low altitude (Quanjer et al., 1993; Hankinson et al., 1999; Roca et al., 1998; Hsu et al., 1979; Crapo et al., 1981,1990; Quanjer et al., 2012; Galíndez et al., 1998; Pérez Padilla et al., 2006). The American Thoracic Society (ATS) and European Respiratory Society (ERS) recommend studying a healthy sample of the local community in an attempt to validate published pulmonary function reference equations (Miller et al., 2005a,b; Pellegrino et al., 2005). However, no studies have been published which apply to people living at very high altitudes in the Andes, yet more than 11 million people live within that region at locations higher than 3000 m above sea level. The objective of the present research was, therefore, to obtain reliable spirometric-prediction equations for an Andean high-altitude population. Some of the results of these studies have been previously reported in the form of an abstract at the ATS 2013 International Conference, Philadelphia 17/22 May 2013 (abstract #A4853)
2.1.4. Measurement Anthropometry: standing height was measured in stocking feet using a stadiometer to the nearest 0,5 cm. Trunk length was measured with the same technique while the participant was sitting on a chair, and chair height was substracted from the obtained value. Arm span was measured with the participant standing with his back against a wall. 2.1.5. Spirometry the spirometer used was a MedGraphics CPFS/D USB with a Pitottype flow sensor (Medical Graphics Corporation, Minnesota, USA). Ambient temperature and barometric pressure were measured with a weather station (Perception II, Davis Instruments, USA). Calibration checks were performed with a 3-l syringe using three different flows within the physiologic range at the beginning of every operational day or whenever significant modifications in the ambient conditions occurred (Miller et al., 2005a,b). Flow sensors were zeroed before measurements were made in each subject.
2. Methods 2.1. Study design: cross-sectional prospective study 2.1.1. Study population We selected people from the Andean High Plateau, Argentina, living in the small city of La Quiaca.That city is a typical highland town, void of tall apartment buildings containing low houses at an altitude of 3442 m (11,293 ft) above sea level. It has a population of 16,874 inhabitants (female: 8941; male: 7933) (INDEC, 2010). Our sample represents 2.4% of the population of that city (INDEC, 2010).
2.1.6. Quality control Forced spirometric maneuvers were conducted by pulmonologists experienced in pulmonary function testing. American Thoracic Society (ATS) and European Respiratory Society (ERS) recommendations were followed for test session quality (Miller et al., 2005a,b). All spirometries were subsequently evaluated by two independent experienced physicians (HSR and SCA) following ATS/ERS criteria. Upon the occurrence of discrepancies in the conclusions reached by the first two investigators, a third evaluator (ELDV) participated.
2.1.2. Study protocol Volunteers were selected through a random-route sampling method. (Hoffmeyer-Zlotnik et al., 2003). One group of one coordinator and eight health workers formed four teams of two health workers each, who carried out household surveys. Each team started from one of four primary care centers provided with instructions on the random walking rules (direction to start, on which side of the streets to walk and which crossroads to take). The walking rule prescribed to list the address of every third private household on a specially prepared form. Units not belonging to the population of private households, for example shops, offices, institutions like hospitals, were ignored. That list of addresses defined the total of units (households) eligible for the survey sample. The resulting number of addresses constituted the gross sample of households to be contacted. Routes ended when the predefined number of respondents was achieved. At the selected residences all the individuals older than 19 years were invited to participate in the study. Participants were interviewed by a health worker pertaining to that area, were informed about the characteristics and aim of the survey, and were given a scheduled appointment by the health worker with the pulmonary function study group at the primary care center nearest to the volunteeŕs home. We performed a functional evaluation on 698 individuals. The field studies were performed during a 22-month period starting in August 2010. Three one-week long visits were conducted in five different primary care centers distributed across the city. At each center, volunteers were interviewed and studied by a team composed of two trained pulmonary specialists and two trained nurses. After obtaining written informed consent the study participant completed a standardized questionnaire.
2.1.7. Ethics The protocol was approved by the Bioethics and Teaching Committee of the San Roque Hospital of San Salvador de Jujuy. The informed consent was designed according to the Helsinki Declaration and the International Conference on Harmonization on Good Clinical Practice. Each volunteer received a print-out report with the numeric results and graphs of his/her own spirometry test. 2.1.8. Statistical analysis was performed using Sigma Plot Version 11. Distributional normality was tested using the Shapiro-Wilk test. Independent variables considered for inclusion in the models were age, standing height, sitting height and weight. Studentś t-test, Mann-Whitney and Spearman correlation were performed. Reference equations and equations to calculate the lower limit of normal (LLN) criteria were developed using linear correlation and forward-stepwise multiple regression. Comparisons between pairs of equations (Quanjer et al., 1993; Hankinson et al., 1999; Pérez Padilla et al., 2006; Havryk et al., 2002) were performed with t-test/ANOVA. A comparison was made with ECCS (Quanjer et al., 1993), NHANES III (Hankinson et al., 1999) and PLATINO (Pérez Padilla et al., 2006) values and with Havryk (Havryk et al., 2002), as an example of another Highland population (Himalayans).
2.1.3. Exclusion criteria subjects with any of the following: denial to sign the informed consent; BMI > 35 kg/m2; pneumonia or other acute respiratory illness within the previous three months; women known to be pregnant; use of amiodarone, beta blockers or bronchodilators; history of haemoptysis; current smokers or former daily smokers (World Health Organization, 2011), clinical evidence of chronic bronchitis, asthma or history of
3. Results We tested 698 individuals who completed our questionnaire, anthropometry and spirometry. Once we applied the quality control 134
Respiratory Physiology & Neurobiology 247 (2018) 133–139
O.R. López Jové et al.
Table 1 Age distribution of adult Andeans included in analysis, by decade and sex.
Table 3 Prediction equations for FVC and FEV1, FEV1/ FVC using age and height, for men and women.
Clusters (years)
Males
Females
20 to 30 31 to 40 41 to 50 51 to 60 61 to 70 TOTAL
38 61 32 27 14 172
67 73 55 32 8 235
k
Age (a)
Height (b)
Adj R2
SEE
Men FVC FEV1 FEV1/FVC FVC LLN FEV1 LLN FEV1/FVC LLN
-0.81 -0.25 88.26 -1.66 -0.93 80,65
-0.0250 -0.0282 -0.166 -0.0250 -0.0282 -0,1670
0.0407 0.0327
0.424 0.538
0.518 0.414 4.615
Women FVC FEV1 FEV1/FVC FVC LLN FEV1 LLN FEV1/FVC LLN
-2.62 -1.40 86.351 -3.27 -1.92 79,1787
-0.0222 -0.0218 -0.0780 -0.0222 -0.0218 -0,0787
0.0464 0.0343
0.508 0.551
0.396 0.316 4.373
0.0407 0.0327
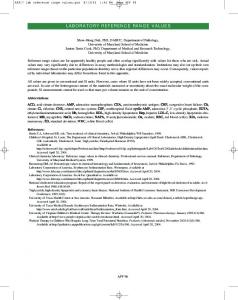
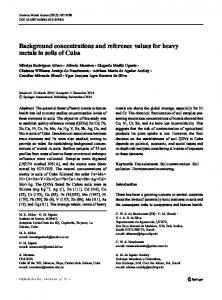
criteria (ATS/ERS) in the spirometries, the final sample consisted of 172 men and 235 women. This is an homocedastic sample of people aged 20–70 years old. Table 1 shows sample distribution clusters for this population. Anthropometric and spirometric characteristics of the studied population are summarized in Table 2. Forced vital capacity (FVC) and forced expiratory volume in one second (FEV1) in liters for both sexes were predicted by age, height, and weight. The latter, however, contributed less to the prediction of the FVC and the FEV1 than did age or height, while the FEV1/FVC ratio was satisfactorily predicted by age alone (Table 2). Proposed coefficients for the calculation of FVC and FEV1 using age and height are shown in Table 3. When NHANES III or ECCS (Quanjer et al., 1993; Hankinson et al., 1999) prediction equations were used in our population, observed values of FVC and FEV1 expressed as percent of predicted value, were between 12 and 27% higher than mean predicted values (p < 0.001 for all pairwise comparisons with both variables and both equations in both genders) (Fig. 1 and 2). PLATINO (Pérez Padilla et al., 2006) prediction equations did not differ from NHANES III and ECCS. We also found higher values of FVC and FEV1 than the ones predicted for the Himalayan population (Havryk et al., 2002) (p < 0.001 for all comparisons) (Fig. 3). It is important to note that, if we had used the NHANES III equations as reference values for our population, the values of FVC predicted for men and women would have been 12% and 13% respectively lower. Similarly, if we had used ECCS equations the FVC values for men and women would have been 21% and 27% respectively lower.
Lahiri et al., 2002). Early evidence (Hurtado,1932) suggested that predictive equations for spirometry formulated in lowland populations (Quanjer et al., 1993; Hankinson et al., 1999; Roca et al., 1998; Hsu et al., 1979; Crapo et al., 1981,1990; Quanjer et al., 2012; Galíndez et al., 1998; Pérez Padilla et al., 2006) were not applicable to an Andean highland population (Brutsaert et al., 1999; Havryk et al., 2002; Rojas and Dennis, 2010; Santolaya et al., 1984; Kiyamu et al., 2012; Frisancho et al., 1997; Weitz et al., 2002; Valenzuela Bejarano and Ramos Martínez, 2004; Fiori et al., 2000; Greksa et al., 2005; Rico Méndez et al., 2001; Weitz et al., 2016). Our results confirm those previous observations. Previous studies were not designed to obtain prediction equations and were limited to describe spirometric characteristics and their differences with European populations.
4. Discussion
4.2. Significance
0.0464 0.0343
FVC, FEV1, FVC LLN, and FEV1 LLN are predicted as follows: X = k + a * age + b * height.. FEV1/FVC and FEV1/FVC LLN can be predicted by an equation as follows: x = k + a * age. LLN = Lower Limit of normality. FVC = forced vital capacity. FEV1 = forced expiratory volume in one second. Age (years) Height (cm).
4.1. Main findings
Our results can be applied to an important and underestimated population due to the lack of studies in these subjects. According to the World Health Organization, 140 million people live at 2500 m above sea level or higher (World Health Organization Geneva, 2005) and more than 11 million people live at altitudes higher than 3000 m above sea level. Excepting for the Himalayan inhabitants, no prior studies have made prediction equations for these populations.
In accordance with the previous data, we showed that Andean highlanders have higher predicted spirometric values than people living at sea level. We were able to generate prediction equations for this population. High altitude induces changes in exposed individuals (West, 2017; Balasubramaniam et al., 2003; Rabinovitch et al., 1979; Hurtado, 1932;
Table 2 Anthropometric and spirometric characteristics of the studied population. Data is expressed as mean ± Standard Deviation, median, interquartile range, and range, divided by sex. Men (n = 172)
Age range (years) Height (cm) Trunkheight (cm) Trunkheight/Height Armspan (cm) Weight (kg) BMI (kg/m2) FVC (liters) FEV1 (liters) FEV1/FVC
Women (n = 235)
Mean ± SD
Median
IQR
Range
Mean ± SD
Median
IQR
Range
40.5 ± 12.5 163.6 ± 5.8 85.9 ± 3.5 0.526 ± 0.018 167.3 ± 6.3 70.9 ± 10.4 26.5 ± 3.4 4.84 ± 0.68 3.95 ± 0.61 0.815 ± 0.5
39 163 86 0.528 167 69.9 26.3 4.91 3.93 0.82
31–50 160–166 83.7–89 0.515−0.538 163–170.5 63.4–78.3 24.2–28.7 4.31−5.24 3.47−4.29 0.78−0.852
20–70 150.5–184 74–96.2 0.451−0.583 153–186 50.5–98 19.8–34.7 3.29−6.82 2.61−6.1 0.64−0.91
38.3 ± 11.1 151.3 ± 5.3 80.5 ± 3.4 0.533 ± 0.016 153.1 ± 6.9 61.1 ± 8.9 26.7 ± 3.8 3.55 ± 0.56 2.96 ± 0.47 0.834 ± 0.45
37 151 80.5 0.531 153 60.5 26.5 3.51 2.93 0.84
30−4.,5 148–155 78.3–83 0.521−0.542 149–157.5 54.4–67.8 24–29.8 3.16−3.92 2.61−3.3 0.81−0.86
20–65 136–165 70–89.5 0.49−0.583 137–180 39.4–87 19–35 1.99−5.38 1.57−4.1 0.69−0.93
135
Respiratory Physiology & Neurobiology 247 (2018) 133–139
O.R. López Jové et al.
Fig. 1. Shows mean FEV1, FVC, and FEV1/FVC, versus age for male and female subjects, and correspondent confidence interval (CI) 95%.
4.3. Methodological issues
not explain the difference in spirometric values obtained.
The sample was the result of a random-route sampling methodology (Hoffmeyer-Zlotnik et al., 2003). As stated, it represents 2.4% of the city inhabitants, whereas the ratio men/women followed the same pattern of the studied city. For these reasons we can assure that the prediction equations found represent the total population.
4.5. Comparison with other prediction equations we compared our prediction equations with others obtained at sealevel currently in use in Latin American countries. We also compared our prediction equations with the one obtained from Himalayans, given that this is the most similar circumstance when considering altitude. In both cases the difference was significant.
4.4. Sitting-standing height ratio
4.6. Limitations
Quanjer et al. (Quanjer et al., 2012) when analyzing the data sets collected in their GLI 2012 study, observed that the children and adolescents of Mexico City, at an altitude of 2,240 m, had FVC and FEV1 values higher than the rest of the data sets in their study. This difference was attributed to the fact that they have shorter legs to stature compared with other ethnic groups in that moderate-altitude population (Quanjer et al., 2015). We calculated the sitting height to standing height ratio in our subjects, which was similar to the published ratio in other studies at sea level (Ryan et al., 1999; Chumlea et al., 1998; World Health Organization Geneva, 1995). Therefore, this ratio could
the main limitation is the sample size. Nevertheless, due to the robust methodology applied, a homoscedastic sample of Andeans of both sexes aged 20–70 years old (Fig. 1) was achieved. Furthermore, a significant number of prediction equations was obtained with smaller samples (Crapo et al., 1981), including the equation obtained from the Himalayan population (Havryk et al., 2002). The second limitation refers to the fact that not all subjects were born in La Quiaca. In our study we recorded the place-of-birth altitude 136
Respiratory Physiology & Neurobiology 247 (2018) 133–139
O.R. López Jové et al.
Fig. 2. Shows lineal regression for FVC and FEV1 values found in the studied population and those calculated by two widely used prediction equations from healthy North American (NHANES III) and European Caucasians (ECCS) living near sea level.
development. Effects of HIFs include their influence on airway epithelial cells contributing to lung enlargement (West, 2017; Llapur et al., 2013; Shimoda et al., 2011). Also recent researches comparing different ethnic populations born at high altitudes (Brutsaert et al., 1999) with similar ethnic groups born at differing altitudes favor the first hypothesis (Weitz et al., 2002). The only study we know which established reference values for spirometry in high altitude born populations was performed in the Himalayas (Havryk et al., 2002). The analysis of these results are closer to our study than other equations, but a significant difference still remains.
of each individual, the resultant median altitude was 3,455 m, which matches the altitude of the studied city. 4.7. Other issues our selection criteria excluded smokers, but some of the participants were occasional smokers, not enough to cause chronic airflow limitation (World Health Organization, 2011), since the local habit is to smoke once a year during religious celebrations and during funerals. For statistical analyses, we only included results that fulfilled the criteria of acceptability and repeatability specified by ATS/ERS (Miller et al., 2005a,b), as stated by at least two out of three researchers, and employed forward stepwise multiple regression, as had been used previously in other field studies (Quanjer et al., 1993; Roca et al., 1998). The number of men included and analyzed (42%) was somewhat lower than the number of women, but this difference is comparable to the sex distribution within the same age groups in the city (46% male) (INDEC, 2010). Spirometric values found in our population were significantly higher than those predicted by NHANES III (Hankinson et al., 1999), ECCS (Quanjer et al., 1993) (Fig. 1), and PLATINO (Pérez Padilla et al., 2006) equations. For these differences there are two main hypotheses: (a) hypoxia occurring during the first years of postnatal development (Weitz et al., 2002) and (b) differing ethnic origins (Kiyamu et al., 2012). The rationale of the first hypothesis is that chronic hypobaric hypoxia, through Hypoxia-Inducible Factors (HIFs), accelerated lung
4.8. Significance The most significant findings of this research confirm previous observations of higher spirometric values in highland populations (Hurtado, 1932; Brutsaert et al., 1999; Havryk et al. 2002; Weitz et al., 2002; Kiyamu et al., 2012; Frisancho et al., 1997; Rojas and Dennis, 2010; Valenzuela Bejarano and Ramos Martínez, 2004; Fiori et al., 2000; Greksa et al., 2005; Rico Méndez et al., 2001; Kiyamu et al., 2015; Weitz et al. 2016) and in addition enable the formulation of a reference equation for inhabitants of the Andean plateau. The results also demonstrate that the predictive equations generated from data on inhabitants living near sea-level cannot be applied to the natives of this region since those assessments underestimate the presence of spirometric restriction or the severity of airway obstruction. 137
Respiratory Physiology & Neurobiology 247 (2018) 133–139
O.R. López Jové et al.
Fig. 3. Shows the comparison between our sample and values predicted for the same population using Havryḱs predicted values developed for Himalayan population. 1998. Stature prediction equations for elderly non-Hispanic white, non-Hispanic black, and Mexican-American persons developed from NHANES III data. J. Am. Diet. Assoc. 98 (2), 137–142. Crapo, R.O., Morris, A.H., Gardner, R.M., 1981. Reference spirometric values using techniques and equipment that meet ATS recommendations. Am. Rev. Respir. Dis. 123, 659–664. Crapo, R.O., Jensen, R.L., Lockey, J.E., Aldrich, V., Elliott, C.G., 1990. Normal spirometric values in healthy Hispanic Americans. Chest 98, 1435–1439. Fiori, G., Facchini, F., Ismagulov, O., Ismagulova, A., Tarazona-Santos, E., Pettener, D., 2000. Lung volume, chest size, and hematological variation in low-, medium-, and high-Altitude central asian populations. Am. J. Phys. Anthropol. 113, 47–59. Frisancho, A.R., Frisancho, H.G., Albalak, R., Villain, M., Vargas, E., Soria, R., 1997. Developmental, genetic and environmental components of lung volumes at high altitude. Am. J. Hum. Biol. 9, 191–203. Galíndez, F., Sívori, M., García, O., Césaro, J., Suárez, A., Bleker, J., Castañiza, L., Callay, A., López, O., Lupo, A., Savastano, B., Sacerdoti, A., 1998. Normograms of spirometric values for the city of Buenos Aires. Medicina 58, 141–146 (B Aires). Greksa, L.P., Spielvogel, H., Paz-Zamora, M., et al., 2005. Effect of altitude on the lung function of high altitude residents of European ancestry. Am. J. Phys. Anthropol. 75, 77–85. Hankinson, J.L., Odencrantz, J.R., Fedan, K.B., 1999. Spirometric reference values from a sample of the general US population. Am. J. Respir. Crit. Care Med. 159, 179–187. Havryk, A.P., Gilbert, M., Burgess, K.R., 2002. Spirometry values in Himalayan high altitude residents (Sherpas). Respir. Physiol. Neurobiol. 132, 223–232. Hoffmeyer-Zlotnik, J.H.P., 2003. New sampling designs and the quality of data. Dev. Appl. Stat. 19, 205–217. Hsu, K.H.K., Jenkins, D.E., Hsi, B.P., Bourhofer, E., Thompson, V., Tanakawa, N., Hsieh, G.S.J., 1979. Ventilatory function of normal children and young adults: mexicanAmerican, white and black I. Spirometry. J. Pediatr. 95, 14–23. Hurtado, A., 1932. Respiratory adaptation in the Indian natives of the Peruvian Andes: studies at high altitude. Am. J. Phys. Anthropol. 17, 137–165. INDEC, 2010. National Argentine Census. (Available from:). http://www.censo2010. indec.gov.ar/resultadosdefinitivos.asp. Kiyamu, M., Bigham, A., Parra, E., León-Velarde, F., Rivera-Chira, M., Brutsaert, T.D., 2012. Developmental and genetic components explain enhanced pulmonary volumes
Equations derived in the present work could be utilized both in the native and resident population of the Andean Plateau and in emigrants to cities near sea level, regardless of their individual ethnic origin (Brutsaert et al., 1999; Havryk et al. 2002; Weitz et al., 2002). Further studies will be necessary to confirm this recommendation. The use of equations developed at sea level in people born and raised in the altitude may underestimate the prevalence of pulmonary disease. Acknowledgements We would like to thank Dr. Marina Khoury, who collaborated in the design of the study. We also thank the Argentine Association of Respiratory Medicine (AAMR), the authorities and personnel of Intendence of La Quiaca city, “Dr. Jorge Uro” Hospital, and its Primary Care Centers, the authorities and personnel of “San Roque” Hospital, San Salvador de Jujuy, and the authorities and personnel of Gendarmerie Squadron XXI La Quiaca, and Ing Caruso SRL. References Balasubramaniam, V., Tang, J.R., Maxey, A., Plopper, C.G., Abman, S.H., 2003. Mild hypoxia impairs alveolarization in the endothelial nitric oxide synthase-deficient mouse. Am. J. Physiol. Lung Cell. Mol. Physiol. 284, L964–L971. Brutsaert, T.D., Soria, R., Caceres, E., Spielvogel, H., Haas, J.D., 1999. Effect of developmental and ancestral high altitude exposure on chest morphology and pulmonary function in Andean and European/North American natives. Am. J. Hum. Biol. 11, 383–395. Chumlea, W.C., Guo, S.S., Wholihan, K., Cockram, D., Kuczmarski, R.J., Johnson, C.L.,
138
Respiratory Physiology & Neurobiology 247 (2018) 133–139
O.R. López Jové et al.
Physiol. Heart Circ. Physiol. 236, H818–H827. Rico Méndez, F.G., Urias Almada, P., Simón Barquera, C., Ochoa Jiménez, L.G., Padilla Navarro, M.A., Meneses Guzmán, L.C., Espinosa Pérez, J.L., 2001. Spirometric and blood gas values ééin healthy individuals, at different altitudes above sea level, in Mexican elderly population. Multicenter Study. Rev. Inst. Nac. Enf. Resp. Mex. 2, 90–98. Roca, J., Burgos, F., Sunyer, J., Saez, M., Chinn, S., Antó, J.M., et al, 1998. References values for forced spirometry. group of the european community respiratory health survey. Eur. Respir. J. 11, 1354–1362. Rojas, M.X., Dennis, R.J., 2010. Reference values for spirometric parameters in adults living in Bogotá, D. C., Colombia. Biomédica 30, 82–94. Ryan, A.S., Roche, A.F., Kuczmarski, R.J., 1999. Weight, stature, and body mass index data for Mexican Americans from the third national health and nutrition examination survey (NHANES III, 1988–1994). Am. J. Hum. Biol. 11 (5), 673–686. Santolaya, R., Araya, J., Prieto, R., 1984. Vital capacity, height, weight and body surface area in two healthy adult populations residing in northern highlands in Chile: 98 native of wetland Isluga (average altitude 3800 masl) and 351 residents in Chuquicamata copper camp (2800 masl). Estudios Atacameños 7, 285–294. Shimoda, L.A., Semenza, G.L., 2011. HIF and the lung role of hypoxia-inducible factors in pulmonary development and disease. Am. J. Respir. Crit. Care Med. 183, 152–156. Valenzuela Bejarano, M.A., Ramos Martínez, E., 2004. Measurement of forced vital capacity by spirometry in adults natural inhabitants of Junín (4105 masl). Revista de la Sociedad Peruana de Neumologia 48, 149–156. Weitz, C.A., Garruto, R.M., Chin, C.T., Liu, J.C., Liu, R.L., He, X., 2002. Lung function of Han Chinese born and raised near sea level and at high altitude in Western China. Am. J. Hum. Biol. 14, 494–510. Weitz, C.A., Garruto, R.M., Chin, C.T., 2016. Larger FVC and FEV1 among tibetans compared to han born and raised at high altitude. Am. J. Phys. Anthropol. 159, 244–255. West, J.B., 2017. Physiological effects of chronic hypoxia. N. Engl. J. Med. 376, 1965–1971. World Health Organization Geneva, 1995. Technical Report Series No. 854. Physical Status: The Use of Anthropometry. World Health Organization. Geneva, 2005. Human Health Impacts from Climate Variability and Climate Change in the Hindu Kush-Himalaya Region. In http://www. uncclearn.org/sites/default/files/inventory/who20. pdf. World Health Organization, 2011. Global Tobacco Surveillance System. Tobacco Questions for Surveys. A Subset of Key Questions from the Global Adult Tobacco Survey (GATS), 2nd edition. .
of female peruvian quechua. Am. J. Phys. Anthropol. 148, 534–542. Kiyamu, M., Elias, G., Leon-Velarde Rivera-Chira, M., Brutsaert, T., 2015. Aerobic capacity of peruvian quechua: a test of the developmental adaptation hypothesis. Am. J. Phys. Anthropol. 156, 363–373. Lahiri, S., Di Giulio, C., Roy, A., 2002. Lessons from chronic intermittent and sustained hypoxia at high altitudes. Respir. Physiol. Neurobiol. 130, 223–233. Llapur, C., Martínez, M.R., Caram, M.M., Bonilla, F., Cabana, C., Yu, Z., Tepper, R.S., 2013. Increased lung volume in infants and toddlers at high compared to low altitude. Pediatr. Pulmonol. http://dx.doi.org/10.1002/ppul.22764. wileyonlinelibrary. com. Miller, M.R., Crapo, R., Hankinson, J., Brusasco, V., Burgos, F., Casaburi, R., Coates, A., Enright, P., van der Grinten, C.P.M., Gustafsson, P., Jensen, R., Johnson, D.C., MacIntyre, N., McKay, R., Navajas, D., Pedersen, O.F., Pellegrino, R., Viegi, G., Wanger, J., 2005a. General considerations for lung function testing. Eur. Respir. J. 26, 153–161. Miller, M.R., Hankinson, J., Brusasco, V., Burgos, F., Casaburi, R., Coates, A., Crapo, R., Enright, P., van der Grinten, C.P.M., Gustafsson, P., Jensen, R., Johnson, D.C., MacIntyre, N., McKay, R., Navajas, D., Pedersen, O.F., Pellegrino, R., Viegi, G., Wanger, J., 2005b. Standardisation of spirometry. Eur. Respir. J. 26, 319–338. Pérez Padilla, J., Valdivia, G., Muiño, A., et al., 2006. Valores de referencia espirométrica en 5 grandes ciudades de Latinoamérica para sujetos de 40 o mñs aáos de edad. Arch. Bronconeumol. 42, 317–325. Pellegrino, R., Viegi, G., Brusasco, V., Crapo, R.O., Burgos, F., Casaburi, R., Coates, A., van der Grinten, C.P.M., Gustafsson, P., Hankinson, J., Jensen, R., Johnson, D.C., MacIntyre, N., McKay, R., Miller, M.R., Navajas, D., Pedersen, O.F., Wanger, J., 2005. Interpretative strategies for lung function tests. Eur. Respir. J. 26, 948–968. Quanjer, P.H., Tammeling, G.J., Cotes, J.E., Pedersen, O.F., Peslin, R., Yernault, J.C., 1993. Lung volumes and forced ventilatory flows. work group on standardization of respiratory function tests. european community for coal and steel. official position of the european respiratory society. Eur. Respir. J. Suppl. 16, 5–40. Quanjer, P.H., Stanojevic, S., Cole, T.J., Baur, X., Hall, G.L., Culver, B.H., Enright, P.L., Hankinson, J.L., Ip, M.S.M., Zheng, J., Stocks, J., the Global Lung Function Initiative, E.R.S., 2012. Multi-ethnic reference values for spirometry for the 3–95-yr age range: the global lung function 2012 equations. Eur. Respir. J. 40, 1324–1343. Quanjer, P.H., Kubota, M., Kobayashi, H., Omori, H., Tatsumi, K., Kanazawa, M., Stanojevic, S., Stocks, J., Cole, T., 2015. Secular changes in relative leg length confound height-Based spirometric reference values. Chest 147, 792–797. Rabinovitch, M., Gamble, W., Nadas, A.S., Miettinen, O.S., Reid, L., 1979. Rat pulmonary circulation after chronic hypoxia: hemodynamic and structural features. Am. J.
139