Department of Electrical and Computer Engineering
SRAM Static Characterization Vishal Saxena, Boise State University (
[email protected])
Vishal Saxena
-1-
SRAM Read Static Noise Margin (SNM)
During reads, WL and BL are held at VDD Break the feedback from the cross-coupled inverters Plot voltage transfer characteristics (VTC) of the inverter in the half circuit as shown below (V2 vs V1) Use this plot to form the butterfly curve by overlapping the VTC with its inverse
Represents the two halves driving each other Read SNM is the side of the largest square fitted in the butterfly curve
Vishal Saxena
-2-
SRAM Read Static Noise Margin (SNM)
Since it’s difficult with Spectre to plot the inverse of the curve on the same graph Import the V2 vs V1 in MATLAB and do post-processing to generate the butterfly curve
Vishal Saxena
-3-
Read SNM Test Bench
Vishal Saxena
-4-
Read SNM Test Bench
Select and save the trace as a .csv file, say Vout.csv Start Matlab in the same directory Can also use Excel Either import the .csv file and plot yourselves OR Use the script in the following slides
Vishal Saxena
-5-
Matlab Script to plot Butterfly Curves %%%%%%%%%%%%%%%%%%%%%%%%%%%%%%%%%%%%%%%%%%%%%%%%%% % Script to plot SRAM Butterfly curve % % Save the vin vs vout DC sweep plot in the Spectre as a % CSV file 'Vout.csv' % Run this script in the same directory as the CSV file % The file uses the function importfile %%%%%%%%%%%%%%%%%%%%%%%%%%%%%%%%%%%%%%%%%%%%%%%%%% importfile('Vout1.csv'); % Change filename appropriately % vin is the first column vin = data(:,1); % vout is the second column vout = data(:,2); figure() plot(vin, vout); hold on; grid on; plot(vout, vin); %%%%%%%%%%%%%%%%%%%%%%%%%%%%%%%%%%%%%%%%%%%%%%%%%%
Vishal Saxena
-6-
Matlab Importfile Function %%%%%%%%%%%%%%%%%%%%%%%%%%%%%%%%%%%%%%%%%%%%%%%%%% function importfile(fileToRead1) %IMPORTFILE(FILETOREAD1) % Imports data from the specified file % FILETOREAD1: file to read % Import the file newData1 = importdata(fileToRead1); % Create new variables in the base workspace from those fields. vars = fieldnames(newData1); for i = 1:length(vars) assignin('base', vars{i}, newData1.(vars{i})); End %%%%%%%%%%%%%%%%%%%%%%%%%%%%%%%%%%%%%%%%%%%%%%%%%%
Vishal Saxena
-7-
Read Butterfly Plot
Fit the largest square in the butterfly Two stable states (0 and 1) A higher SNM indicates better read stability Vishal Saxena
-8-
SRAM Write Noise Margin (WNM)
During a write, WL is at VDD, and the data is driven onto the BLs Break the feedback from the cross-coupled inverters Plot voltage transfer characteristics (VTCs) of the inverter in the half circuit as shown below (V2 vs V1 and V1 vs V2) Here, VTCs of the two halves are not the same
Since one of the BL is driven to VDD and other to 0 (asymmetry). Write NM is the side of the largest square fitted in between the two curves
Vishal Saxena
-9-
Write NM Test Bench
Vishal Saxena
-10-
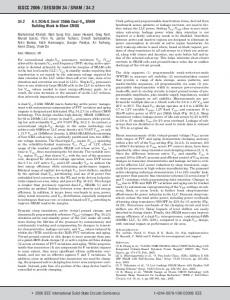
Write Butterfly Plot
Fit the largest square between the curves Two stable states (0 and 1) A higher WNM indicates better write stability
Vishal Saxena
-11-