SRM-Buffer: An OS Buffer Management Technique to Prevent Last Level Cache from Thrashing in Multicores Xiaoning Ding
∗
The Ohio State University
[email protected]
Kaibo Wang
Xiaodong Zhang
The Ohio State University
[email protected]
The Ohio State University
[email protected]
Abstract Buffer caches in operating systems keep active file blocks in memory to reduce disk accesses. Related studies have been focused on how to minimize buffer misses and the caused performance degradation. However, the side effects and performance implications of accessing the data in buffer caches (i.e. buffer cache hits) have not been paid attention. In this paper, we show that accessing buffer caches can cause serious performance degradation on multicores, particularly with shared last level caches (LLCs). There are two reasons for this problem. First, data in files normally have weaker localities than data objects in virtual memory spaces. Second, due to the shared structure of LLCs on multicore processors, an application accessing the data in a buffer cache may flush the to-be-reused data of its co-running applications from the shared LLC and significantly slow down these applications. The paper proposes a buffer cache design called Selected Region Mapping Buffer (SRM-buffer) for multicore systems to effectively address the cache pollution problem caused by OS buffer. SRM-buffer improves existing OS buffer management with an enhanced page allocation policy that carefully selects mapping physical pages upon buffer misses. For a sequence of blocks accessed by an application, SRMbuffer allocates physical pages that are mapped to a selected region consisting of a small portion of sets in LLC. Thus, when these blocks are accessed, cache pollution is effectively limited within the small cache region. We have implemented a prototype of SRM-buffer into Linux kernel, and tested it with extensive workloads. Performance evaluation shows SRM-buffer can improve system performance and decrease the execution times of workloads by up to 36%. Categories and Subject Descriptors D.4.2 [Operating Systems]: Storage Management—Main memory ∗ Currently
working at Intel Labs Pittsburgh.
Permission to make digital or hard copies of all or part of this work for personal or classroom use is granted without fee provided that copies are not made or distributed for profit or commercial advantage and that copies bear this notice and the full citation on the first page. To copy otherwise, to republish, to post on servers or to redistribute to lists, requires prior specific permission and/or a fee. EuroSys’11, April 10–13, 2011, Salzburg, Austria. c 2011 ACM 978-1-4503-0634-8/11/04. . . $10.00 Copyright
General Terms Design, Performance
1.
Introduction
CPU cache and operating system buffer cache are two critical layers in the memory hierarchy to narrow the speed gap between CPU and memory and the speed gap between memory and disks. Since CPU cache is at the hardware level while the buffer cache is a part of operating system, these two layers are designed independently without necessary awareness of each other. However, with the prevalence of multicore architecture and increasingly large capacity of main memory, if these two layers do not work cooperatively, severe performance degradation may be incurred due to mutual impact to each other. On a multicore processor, a thread accessing a large set of data cached in OS buffer may significantly slow down its co-runners because it can easily pollute the shared hardware cache(s) in the processor. This problem needs to be paid serious attention by OS researchers. An OS buffer cache keeps recently accessed file system data blocks in memory. Thus, future accesses to these blocks can be satisfied from the main memory without long-latency disk accesses. It also buffers recently generated data blocks to delay corresponding disk writes and to absorb rewrites. As the main memory size continues to grow, an increasingly large amount of data blocks can be buffered in memory to serve file accesses of running applications. Data in OS buffer cache usually have much weaker temporal localities than that in virtual memory spaces [Leung 2008, Roselli 2000]. One of the major reasons is that files are often used by applications as a data storage rather than a working space. For example, an application processing an array of records stored in a file iteratively reads a record from the file into an object in its virtual space and works on the object before it moves forward to the next record. In the application, the object is repeatedly used and has strong temporal locality, and the records stored in the file have weak temporal locality (they are accessed only once during every execution of the application). For simplicity, in this paper, we refer to the data in buffer cache as buffer data and the data in application virtual spaces as VM data, and we refer to CPU cache as cache and OS buffer cache as buffer.
File accesses are usually bursty [Gribble 1998]. Thus, when an application accesses buffer data or generates a large amount of buffer data, it evicts to-be-reused VM data from caches and pollutes the caches with buffer data. CPU cache pollution may significantly increase the number of cache misses and lead to serious performance degradation. Though the cache pollution problem incurred by OS buffer also exists on single-core processors, it is particularly serious on multicore processors, where the shared last level cache architecture is a conventional design. As we will show later in section 2, a thread reading or writing blocks in OS buffer can slow down another thread co-running with it significantly by a factor of two. The main reason for the performance degradation is that cache pollution leads to severe thrashing in the cache shared by the threads. When the thread accessing buffer data evicts to-be-reused VM data of its co-running threads from the shared cache, the corunning threads keep reloading the evicted VM data into the shared cache upon their reuses. The cache thrashing caused by evicting and reloading the to-be-reused VM data significantly degrades application performance. On a multicore system, through a shared cache, a thread can influence and at the same time be influenced by the execution of multiple co-running threads sharing the cache with it. This intensifies the degree of cache thrashing, as well as the degree of performance degradation. For example, on an Intel Core i7 processor, four cores share the same L3 cache. Thus any thread accessing data in OS buffer may slow down multiple threads. On future processors, a cache may be shared by many cores, and the cache pollution may degrade performance even more seriously. Cache pollution incurred by OS buffer in existing systems can trace back its root of the page allocation policies, which target to minimize disk accesses caused by paging and OS buffer misses, without taking into account how much cache pollution may be incurred by accessing the blocks in the allocated pages. Upon buffer misses, OS buffer management allocates physical pages to hold the demanded disk blocks. It selects physical pages holding the virtual pages or disk blocks that are not likely to be used in near future, and evicts the virtual pages or blocks to vacate the physical pages for the demanded blocks. The selected physical pages are rather “randomly” mapped to different regions of the shared cache, and make it difficult to control the cache pollution caused by accessing the data in the pages. To address the cache pollution problem, we have designed a buffer management scheme called Selected-RegionMapping-Buffer (SRM-buffer). SRM-buffer effectively reduces cache pollution with an enhanced page allocation policy. Unlike the buffer management in existing OS’s, SRMbuffer carefully selects physical pages as buffer misses happen. For the related blocks that might be repeatedly accessed in sequence, SRM-buffer refers to them as a sequence and allocates physical pages that are mapped to a small region
consisting of a small portion of sets in the shared cache, leveraging the fixed mappings between physical pages and cache sets. Thus, when these blocks are re-accessed later on, cache replacement is limited within this cache region, and cache pollution can be alleviated. Operating systems assign a distinct color to each cache region and the physical pages mapped to the region. Thus, physical pages allocated to the blocks in the same sequence are in the same color in SRMbuffer. Two technical issues are addressed in SRM-buffer. One issue is how SRM-buffer predicts which blocks are related and accessed together in sequence so that SRM-buffer selects physical pages in the same color for them. To achieve our goal, we have developed a few heuristics based on the information passed down from OS scheduler and file system. The other issue is how to coordinate different requirements of buffer management and virtual memory management on physical page allocation, while retaining the hit ratio of OS page cache. To reduce cache conflicts, virtual memory management prefers to evenly allocate physical pages in all available colors. To reduce paging activity and OS buffer misses, OS page replacement prefers to reclaim the physical pages holding inactive virtual pages and stale blocks that might not be reused. However, to reduce CPU cache pollution incurred by OS buffer, SRM-buffer prefers to allocate physical pages in the same color. As we will explain later in Section 3, exhaustively allocating pages in one color may hurt page hit ratio because memory for active virtual pages or non-stale blocks may be reclaimed. At the same time, it causes an uneven color distribution among available physical pages, and thus increases the difficulty to evenly allocate physical pages to virtual memory. To satisfy and balance the above requirements on physical page allocation, SRM-buffer makes a trade-off among OS buffer reducing cache pollution, virtual memory management reducing cache conflicts, and page replacement maintaining high hit ratios. SRM-buffer does not exhaustively allocate physical pages in one color. Instead, SRM-buffer uses different colors for blocks in different sequences, and for a long sequence, SRM-buffer switches colors regularly each time when an appropriate number (e.g. 256 in our current design) of physical pages in a color have been allocated. As we will show in section 4, the trade-off has a minimal effect to the capability of SRM-buffer to reduce cache pollution, but it can effectively avoid the negative effects on virtual page allocation and OS page replacement. The contributions of the paper are threefold. First, this is the first work that identifies and studies the performance degradation problem caused by bursty OS buffer accesses on multicore systems. Second, we have proposed an effective solution to address the problem by carefully selecting physical pages to buffer disk blocks. Finally, with a prototype implementation based on Linux kernel 2.6.30, we have tested our solution with extensive experiments, which show
Background and Motivation
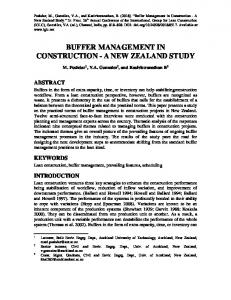
In general, multicore processors have shared last level caches (LLC). Examples include Intel Core 2 and Nehalem, AMD Opteron and Phenom, Sun Niagara, and IBM Power7. Figure 1 illustrates the shared cache structures with Intel Xeon 5355 processors (Core 2 architecture) and Intel Core i7 860 processors (Nehalem architecture), which are used in our experiments. On a Xeon 5355 processor, each core has private L1 caches, and every two cores share an L2 cache. On a Core i7 processor, four cores share the same L3 cache, and each core has an L1 data cache, an L1 instruction cache, and an L2 cache.
3000
120 100
uncontrolled controlled
2000
60
4MiB L2 Cache 4MiB L2 Cache
Main Memory
32KiB L1 32KiB L1 ( Instruction)
( Data)
(a) Intel Xeon 5355 Core 32KiB L1 32KiB L1
8MiB L3 Cache Main Memory
( Instruction)
( Data)
256KiB L2 Cache
(b) Intel Core i7 860
Figure 1: Hardware caches in Intel Xeon 5355 (Core 2) and Core i7 (Nehalem) multicore processors Compared to private cache architectures on single-core processors, shared cache architectures reduce cache coherence overhead and increase cache space utilization with space sharing and data redundancy reduction. However, pollution in a shared cache may cause cache thrashing, and lead to more significant performance degradation than it does in private cache architectures. In this section, we present an experimental case to demonstrate that the cache pollution problem caused by visiting buffer data in OS buffer can significantly degrade application performance. In the experiment, we run two applications on a Xeon 5355 processor. Application grep looks for a randomly-generated character string in a tarball containing Linux kernel source code. Before the experiment, we warm up the OS buffer so that accesses to the tarball are satisfied in OS buffer. The other
uncontrolled controlled
1500
40
1000
20
500 0 200 400 600 800 1000 1200 1400 1600 Array Size (KB)
0 200 400 600 800 1000 1200 1400 1600 Array Size (KB)
(a) Slowdown of mergesort
Core
2500
80 LLCM
2.
application mergesort sorts an array of 64-byte records with a non-recursive 2-way mergesort algorithm. In the experiment, we vary the array size from 256KiB to 1.5MiB by increasing the number of records. The working set size of mergesort is about two times of the array size, which is smaller than the L2 cache size on the Xeon 5355 processor. To measure how much mergesort is slowed down by grep, for each size of the array, we run mergesort and grep together for two times. We first run the applications on two cores that do not share L2 cache, and collect an execution time T1 of mergesort. Then we run them on two cores sharing the same L2 cache, and collect another execution time T2 of mergesort. We also collect the number of last level cache misses (denoted LLCM) incurred by every million instructions of mergesort. Finally, we calculate the slowdown of mergesort (i.e. (T2 − T1 )/T1 ), and show the changes of the slowdown and LLCM in Figure 2a and Figure 2b, respectively.
Slowdown (%)
our design can effectively improve system performance and decrease the execution times of the workloads. The rest of the paper is organized as follows. Section 2 briefly introduces the CPU cache designs in common multicore processors and explains how bursty OS buffer accesses may cause performance degradation on multicore systems with an illustrative example. Section 3 describes the design of the SRM-buffer. Section 4 provides a comprehensive evaluation of SRM-buffer. This is followed by a related work session where we also discuss other techniques that may address the problem. Section 6 concludes the paper.
(b) Last level cache misses (LLCM) incurred by every million instructions of mergesort
Figure 2: A comparison of the performance degradation of mergesort due to the co-running grep polluting the shared L2 cache on the existing Linux system that does not control the pollution (solid lines) and on an improved system that controls the pollution (dotted lines). The array size is varied from 256KiB to 1.5MiB in mergesort. When we increase the number of records in mergesort, it becomes more possible for the records to be evicted from the last level cache by grep, because the temporal locality of the records gets weaker. As a result, we see the LLCM of mergesort increases significantly and the slowdown increases accordingly. When the array size is increased to 1.5MiB, mergesort is slowed down by as much as 114%. Physical Address Cache Set IndexCache Line Offset
Physical Page Number
Page Offset
Cache Color
Figure 3: Physical address in the page coloring technique The performance degradation can be reduced by carefully selecting physical pages to hold the blocks in the tarball visited by grep. The selection is based on the page coloring technique, which was proposed in operating systems to reduce cache misses through careful mapping between virtual
pages and physical pages [Kessler 1992]. The logic of the page coloring technique is shown in Figure 3. Memory management in operating systems uses the most significant bits of a physical address as the physical page number. When the address is used in a cache lookup operation, some bits in the middle (cache set index in the figure) are used to determine the cache set to look up. There are several common bits between the cache set index and the physical page number. These bits are referred to as cache color, or color for brevity. Cache sets with the same color value in their cache set indexes form a cache region. Physical pages mapped to the same cache region also have the same color. Due to the fixed mapping between physical pages and cache sets, there are a fixed number of physical pages in each color. For example, there are 64 different cache colors on Intel Xeon 5355 processor with a page size of 4KiB. These colors evenly divide the last level cache into 64 nonoverlapping regions and divide physical pages into 64 disjoint groups. If the physical memory size is 4GiB, there are 16384 pages (i.e. 64MiB physical memory for 4KiB pages) in each color. Virtual memory management prefers to allocate physical pages in different colors to virtual pages consecutively accessed by an application, so that these pages can use different cache regions to reduce cache conflicts. In the experiment, instead of manipulating the mapping between physical pages and virtual pages, we improve the mapping between physical pages and buffer pages. We use physical pages in the same color to hold the file blocks visited by grep. Thus, grep only pollutes the corresponding cache region, and other cache regions are not affected. To confirm the effectiveness of this method, we re-run the applications on two cores sharing the same LLC. We show the slowdowns in Figure 2a with the dotted line. We observe that the slowdowns are significantly reduced, compared to the cases in which the improvement has not been made. At the same time, the execution of grep is not affected. Figure 2b explains the reason by showing the significant LLC miss reduction for mergesort. When the array size is 1.5MiB, the LLC misses can be reduced by 78%. As a result, the slowdown is reduced from 114% to 30%. The above example shows the serious performance degradation caused by visiting weak locality buffer data and demonstrates the effectiveness of improving OS buffer page allocation scheme to address this problem. This case study motivates our SRM-Buffer design that will be described in the next section.
3.
Selected Region Mapping Buffer Design
In the simple example in last section, cache pollution is restricted within a small cache space by allocating physical pages in the same color to hold buffered blocks. However, to use the similar method in production systems, some practical issues must be addressed. These issues arise because there
are only a fixed number of physical pages in each color. In this section, we first describe these issues and explain how we address them. Then we introduce the design of the SRMbuffer. 3.1
Technical Issues in SRM-buffer Design and Implementation
A straight-forward method for OS buffer to reduce cache pollution is to use only physical pages in a few dedicated colors for OS buffer and physical pages in other colors for other purposes. Though this solution can limit the cache pollution within the corresponding cache regions, it is not practical due to the large sizes of OS buffers and the fixed number of physical pages in each color. OS buffer usually accounts for a large percent of memory usages in modern computer systems. We have examined the memory usage on 24 machines in our department with the free command. On average, OS buffers occupy 62% of the physical memory on these machines. This is consistent to the observation in previous work [Bi 2010, Lee 2007]. Given the large sizes of OS buffers, it is not viable to reserve a small number (e.g. 1 or 2) of colors for an OS buffer because there are not enough physical pages in these colors to hold the buffer. Nevertheless, it is not reasonable to assign a sufficient amount of colors (e.g. half of the colors available on the system) dedicatedly to OS buffer either, because it would shrink the cache space available to virtual memory and hurt the performance of computation-intensive applications accessing last level caches with strong localities. LLC
Buffer Pages
1
4
3
1 2 3 4 … n
2 … n … 3
1
2 … n
(a) LLC
Buffer Pages 1 1 … 1 1
4
…
Time
1 2 3 4 … n
4 3 … 4 3 4
(b)
3
n n n … Time
Figure 4: Buffer pages consecutively accessed by an application with a conventional OS buffer (in subfigure a) or an SRM-buffer (in subfigure b). Each subfigure shows the cache regions in the LLC on the top, the buffer pages accessed by the application at the bottom, and the mappings between the cache regions and buffer pages in the middle. The numbers distinguish the colors. SRM-buffer does not reserve dedicated colors for OS buffer pages. To control cache pollution, for the consecutively accessed buffer pages over a period of time, it tries to minimize the number of colors of the physical pages assigned to them, and thus minimizes the number of cache regions being polluted. This is illustrated by Figure 4 with an example comparing the colors of buffer pages accessed by
an application in a conventional OS buffer (Figure 4a) and in an SRM-buffer (Figure 4b). In an SRM-buffer, the application accesses a batch of buffer pages in color #1 in the first time period. Then, in another time period, it accesses pages in colors #3 and #4. After that, it accesses a batch of pages in #n. Thus, only one or two cache regions are polluted in each time period. In comparison, in a conventional OS buffer, the buffer pages visited by the application are rather randomly mapped to the cache regions in LLC. In each time period, any cache region may be polluted. To achieve the objective described above, SRM-buffer identifies groups of related blocks that are usually accessed in sequence. Then it assigns physical pages in the same color to the blocks in the same group. For example, files are usually accessed sequentially from beginning to end. Thus the blocks in the same file are usually in the same group. In Figure 4b, blocks in color #1 are in one group, and blocks in color #4 are in another group. For simplicity, we call each block group as a sequence and the group size as sequence length in the rest of the paper. Because accessing the blocks in the same sequence only pollutes a single cache region, SRM-buffer is more effective to control cache pollution with longer sequences. When the length of each sequence is 1, an SRM-buffer becomes a conventional OS buffer. With appropriate sequence lengths, SRM-buffer reduces cache pollution in three ways: (1) If an application only accesses a few sequences, cache pollution is limited within a few cache regions. For the example in Figure 4b, if the application does not visit other buffer data besides that in four sequences, it pollutes only four cache regions with the SRM-buffer, instead of all the cache regions with a conventional OS buffer. (2) If an application accesses many block sequences (e.g. more than the number of cache regions in the LLC), in each time period, cache pollution is limited within a few cache regions because consecutively accessed blocks are usually correlated and are in same sequences. Thus, most cache regions can still be efficiently used without suffering from cache pollution at any time. (3) The total size of the buffer pages in a sequence is usually larger than the size of a cache region. Mapping the pages in the same sequence to the same cache region makes later-accessed buffer data evict previously-accessed buffer data from the cache region, and thus reduces the chance to replace VM data. The implementation of SRM-buffer into operating systems need to address two technical issues. One is how to detect block sequences. To avoid the high cost associated with re-mapping a page to a new cache region [Zhang 2009], SRM-buffer must identify blocks belonging to same sequences when they are loaded into OS buffer and provides them with physical pages in appropriate colors. Though an OS buffer can observe which and in which order file blocks are accessed, it is not effective to detect sequences based only on the temporal order of the accesses. For example, when multiple running applications access file blocks con-
currently, their access streams are mixed together. The consecutively accessed blocks in the mixed stream may not be taken as a sequence, due to the lack of logical correlations. They are accessed consecutively only because the applications happen to run together. Next time, if the application mix changes or the applications proceed with different speeds, the temporal order of the blocks will change accordingly. To detect sequences, SRM-buffer uses a few heuristics based on some scheduling and file system information, which are to be introduced in Section 3.2. The other issue that SRM-buffer must address is how to coordinate different requirements of buffer management and virtual memory management on physical page allocation, while retaining a high hit ratio of OS page cache. In many current systems, OS buffer and virtual memory system are integrated into a page cache [Pai 1999, Silvers 2000]. SRMbuffer allocates physical pages in the same color to the blocks in the same sequence. When SRM-buffer allocates physical pages to long sequences, active pages in desired colors may be reclaimed prematurely, despite the availability of free pages or inactive pages in other colors. This reduces the hit ratio of page cache. MRU 1 … 3
2
1
4
2
1 … 3
2
4
LRU 4 … 4
Free List 3 … 3
3
3
3 … 3 4 … 4 Page Faults
2 … 2 2 Buffer Misses
Figure 5: An example illustrating the conflicting requirements on page allocation among different components in OS memory management Figure 5 illustrates this issue with an example, in which physical pages are allocated upon a series of page faults and buffer misses. In the figure, each rectangle is a physical page. The number in each rectangle is the color of the page (we assume there are four different colors in the system indexed from 1 to 4). An LRU list is on the top of Figure 5, which is used by the page replacement component to organize non-free pages in page cache and to make replacement decisions 1 . On the LRU list, active pages are organized on the MRU end and inactive pages are on the LRU end. Below the LRU list, the figure shows a free list, which organizes free physical pages 2 . Pages on the free list are allocated to hold virtual pages on page faults or to hold file blocks on OS buffer misses. When the number of free pages drops below a threshold, inactive pages on the LRU list are reclaimed to refill the free list. The page faults and buffer cache misses are shown at the bottom of Figure 5 with circles. The arrows show which physical pages are allocated to resolve the page faults and buffer misses. The numbers in the circles show the colors of the physical pages allocated. As shown in Figure 5, when SRM-buffer allocates physical pages in color #2 to a sequence, active pages are reclaimed though there are inac-
tive pages in other colors (shadowed rectangles in the figure) that are less likely to be reused in the future. This may hurt the hit ratio of the page cache. Virtual memory management prefers to evenly allocate physical pages in different colors to consecutively accessed virtual pages to reduce cache conflicts. However, the allocation of physical pages in same colors in SRM-buffer causes an uneven color distribution among the physical pages available to virtual memory. In SRM-buffer, blocks in the same sequence usually have same access pattern. They are loaded into OS buffer together. Allocating physical pages in the same color to them may exhaust free pages or inactive pages in that color. At the same time, their pages are accessed and may be released together. When the blocks become inactive, their pages move gradually to the LRU end of the LRU list. When the blocks are released, their pages move together onto the free list. Thus, when the blocks in a few long sequences become inactive or are released, the LRU end of the LRU list or the free list may be dominated by pages in the corresponding colors. This makes it difficult for virtual memory management to evenly allocate physical pages in different colors on page faults. This problem is also illustrated in Figure 5. In the figure, the LRU end of the LRU list and the free list are dominated by pages in color #4 and pages in #3. Thus, only pages in color #3 and #4 are allocated to resolve the page faults. This increases cache conflicts, because the accesses to these pages can only use cache regions in colors #3 and #4, instead of all the cache regions. To prevent this problem, an OS may search the LRU list for pages in desired colors and reclaim them. However, the overhead can be high, and the hit ratio of OS page cache may be reduced if active pages are reclaimed prematurely. 3.2
The Design of SRM-buffer
The allocation of physical pages in same colors to sequences may increase cache conflicts and reduce page cache hit ratio. To minimize the impact, SRM-buffer first sets a threshold (Tl ) on sequence length. It breaks down sequences longer than Tl into multiple shorter sequences, and allocates pages in different colors to them. We will show in Section 4 how to select an appropriate Tl to minimize cache pollution and at the same time to avoid impacts on page cache hit ratio. Then SRM-buffer uses a data structure called colored zone to coordinate the allocation of physical pages for buffer cache and for virtual memory. SRM-buffer divides physical memory space into two zones, as shown in Figure 6. The normal zone is managed by OS replacement with its data structures (e.g. the active list and inactive list in Linux OS). Active pages and most in1 A production system may use other replacement algorithms, e.g. CLOCK.
We use LRU in the example is just to simplify the illustration without losing the generality. 2 Buddy allocation system may be used in production systems. Using free list is just for illustration purpose.
Normal Zone
Refill
Colored Zone
Page Allocation
…
Figure 6: Data structures used in SRM-buffer to organize physical pages. active pages are managed in the normal zone to maintain the hit ratio of OS page cache. The colored zone manages free pages and a small number of inactive pages. To facilitate the physical page allocation for OS buffer and virtual memory, SRM-buffer organizes the pages in the colored zone into multiple lists, and each list links the pages in the same color. When a page in the colored zone is hit, it is moved to the normal zone. On page faults or OS buffer misses, SRM-buffer reclaims pages in the colored zone. DATA STRUCTURE: #define THRESHOLD 256 #define NR_COLORS 128 /* Num of colors in system*/ #define FILE_SIZE_THRESHOLD (THRESHOLD*4096) STRUCT process{ ... int color, vm_color, nr_block; } STRUCT file{ ... int color, nr_block; } FUNCTION: update_color(int *c, int *nr_block) { (*nr_block)++; IF (*nr_block mod THRESHOLD == 0) { remove the mark on the list in color c; search colored zone for a unmarked list with \ more pages than THRESHOLD if nothing is found, replenish colored zone \ and repeat the search; l = the list found; mark l; *c = the color of l; *nr_block = 0; } } ON A BUFFER CACHE MISS: f = the file the demanded block is in; IF ( sizeof(f) > FILE_SIZE_THRESHOLD) { /* Same-file Heuristic */ update_color(&(f->color), &(f->nr_block)); alloc page in color f->color; return; } /* Same-application Heuristic */ p = the process read/write the block; update_color(&(p->color), &(p->nr_block)); alloc page in color p->color; return; ON A VM PAGE FAULT: p = current process; allocate a physical page in color p->vm_color; p->vm_color = (p->vm_color++) mod NR_COLORS;
Figure 7: The page allocation algorithm in SRM-buffer Figure 7 shows the algorithm that SRM-buffer uses to allocate physical pages. On page faults, it reclaims physical pages on different lists (i.e. in different colors) for virtual memory management to reduce cache conflicts. On a buffer miss, it first determines which sequence the demanded block
is in. Then it allocates a physical page in the same color as that of other blocks in the sequence. If the demanded block is the first block in a sequence, SRM-buffer selects a list in the colored zone with more pages than Tl , and reclaims a page on the list to hold the demanded block. When such a list cannot be found or a list becomes empty, SRM-buffer refills the colored zone by fetching some inactive pages from the normal zone till the shortest list has more pages than Tl . For example, in Linux OS, SRM-buffer moves inactive pages from the LRU end of the inactive list to the colored zone. SRM-buffer relies on the following two heuristics to form sequences. • Same-file Heuristic: blocks are considered to be in the same
sequence because they are in the same file. Most files, especially large files, are sequentially accessed [Leung 2008, Roselli 2000]. Thus, SRM-buffer allocates physical pages in the same color to every Tl consecutively accessed blocks in the same file to prevent accessing these blocks from polluting CPU cache. SRM-buffer only applies this heuristic to files larger than Tl blocks. This is to prevent SRM-buffer from generating too many short sequences in case applications access a large number of small files, because short sequences negate SRM-buffer’s ability to reduce cache pollution. • Same-application Heuristic: blocks that are consecutively
accessed by the same process are considered to be in the same sequence. In a system, the same application might be executed multiple times on the same set of data. Thus the blocks consecutively accessed by the same process might be accessed together again in the next run. Based on this heuristic, blocks in multiple small files consecutively accessed by the same application can be viewed as a sequence.
4.
Performance Evaluation
We have implemented a prototype of the SRM-buffer into Linux kernel version 2.6.30. With the prototype implementation, we tested the performance of SRM-buffer against a set of micro-benchmarks, real applications, and database workloads. In this section, we first introduce our experiment setup. Then we present the experimental results. 4.1
Experiment Setup
We carried out our experiments on two machines. One machine is a Dell PowerEdge 1900 workstation with two 2.66GHz quad-core Xeon X5355 processors, and the other is a Dell Precision T1500 workstation with an Intel Core i7 860 processor. The architectures of the processors are described in Section 2. The memory sizes of the two machines are 16GiB and 8GiB, respectively. The operating system is 64-bit Red Hat Enterprise Linux AS release 5. The file system is ext3. We used pfmon [HP Corp. 2010] to collect
performance statistics such as last level cache misses. The sequence length threshold Tl is 256. 4.2
Experiments with Database Workloads
In this subsection, we test SRM-buffer with a PostgreSQL database server [PostgreSQL 2008] supporting data warehouse workloads. Most data warehouses use a star or snowflake schema, where join and scan are two most common operations [Ailamaki 2001, Qiao 2008, Stonebraker 2007]. Thus, we created a database in a star schema structure, consisting of a large fact table and several small dimension tables. The size of the fact table is about 4GiB, and the record length is 128 bytes. The numbers of records in the dimension tables range from 100,000 to 600,000, with each record of 256byte length. Thus the sizes of the dimension tables are from about 24MiB to 146MiB. We used a client program to issue both hash-join-based queries and sequential-scan-based queries to the database server. A sequential-scan-based query (sequential-scan for simplicity) is to summarize the statistic information over the fact table. It searches the records in the fact table, and carries out a hash aggregate over the records that satisfy the conditions specified in the WHERE clause. A hash-joinbased query (hash-join for simplicity) works on the fact table and a dimension table. It selects the records in the dimension table that satisfy the conditions in the WHERE clause. The selectivity is about 10%. For each record in the fact table, it finds a matching record among those selected from the dimension table based on the join predicate, and carries out an aggregation operation over the matching record pair. To accelerate the join operation, it builds a hash table for the selected records from the dimension table with the key specified in the join predicate so that a matching record can be quickly located. When a hash-join co-runs with a sequential-scan, the PostgreSQL backend process serving the sequential scan keeps loading the blocks in the fact table from OS buffer to its virtual space 3 , and scans the records in the blocks. Thus it pollutes the last level cache in the processor it runs on. If the hash-join and the sequential scan run on the cores sharing the same last level cache, due to the cache pollution, the data in the hash table built for the dimension table may be frequently evicted from the last level cache, and the performance of the hash-join is degraded. To show the effectiveness of SRM-buffer in reducing cache pollution, we run hash joins and sequential scans on the cores sharing the same last level cache with the vanilla Linux 2.6.30 kernel and the kernel with SRM-buffer enhancement, respectively. We collected the response times and compared them against those collected when each of them runs alone (solo-runs). Due to the cache pollution and 3 PostgreSQL use a buffer ring replacement strategy, which gives sequential
scans a very small space in its buffer pool to avoid sequential scans flushing to-be-reused pages in its buffer pool and to minimize double buffering.
60
Slowdown (%)
50 join w/o SRM-buffer join w/ SRM-buffer scan w/o SRM-buffer scan w/ SRM-buffer
40 30 20 10 0 20
40
60
80 100 120 Table Size (MB)
140
160
(a) Slowdowns of hash-join and sequential-scan on PowerEdge 1900 35
Slowdown (%)
30 25
join w/o SRM-buffer join w/ SRM-buffer scan w/o SRM-buffer scan w/ SRM-buffer
20 15 10 5 0 20
40
60
80 100 120 Table Size (MB)
140
160
(b) Slowdowns of hash-join and sequential-scan on Precision T1500
Figure 8: The slowdowns of hash-join-based queries and sequential-scan-based queries (relative to their solo-runs) when they co-run on the vanilla Linux kernel and the kernel with SRM-buffer enhancement. The sizes of the dimension tables are from 24MiB to 146MiB. As the figure shows, compared to the sequential-scans, hash-joins are slowed down by much larger percentages. On average, when the Linux kernel without SRM-buffer is used, hash-joins are slowed down by 42% on PowerEdge 1900 and by 26% on Precision T1500, and sequential-scans are slowed down by 3% on PowerEdge 1900 and by 1% on Precision T1500. This is because sequential-scans have weak temporal localities, and they are not affected by cache pollution. The slowdowns of sequential-scans are due to the contention on the hardware resources other than the shared last level cache, e.g. the memory controller and memory bus. The slowdowns of hash-joins are largely caused by the to-be-reused data in hash tables being evicted from the last level cache. We observed that hash-joins with smaller dimension tables are slowed down by smaller percentages. For example, on PowerEdge 1900, the hash-join with the 24MiB dimension table is slowed down by 17%, but the hash-join with the 98MiB dimension table is slowed down by 58%. This is because hash table sizes are roughly proportional to the di-
mension table sizes. Hash tables built for smaller dimension tables are smaller and less likely to be evicted from the last level cache than those built for larger dimension tables. On both machines, SRM-buffer reduces the slowdowns of hash-joins by reducing cache pollution caused by sequentialscans. The slowdowns of hash-joins are reduced significantly by up to 33% on PowerEdge 1900 and by up to 24% on Precision T1500. On average, the response times of hashjoins are reduced by 17% on PowerEdge 1900 and by 14% on average on Precision T1500. While in most data warehouses queries are simple due to the use of star/snowflake schemes and materialized views, there are complex data warehouse queries that need to be paid a special attention due to their long execution times. To study the performance of SRM-buffer with complex database queries, we use TPC-H queries as our workload [TPC 2010]. The data set size of TPC-H benchmark is about 2GiB (scale factor is 2). Two groups of queries are selected. Queries Q6 and Q15 are in the first group. They spend most of their execution time on sequentially scanning the fact table lineitem, which incurs a large number of OS buffer accesses. Other queries (Q5, Q7, Q8, Q10, Q11, and Q18) are in the second group. These queries have mixed features. They spend a significant portion of their execution time on operations such as multi-level joins, index scans, and sortings. These operations mainly access PostgreSQL virtual memory space. On the leaf nodes of their execution plan trees, there are operations that sequentially scan lineitem or major dimension tables, which incur OS buffer accesses. Before the experiment, we vacuum the database so that query executions can be more efficient and OS buffer becomes warm. In the experiment, we run combinations of two queries on PowerEdge 1900. Each of the first three combinations consists of a query from the first group and a query from the second group. Each of the other combinations consists of two queries from the second group. We run each query combination on both vanilla Linux kernel and the kernel with SRM-buffer, and collect query execution times. Then we calculate the slowdowns of each query relative to its solo-run. 25%
Slowdown (%)
the contention for shared resources (e.g. last level cache space, memory controller and bandwidth), the response times collected when the queries co-run are larger than those of their solo-runs. We show the slowdowns of the sequential scans and the hash-joins with different dimension tables in Figure 8.
Linux w/o SRM-buffer
Linux w/ SRM-buffer
Q6 Q8
Q10 Q11
20% 15% 10% 5% 0% Q6 Q7
Q7 Q15
Q5 Q11
Q7 Q18
Figure 9: The slowdowns of TPC-H queries on PowerEdge 1900. We show the slowdowns in Figure 9. Generally, SRMbuffer cannot achieve as good performance with complex queries as it does with simple queries. This is because the
mergesort
FFT
MM
tar
PostMark
grep
PostMark
tar
grep
PostMark
tar
grep
100 80 60 40 20 0 tar
In this subsection, we selected the following benchmarks, which are briefly described as follows, and measured their execution times in varying scenarios. • grep is a tool to search a collection of files for the lines matching a given regular expression. We run it to look for a randomly generated word from the directory we have used to compile and install PostgreSQL 8.3. The total size of the files in the directory is about 100MiB. • tar is a tool that puts multiple files into the single archive. We run it to put the files under the above mentioned PostgreSQL directory into a tarball. • PostMark is an industry-standard benchmark from Network Appliance Inc, which is designed to emulate Internet applications such as e-mail server and news groups [Katcher 1997]. It conducts file accesses and operations, such as reading or appending files, and creating or deleting files over a pool of files. At the beginning of our experiment, PostMark creates 1,000 files whose sizes range from 128KiB to 384KiB. Then a number of accesses and operations are performed on these files. About 20% of file accesses are reads and the rest are appending. Half of file operations create new files, and the other half delete files. • mergesort is a synthetic benchmark as described in Section 2. The array size is 1.5MiB. • FFT, MM, and LU are from NIST SciMark2 benchmark [Pozo 2000]. FFT performs one-dimensional fast Fourier transformation. MM multiplies two sparse matrices in compressed-row format. LU computes the LU factorization of a dense matrix. Among the benchmarks, mergesort, FFT, MM, and LU focus on the data in their virtual memory spaces. For convenience, we call these benchmarks VM-intensive applications. In comparison, benchmarks grep, tar, and PostMark more focus on the data saved in files. These benchmarks read data into their VM spaces from files, carry out some processing, and save newly-generated data into files if there is any. We call these benchmarks file-intensive applications. • Experiments on PowerEdge 1900
PostMark
Experiments with Other Workloads
grep
4.3
We first carry out experiments on PowerEdge 1900. We select two cores sharing the same last level cache to run the benchmarks. In each experiment, we co-run a VM-intensive application with a file-intensive application on the cores. Before the experiment, we run each of the applications individually multiple times without the interference from the other application to warm-up the OS buffer and to collect its solorun execution time. Due to the resource contention and cache pollution, corunning the applications increases the execution times. In Figure 10a, we show the performance slowdowns of the VMintensive applications on the vanilla Linux 2.6.30 kernel and on the kernel with an SRM-buffer enhancement. Without SRM-buffer, the VM-intensive applications are slowed down by 64% on average due to the co-running with file-intensive applications. With SRM-buffer, the slowdowns can be reduced to 28% on average. The reduction of the slowdowns corresponds to the reduction of execution times from 16% to 29% (by 22% on average), which is shown in Figure 10b. For the file-intensive applications, we have not observed noticeable performance differences between the executions on the kernels with and without SRM-buffer.
LLC Miss Reduction (%)
query plan trees of complex queries are more complex than those of simple queries, and complex queries spend more time on the operations on the non-leaf nodes of their query plan trees, which mostly access virtual memory. Thus, they cause less intensive cache pollution and incur smaller slowdowns than simple queries. This limits the potential that SRM-buffer improves performance. In the first three combinations, only the queries from the second group (Q7 and Q8) suffer from cache pollution. Thus, SRM-buffer reduces their slowdowns by 7%∼10%. The queries from the first group (Q6 and Q15) have similar performance on both kernels. In the other three combinations, both queries cause cache pollution and suffer from cache pollution at the same time. SRM-buffer can reduce the slowdowns for both of them.
LU
Figure 11: The reduction of last level cache misses for VMintensive applications on PowerEdge 1900. The performance improvement comes from the significant reduction of extra last level cache misses incurred by cache pollution. We have collected the number of last level cache misses with pfmon and found that last level cache misses can be reduced by 34% to 85% for the VM-intensive applications after adopting SRM-buffer in the kernel. This is shown in Figure 11. • Experiments on Precision T1500 On Precision T1500, there are four cores sharing the same last level cache. Thus, we co-run four applications on them. Before each experiment, we run the applications individually to warm-up OS buffer and to get their solo-run execution times as we have done in the experiments on PowerEdge 1900. We select FFT, MM, LU, grep, and tar in the experiments. We first run the three selected VM-intensive applications with each of grep and tar on both the vanilla Linux
mergesort
FFT
MM
Linux w/o SRM-buffer
40 30 20 10 PostMark
tar
grep
tar
PostMark
grep
tar
PostMark
grep
PostMark
tar
0 grep
Exec. Time Reduction (%)
PostMark
tar
grep
PostMark
tar
grep
PostMark
tar
grep
PostMark
tar
grep
Slowdowns(%)
100 80 60 40 20 0
LU mergesort
Linux w/ SRM-buffer
(a) Slowdowns of the VM-intensive applications compared to their solo runs
FFT
MM
LU
(b) Performance improvement achieved by SRM-buffer
60 40 20 0 FFT
MM
LU
grep Linux w/o SRM-buffer
FFT
MM
LU
tar
40 30 20 10 0 FFT MM
Linux w/ SRM-buffer
(a) Slowdowns of the VM-intensive applications compared to their solo runs
LLC Miss Reduction (%)
Slowdowns (%)
80
Exec. Time Reduction (%)
Figure 10: The slowdowns of VM-intensive applications compared to their solo runs, and the performance improvement of these applications achieved by using SRM-buffer to reduce cache pollution on PowerEdge 1900.
LU
FFT MM
grep
LU
100 80 60 40 20 0 FFT MM
LU
FFT MM
grep
tar
(b) Performance improvement achieved by SRM-buffer
LU
tar
(c) LLC cache miss reduction
100 80 60 40 20 0
MM
1 2 3 Num. of Grep Applications Linux w/o SRM-buffer Linux w/ SRM-buffer
Slowdowns(%)
kernel and the kernel with SRM-buffer. The slowdowns of the VM-intensive applications on both kernels (compared to their solo-runs) are shown in Figure 12a. When a fileintensive application shares the same last level cache with multiple VM-intensive applications, it may slow down all the VM-intensive applications, as shown in the figure. For both the co-runnings with grep and tar, FFT has the smallest slowdowns, and MM has the largest slowdowns. This is because FFT accesses its data with the strongest temporal locality among the three VM-intensive applications, and MM has the weakest temporal locality. When the three VMintensive applications co-run with grep or tar, the data sets in the working set of MM are most likely to be evicted by the buffer data loaded by grep or tar, and the data sets in the working set of FFT are least likely to be disrupted. Figure 12a also shows that SRM-buffer helps reducing the slowdowns of all the VM-intensive applications, but at different degrees. SRM-buffer reduces the slowdown of MM by the largest degree because MM suffers most from the cache pollution caused by OS buffer. As illustrated in Figure 12c, for the co-running with grep, SRM-buffer reduces the LLC cache misses of MM by 90%. This reduces the slowdown of MM from 60% to 2%, which corresponds to a 36% execution time reduction, as illustrated in Figure 12b. To demonstrate how the performance of a VM-intensive application is degraded by multiple file-intensive applications. We co-run a VM-intensive application with a varied
Slowdowns(%)
Figure 12: The slowdowns of VM-intensive applications compared to their solo runs, and the execution time reduction and last level cache miss reduction of these applications achieved by Linux with SRM-buffer on Precision T1500. 100 80 60 40 20 0
LU
1 2 3 Num. of Grep Applications Linux w/o SRM-buffer Linux w/ SRM-buffer
Figure 13: The slowdowns of MM and LU (compared to their solo-runs) when each of them co-runs with a varied number of grep (from 1 to 3). number of file-intensive applications. In Figure 13, we show the slowdowns of MM and LU when each of them co-runs with grep on both the vanilla Linux kernel and the kernel with SRM-buffer enhancement. When we increase the number of grep processes from 1 to 3, the slowdowns of MM and LU increases accordingly. We see the slowdown of MM is increased from 32% to 84%, and the slowdown of LU is increased from 24% to 88%. With SRM-buffer, the slowdowns can be significantly reduced. Even co-running with three grep applications, the slowdowns of MM and LU can still be limited below 26% with SRM-buffer. 4.4
Experiments on Access Pattern Changes
The performance of SRM-buffer relies on allocating physical pages in the same color to hold the blocks in the same sequence. The sequence detection and subsequent buffer page
Exec. TIme Reduction (%)
allocation in a prior run of an application are expected to effectively reduce cache pollution for its later runs, because the blocks in the same sequence are likely accessed in the same order from the OS buffer as that in the sequence. However, a reasonable speculation is that the sequences detected for an application and the corresponding page allocation do not fit the access patterns of other applications, and cannot reduce cache pollution they incur. To investigate the interference effect caused by the different access patterns in different applications, we designed experiments in which two applications access the same set of data with different access patterns on PowerEdge 1900. We use grep and diff as file-intensive applications, and use FFT, MM, and LU as VM-intensive applications. Diff is a tool that compares two files or two directories in a byte-bybyte manner. Grep and diff scans files in different access patterns. Grep scans files basically in the order of their layout in the file system, but diff visits files in the alphabetic order of directory names and file names. In this subsection, we use diff to compare two identical PostgreSQL directories, which are also used by grep to search a randomly generated key from. Most files in the PostgreSQL directories are source files and object files with sizes less than 100KiB. In the experiments, we run one of grep and diff to load the file blocks in the two PostgreSQL directories into the OS buffer, and then use the other to co-run with each VMintensive application on the cores sharing the same last level cache. Specifically, in one experiment, for each of the vanilla Linux kernel and the kernel with SRM-buffer, we execute diff to load the file blocks into OS buffer. The sequence detection and buffer page allocation are based on the access patterns in diff. Then we co-run grep with each VMintensive application, and collect the execution times of the applications. For each VM-intensive application, we calculate the execution time reduction achieved by the kernel adopting SRM-buffer. In the other experiment, we switch grep and diff. On each kernel, we execute grep to load the file blocks into the OS buffer. Then we co-run diff with each VM-intensive application, and collect the execution times. We also calculate the execution time reductions for VMintensive applications. Figure 14 compares the execution time reductions obtained in the above two experiments against those obtained in the cases where the same file-intensive application loads the file blocks into OS buffer and then co-runs with a VMintensive application. The comparison confirms that access pattern changes can reduce the effectiveness of SRM-buffer. However, SRM-buffer can still achieve decent performance improvements. We have analyzed the reason. In the experiments, the blocks in each file are accessed in the same order by grep and diff, though files are accessed in different orders. Thus, to some degree, the sequences detected during grep warming up OS buffer can help reducing the cache pollution incurred
30 25 20 15 10 5 0 FFT
grep (grep)
MM
grep (diff)
LU
diff (diff)
diff (grep)
Figure 14: The execution time reductions of FFT, MM, and LU achieved by SRM-buffer. The names in brackets indicate the file-intensive applications loading the data set into OS buffer, and the names outside of brackets indicate the fileintensive applications co-running with VM-intensive applications. by diff accesses these blocks, and vice versa. In the experiments, most files in the PostgreSQL directories are small. With larger files, the access pattern changes would have less impact on SRM-buffer’s performance. Please note that in most cases files are accessed sequentially from beginning to end [Roselli 2000]. This makes SRM-buffer have good resistance to access pattern changes under normal workloads. 4.5
Experiments with Contrived Adverse Workloads
To demonstrate the extent to which SRM-buffer could be ill-behaved, we have designed a few arguably worst-case scenarios. In the first scenario, a synthetic workload reads the blocks in a 512MiB file with a random access pattern. Each time it reads 4096 bytes from a file, and there is no think time between consecutive reads. In this case, no matter how SRM-buffer assigns physical pages, it cannot reduce the cache pollution incurred by the workload. In the experiment, we first scan the file sequentially to warm up the OS buffer. Then we co-run the workload with VM-intensive applications, including MM, LU, and FFT. Our experiments show that the performance of the VM-intensive applications does not change no matter whether SRM-buffer is enabled or not. Though SRM-buffer cannot improve performance in this scenario, it does not cause performance degradation because of its low overhead. In the second scenario, we use an application to repeatedly scan a file. The file size is 3.4MiB on PowerEdge 1900 and 7.4MiB on Precision 1500. Without SRM-buffer, the data set in the file can fit into the last level cache. Thus, accessing it does not incur last level cache misses after the data set is loaded into the cache during the first scan. However, with SRM-buffer, the buffer pages are mapped to only a few cache regions (4 on PowerEdge 1900 and 8 on Precision 1500), which cannot hold the data set. Thus, each scan may incur a large number of misses in the last level cache, and the execution is slowed down. We compare the execution times of the application on the vanilla Linux kernel and the Linux kernel with SRM-buffer. The application is slowed down by 12% on PowerEdge 1900
Hit Ratio (%)
80
on page cache hit ratio on the systems with small amounts of physical memory, one can reduce the sequence length threshold Tl . As shown in Figure 15, when memory size is 512MiB, with the Tl lowered to 128, the hit ratio difference between Linux systems with and without SRM-buffer can be significantly reduced to 3.8%. We will show in the next subsection that SRM-buffer can achieve decent performance improvement even when Tl is reduced to 16. 4.6
Parameter Sensitivity
In SRM-buffer, the sequence length threshold Tl is an important parameter. With larger thresholds, SRM-buffer can form longer sequences, and thus can reduce cache pollution more effectively. However, forming long sequences may reduce the hit ratio of OS page cache. With the experiments in this subsection, we show that there is a range of Tl that can effectively reduce cache pollution with minimum impacts on page cache hit ratio. 35 30 Exec. Time Reduction (%)
and by 17% on Precision 1500 with SRM-buffer enabled, which represent a substantial performance loss. However, the performance loss could often be avoided at application level by copying the data set to virtual memory space first and using the copy in virtual memory space. When the system is close to running out of free pages, SRM-buffer moves inactive pages to fill the colored zone. These inactive page may be reclaimed prematurely. When physical memory size is large, the colored zone accounts for a small percentage of physical memory space. For example, on PowerEdge 1900, when Tl is equal to 256, the colored zone usually occupies less than 0.8% of the physical memory. Thus only a relatively small amount of coldest pages may be moved to the colored zone because SRMbuffer moves coldest pages first (e.g. pages on the LRU end of the inactive list in Linux OS). Changing the reclamation order of these pages will not hurt OS page cache hit ratio. However, if the physical memory size on a system is small, the colored zone may account for a nontrivial portion of physical memory. For example, when physical memory size is 1024MiB, the colored zone can occupy about 12% of the physical space, assuming the number of colors is 64 and Tl is 256. Thus active pages may be used to fill the colored zone and be replaced prematurely.
25 20 15
FFT-grep MM-grep LU-grep FFT-tar MM-tar LU-tar
10 5
40
0 0
20
Linux w/o SRM-buffer Linux w/ SRM-buffer(256) Linux w/ SRM-buffer(128)
0 512
1024 2048 Memory Size (MB)
4096
Figure 15: Page cache hit ratios of PostMark on Linux systems with and without SRM-buffer when memory size is varied from 512MiB to 4GiB. The numbers in brackets are sequence length thresholds. To study how SRM-buffer affects OS page cache hit ratio, in the last scenario, we reduce physical memory size gradually from 4GiB to 512MiB and compare the page cache hit ratios of PostMark benchmark on the Linux kernels with and without SRM-buffer. In order to change the physical memory size, we carry out the experiments in a virtual machine. To stress the page cache, we increased the number of files in PostMark to 32,000. Figure 15 shows the hit ratios. When memory size is large, SRM-buffer has little impact on hit ratio. However, when memory size is smaller than 1GiB, the hit ratio may be reduced by a non-trivial percentage. For example, the hit ratio is reduced by 11% when memory size is 512MiB and sequence length threshold Tl is 256. To reduce the penalty
50 100 150 200 250 300 350 400 450 500 550 Threshold
Figure 16: The execution time reductions of FFT, MM, and LU achieved by SRM-buffer in their co-runnings with grep or tar. The sequence length threshold Tl is varied from 16 to 512. In the experiments, we vary the value of Tl from 16 to 512, and re-run the experiments of co-running each of FFT, MM, and LU with grep or tar on PowerEdge 1900, because their performance is more sensitive to the value of Tl than others. In Figure 16, we show the execution time reductions of the VM-intensive applications achieved by SRM-buffer reducing cache pollution. When Tl is less than 128, increasing Tl can significantly improves the performance of SRMbuffer. As shown in the figure, the average execution time reduction increases quickly from 14% to 24% when Tl is increased from 16 to 128. However, increasing Tl to more than 128 only yields incremental performance improvements for SRM-buffer. When Tl is increased from 128 to 512, the average execution time reduction is increased by 1.7%. Based on these experiments, a system with a reasonable physical memory size can choose a desired sequence length threshold between 128 and 512 to effectively reduce cache pollution without reducing OS page cache hit ratio.
4.7
Experiments with More Cores
When more cores share the same cache, more applications may access OS buffer and pollute the cache. Thus, application performance is degraded more seriously. To show this trend, we select a micro-benchmark, which sorts the records saved in files. For each file, it reads the records from the file, sorts them with a blocked merge sort algorithm, and saves the sorted records into the file. File sizes are from 32MiB to 64MiB, and record size is 32B. We select a Core i7 processor with a 8MiB L3 cache shared by 4 cores and a Xeon 7560 processor with a 24MiB L3 cache shared by 8 cores. The cores in the processors have same private cache resources. On each processor, we run multiple instances of the benchmark simultaneously, one on each core. When one instance is reading or writing records, it pollutes the shared cache and slows down other instances. To calculate the slowdowns, we also run one instance of the benchmark alone on each processor. When the block size is 0.5MiB, the average slowdown is 11% on the Core i7 processor and is 13% on the Xeon 7560 processor. When the block size is increased to 0.75MiB, the average slowdown increases to 15% on the Core i7 processor and to 25% on the Xeon 7560 processor. The slowdowns are higher on the Xeon 7560 processor because cache pollution happens more frequently with more instances running on the Xeon 7560 processor.
5.
Related Work
With the prevalence of multicores, the performance issues with the shared resources on multicores, especially the shared last level caches, have attracted much attention. To address these issues, a few researchers develop sophisticated scheduling policies for multicores to co-schedule threads that can efficiently use the shared resources [Fedorova 2005, Knauerhase 2008, Zhuravlev 2010]. Cache pollution incurred by OS buffer can be reduced by improving OS scheduling policy to avoid co-running VM-intensive applications and file-intensive applications or to run them on the cores that do not share the last level cache. However, such policy makes VM-intensive applications share the last level cache and the caused space contention degrades their performance. Meanwhile, enforcing such scheduling policies depends on the availability of cores not sharing caches and the classification of applications, which is not always available. Besides improving thread scheduling, some efforts have been focused on cache partitioning to provide each of the running threads with a chunk of dedicated cache space to avoid interference from other co-running threads [Lin 2008, Tam 2007, Zhang 2009]. They only target private data sets in each thread’s virtual space. The data sets shared by multiple threads, including the data sets in OS buffer, are largely ignored in their designs. 3
Based on the page coloring technique, there are methods proposed to reduce cache pollution introduced by visiting weak locality data in application virtual memory [Lu 2009, Soares 2008]. These methods keep weak locality data within physical pages in a few dedicated colors. These methods are proposed for virtual memory management, and cannot be adapted to alleviate the cache pollution problem caused by an OS buffer, because OS buffer is in kernel space and does not belong to any applications. At the same time, these methods require the total size of weak locality data not exceeding a small percentage of physical memory size. This requirement is not practical for an OS buffer, which usually accounts for a large percentage of physical memory in a computer system. There are other techniques to avoid memory accesses polluting CPU caches with the facilities provided by processors, such as noncacheable memory supports and streaming load/store supports [Intel 2010]. Cache pollution can also be reduced by invalidating the cache lines holding weak locality data promptly after their data usage. However, our experiments discover that using the techniques to reduce cache pollution incurred by a buffer cache can significantly impact the throughput of the buffer cache (Limited by space, results are not included in the paper). There are various reasons. For example, setting buffer pages noncacheable reduces throughput because memory controller prefetching is refrained and spatial locality cannot be exploited. Improving I/O performance of OS buffer has been one of the most actively researched area. Intelligent replacement algorithms have been proposed to keep active blocks in memory to minimize I/O operations (e.g. 2Q [Johnson 1994], MQ [Zhou 2004], ARC [Megiddo 2003], and LIRS [Jiang 2002]). A few works reduce the power consumption of OS buffers [Bi 2010, Lee 2007]. However, for our best knowledge, we have not see any work focusing on addressing the CPU cache pollution problem caused by OS buffer.
6.
Conclusion
On a multicore system, a thread accessing a large data set in buffer cache can slow down its co-running threads significantly by a factor of two because it flushes the to-be-reused data of its co-running threads from the shared last level cache on the processor. SRM-buffer addresses the problem by enhancing the page allocation policies in OS buffer. It leverages the fixed mapping between physical pages and cache regions. On OS buffer misses, it carefully selects physical pages to resolve the misses. The selection is to ensure that the buffer pages in an OS buffer are mapped to appropriate cache regions, such that, when a thread accesses a large data set in buffer cache, every group of buffer pages consecutively accessed by the thread are mapped to a few cache regions. Thus, during the time period in which the buffer pages in the same group are accessed, the cache pollution is limited within the corresponding cache regions. To achieve
the objective, SRM-buffer detects block sequences and allocates physical pages mapped to the same cache region to the blocks in each sequence. Our evaluation with a prototype implementation in Linux kernel shows SRM-buffer can improve application performance and decrease the execution times of workloads by up to 36%.
7.
Acknowledgments
We are grateful to Dr. Herbert Bos for his comments and suggestions on the final version of the paper. We thank the anonymous reviewers for their constructive comments. This research was supported by National Science Foundation under grants CNS0834393, CCF0913150, and a CIFellowship subaward CIF-B-173.
References [Ailamaki 2001] Anastassia Ailamaki, David J. DeWitt, Mark D. Hill, and Marios Skounakis. Weaving relations for cache performance. In VLDB’01, pages 169–180, 2001. [Bi 2010] Mingsong Bi, Ran Duan, and Chris Gniady. Delay-hiding energy management mechanisms for DRAM. In HPCA’10, pages 1–10, 2010. [Fedorova 2005] Alexandra Fedorova, Margo Seltzer, Christoper Small, and Daniel Nussbaum. Performance of multithreaded chip multiprocessors and implications for operating system design. In USENIX’05, pages 26–26, 2005. [Gribble 1998] Steven D. Gribble, Gurmeet Singh Manku, Drew Roselli, Eric A. Brewer, Timothy J. Gibson, and Ethan L. Miller. Self-similarity in file systems. pages 141–150, 1998. [HP Corp. 2010] HP Corp. Perfmon project, 2010. URL http: //www.hpl.hp.com/research/linux/perfmon. [Intel 2010] Intel. intel 64 and ia-32 architectures optimization reference manual, 2010. [Jiang 2002] Song Jiang and Xiaodong Zhang. LIRS: an efficient low inter-reference recency set replacement policy to improve buffer cache performance. In SIGMETRICS’02, pages 31–42, 2002. [Johnson 1994] Theodore Johnson and Dennis Shasha. 2Q: A low overhead high performance buffer management replacement algorithm. In VLDB’94, pages 439–450, 1994. [Katcher 1997] Jeffrey Katcher. PostMark: a new file system benchmark. Technical report, Network Appliance Inc., 1997. TR 3022. [Kessler 1992] R. E. Kessler and Mark D. Hill. Page placement algorithms for large real-indexed caches. ACM Trans. Comput. Syst., 10(4):338–359, 1992. [Knauerhase 2008] Rob Knauerhase, Paul Brett, Barbara Hohlt, Tong Li, and Scott Hahn. Using os observations to improve performance in multicore systems. IEEE Micro, 28(3):54–66, 2008. [Lee 2007] Min Lee, Euiseong Seo, Joonwon Lee, and Jin-soo Kim. Pabc: Power-aware buffer cache management for low power consumption. IEEE Trans. Comput., 56(4):488–501, 2007. [Leung 2008] Andrew W. Leung, Shankar Pasupathy, Garth Goodson, and Ethan L. Miller. Measurement and analysis of large-
scale network file system workloads. In USENIX’08, pages 213– 226, 2008. [Lin 2008] Jiang Lin, Qingda Lu, Xiaoning Ding, Zhao Zhang, Xiaodong Zhang, and P. Sadayappan. Gaining insights into multicore cache partitioning: Bridging the gap between simulation and real systems. In HPCA’08, pages 367–378, Salt Lake City, UT, 2008. [Lu 2009] Qingda Lu, Jiang Lin, Xiaoning Ding, Zhao Zhang, Xiaodong Zhang, and P. Sadayappan. Soft-OLP: Improving hardware cache performance through software-controlled objectlevel partitioning. In PACT’09, pages 246–257, 2009. [Megiddo 2003] Nimrod Megiddo and Dharmendra S. Modha. ARC: A self-tuning, low overhead replacement cache. In FAST’03, pages 115–130, 2003. [Pai 1999] Vivek S. Pai, Peter Druschel, and Willy Zwaenepoel. IO-lite: a unified I/O buffering and caching system. In OSDI’99, pages 15–28, 1999. [PostgreSQL 2008] PostgreSQL. PostgreSQL: The world’s most advanced open source database, 2008. URL: http://www.postgresql.org/. [Pozo 2000] Roldan Pozo and Bruce Miller. SciMark 2.0, 2000. URL: http://math.nist.gov/scimark2/. [Qiao 2008] Lin Qiao, Vijayshankar Raman, Frederick Reiss, Peter J. Haas, and Guy M. Lohman. Main-memory scan sharing for multi-core CPUs. PVLDB, 1(1):610–621, 2008. [Roselli 2000] Drew Roselli, Jacob R. Lorch, and Thomas E. Anderson. A comparison of file system workloads. In USENIX’00, pages 41–54, 2000. [Silvers 2000] Chuck Silvers. UBC: an efficient unified I/O and memory caching subsystem for netbsd. In USENIX’00, pages 54–54, 2000. [Soares 2008] Livio Soares, David Tam, and Michael Stumm. Reducing the harmful effects of last-level cache polluters with an OS-level, software-only pollute buffer. In MICRO’08, pages 258–269, 2008. [Stonebraker 2007] Michael Stonebraker, Chuck Bear, Ugur etintemel, Mitch Cherniack, Tingjian Ge, Nabil Hachem, Stavros Harizopoulos, John Lifter, Jennie Rogers, and Stan Zdonik. One size fits all? part 2: benchmarking results. In CIDR’07, pages 173–184, 2007. [Tam 2007] David Tam, Reza Azimi, Livio Soares, and Michael Stumm. Managing shared L2 caches on multicore systems in software. In WIOSCA, pages 26–33, 2007. [TPC 2010] TPC. TPC Benchmark H. http://www.tpc.org/tpch/spec/tpch2.13.0.pdf, 2010.
URL:
[Zhang 2009] Xiao Zhang, Sandhya Dwarkadas, and Kai Shen. Towards practical page coloring-based multicore cache management. In EuroSys’09, pages 89–102, 2009. [Zhou 2004] Yuanyuan Zhou, Zhifeng Chen, and Kai Li. Secondlevel buffer cache management. IEEE Trans. Parallel Distrib. Syst., 15(6):505–519, 2004. [Zhuravlev 2010] Sergey Zhuravlev, Sergey Blagodurov, and Alexandra Fedorova. Addressing shared resource contention in multicore processors via scheduling. In ASPLOS’10, pages 129– 142, 2010.