Utilising buffer management to manage patient flow Roy Stratton* and Alex Knight Nottingham Business School, Nottingham Trent University, Burton Street, Nottingham, NG1 4BU, UK (E-mail:
[email protected])* QFI Consulting, POBox 953, Tring, Herts, HP23 4ZX, UK
Abstract TOC buffer management has been successfully developed to improve patient flow across emergency and planned health and social care within the UK and Holland. This paper details these developments before attempting to uncover the theoretical basis of the approach through multi-case research across three UK hospitals. The authors demonstrate how buffer management concepts can be used to emulate the kanban control principles in a health and social care environment and thereby strategically support lean implementations. Keywords: Theory of Constraints, kanban, health care
The operations challenge in healthcare and social care With an aging population it is increasingly important to view health care delivery systems holistically, acknowledging the wider delivery system encompasses both health and social care. Therefore, effective and efficient acute heath care must also ensure strategic alignment of the social care system. This fact further demonstrates the complexity of this wider system as many different organisations need to be synchronised to ensure improvements in efficiency and timeliness associated with improved patient flow. However, the silo mentality, driven by separate organisational targets, often results in dysfunctional behaviour. In the UK the government drive to improve performance in the National Health Home Home Home Service (NHS) has had to Electives address many examples of such behaviour, especially Home GP referrals at the silo interface between social and Ambulances Acute CH ED medical care services. Figure 1 illustrates the Minors macro flow routes and the interface between health and social care. This GP: General Practitioner ED: Emergency Department CH: Community Hospital figure, in addition to the major flows, shows the Figure 1 HEALTH AND SOCIAL CARE SYSTEM - The chain of activities variation and uncertainty Hours
Days
Days
Days
Social & Health C are
Social & Health C are
So cial & Health Care
Residential & Nursing Care
Social & H ealth C are
Ho urs
Days
Days
Proceedings of the 16th International Annual EurOMA Conference (Implementation – realizing Operations Management), Goteborg, Sweden, June 09
associated with demand, process and recovery times. In the UK such times together with budgetary control are used to drive improvement and there are now emergency and planned treatment targets. The Emergency Department (ED) performance is measured against a government target for England that states 98% of patients are to be treated within 4 hours. The more recent planned treatment target states that 98% of patients are to have started treatment within 18weeks of referral by a General Practitioner (GP). In the UK the government sets the waiting targets and the local management are empowered to find appropriate means of achieving these targets whist remaining within budget. Agencies, such as the NHS Institute for Innovation and Improvement support this process and over the years a wide mix of tools and techniques have been adopted but in the last three years this has increasingly centred on lean thinking. This would appear to mirror worldwide healthcare interest in lean that is reflected in the growth in lean healthcare books (Zidel, 2006; Fillingham, 2008 and Graban, 2009). As a consequence a flow focus has emerged, with an emphasis on eliminating wasteful variation associated with batching, poor layout discipline and mis-synchronisation. There is a clear emphasis on continuous improvement with much of the lean activity centring on kaizen rapid improvement events that typically last up to a week. However, these kaizen events are often not strategically focused as suggested by Dan Jones in his Lean Enterprise August 08 news letter. ‘Improvement is not so easy to sustain… With only loose direction from top management it is difficult to trace the results from these islands of improvement… and no one checks. We recently did an assessment of a hospital that had done 93 kaizen events. The success rate was less than 20% and none of these had impacted the core A&E process that really kept the CE awake at night’ (Jones, 2008) The traditional means of strategically focusing continuous improvement in Ohno’s Toyota Production System is through kanban control (Ohno, 1988: 30). ‘Kanban is a way to achieve just-in-time; its purpose is just-in-time. Based on this, production workers start work by themselves, and make their own decisions concerning overtime. The kanban system also makes clear what must be done by managers and supervisors. This unquestionably promotes improvement in both work and equipment.’ (Ohno, 1988:29) However, kanban or its equivalent does not feature in the application of lean thinking to healthcare. This paper argues that a variant on TOC buffer management is effectively meeting this requirement in the management of patient flow in both emergency and planned care. QFI Consulting have led these developments within the UK NHS over more than five years which have been highly regarded by the senior management of the hospitals concerned as indicated by the following quotes. ‘TOC has been applied to improved patient flow in A&E, Assessment Units, and discharge planning. This has resulted in a sustained reduction in medical length of stay from 8.6 to 6.3 days (>25%). Released bed capacity supported the achievement of the 18 week GP referral to treatment target, a year ahead of schedule.’ Martine Price, Director of Governance and Nursing, Taunton and Somerset NHS Foundation Trust (October 08) Proceedings of the 16th International Annual EurOMA Conference (Implementation – realizing Operations Management), Goteborg, Sweden, June 09
‘With the help of Theory of Constraint we have been able to move Barnet & Chase Farm Hospitals NHS Trust from one of the worst performing trusts in England to one of the top performing. In Q4 (2007-2008) we were the top performing trust in London for the 4 hour target and 6th across England. Also, by applying the Theory of Constraints to our discharge process we have been able to reduce our length of stay by 27% and we know we can improve further on this.’ Averil Dongworth – CEO Barnet and Chase Farm NHS Trust (October 08) ‘The application of TOC has helped us to reduce our length of stay by up to 23% in one of our hospitals, but the real benefits from QFI Jonah are around improving how we deliver care to our patients through better planning and coordination of their care - ultimately it's about recognising that patients should go home as quickly and safely as possible.’ Jeffrey Worrall, Chief Executive, Sherwood Forest Hospitals NHS Foundation Trust (October 2008) This research has, therefore, been conceived to help explain the nature and extent of the improved performance in relation to the following research questions. Research question • How and why has buffer management contributed to improved patient flow? • How does buffer management relate to kanban control? Research method This case research involved access to the buffer management applications, the implementation process and the users of the system. Archival data, reports and semistructured interviews were used to answer the research questions in line with the good practice advocated by Yin (1994) and Eisenhardt (1989). A mix of hospital and social care staff were involved in gathering relevant data over a period of 18 months. Buffer management – origins and traditional applications Whereas Ohno (1988) developed kanban control to support the management of inventory flow (Ford, 1928), Goldratt focused on make to order (MTO) (1990) and project environments (1997) in developing the concept of time buffers. In the case of MTO the overall approach is termed Drum – Buffer - Rope (DBR). This approach is well documented and has been developed as a practical approach in the manufacturing environment (Goldratt, 1990; Umble and Srikanth, 1997; Schragenheim and Detmer, 2001; Stratton et al., 2008) as detailed below. • Drum: The drum can be a resource or market demand and we will assume for comparison it is market demand here. • Rope: This is the planning mechanism for releasing work and effectively chokes material release in line with customer requirements. This is the DBR mechanism for preventing over production where the rope represents the time offset that releases material in line with demand. • Buffer: Once material is released the time remaining is termed the buffer time, based on the assumption that touch time is negligible. To support the management of this buffer it is simply divided into three equal zones (See Figure 2). Proceedings of the 16th International Annual EurOMA Conference (Implementation – realizing Operations Management), Goteborg, Sweden, June 09
Probability of completion
The four main functions of DBR buffer management 1) Prioritise the flow of work according to buffer penetration. Work is release based on the choked release date set by the rope. Work is progressed with reference to the buffer penetration indicated either by the colour coding or a buffer penetration percentage. 2) Identify when to expedite potentially late arrivals. The red zone should effectively represent the tail of the distribution and relatively few orders should enter this zone Rope (see Figure 2). If they do this signals the need to act, that is, expedite where Green Amber Red Black necessary to ensure it is delivered within the remaining buffer. As has already been stated even though the red zone represents only one third of the lead time there is still time to complete an order even if it has not even been started by this time. Lead time 3) Signals when the whole Figure 2:Buffer management in an operations environment showing production system is buffer zoning of lead time distribution starting to become unstable. The system is acknowledged to have the capability to expedite a limited number of parts but if that rises above a certain level (Goldratt (1990) suggests over 10%) the system is at risk of going out of control. In such cases urgent action is required to bring the system back into control typically by limiting order intake or increasing capacity temporarily. 4) Identify main sources of delay in order to target improvement. Continuous improvement is about reducing variation (Deming, 1986) and in the flow context targeting sources of variation that threaten delivery, as with the kanban ‘river and rocks’ analogy. The equivalent in buffer management is associated with the exposure of the red zone and, therefore, it is necessary to record in some way why the order has entered the red zone. This information is periodically analysed using Pareto analysis and used to target the cause using lean tools. Project based buffer management In project management the assumption that touch time is a small percentage of the lead time is rarely valid. In this environment queuing, as with operations, does not dominate and, therefore, touch time, as in the task times, is a significant part of the overall lead time. Goldratt (1997) suggests the touch time is typically around 50% of the lead time. However, in this environment variation and uncertainty predominate and it is imperative that the associated time buffering is effectively managed to improve flow. In the traditional planning of projects, activity duration estimates are commonly formed into what is referred to as the critical path method. As with production the lead time including buffer time is allocated to each task in an attempt to accommodate the task uncertainty. However, informally allocating this ‘time buffer’ at the task level neither protects the project delivery promises effectively nor minimise the lead time. The TOC approach to buffer management in projects is called Critical Chain Project Proceedings of the 16th International Annual EurOMA Conference (Implementation – realizing Operations Management), Goteborg, Sweden, June 09
Management (CCPM) (Goldratt, 1997; Steyn, 2000; Stratton 2009) and as with DBR emphasises the need to manage the time buffer to accommodate and reduce the variation and uncertainty. However, in this case the touch time is a significant part of the lead time and the buffer concept needs to be redesigned to suit the project management application. To address this, the CCPM buffer is placed at the end of the project in what is called a project buffer and for non-critical activities there is a lower priority feeding buffer between that non-critical dependent chains and the critical chain. To create such buffer the excess time needs to be extracted from the task estimates. Goldratt (2007) advocates the project buffer and associated feeder buffers should be set at one third of the lead time of the related activities. With the buffers now positioned to protect the project as a whole the overall lead time arguably can be reduced. In summary there are three prime functions of CCPM buffer management. The four main functions of CCPM buffer management 1) Provide a priority mechanism across projects base on buffer status. A simple ratio of project buffer remaining to critical chain remaining enables resource providers to prioritise across projects. 2) Provide a mechanism for protecting the buffer and escalating recovery action. Unlike with DBR where action is only taken in the red zone it is important to reduce buffer consumption at all stages of a project. As there is effectively only one activity consuming the project buffer at any time the improved visibility of buffer consumption creates awareness and opportunity to support the resource concerned. 3) Track the prime causes of buffer consumption to target ongoing improvement activity. This is more complex than in DBR as the cumulative causes of delay are required and the relative importance is only subsequently known. Such systems are only feasible through computer support. 4) As with production there is a need to control the release of new projects to ensure lead times do not unnecessarily grow through multi tasking (Goldratt, 2007). This is typically achieved by choosing a resource towards the end of the project and ensuring the number of live projects is controlled. Emergency and planned care buffer management applications In healthcare two hybrid buffer management systems have emerged through the work of QFI Consulting as detailed below. Emergency Department buffer management application The ED embodies certain characteristics that need to be mapped onto the DBR approach in establishing the validity of the approach and how it can be effectively applied to this environment. The means by which QFI have achieved this is outline below. The design centres on the NHS 4 hour treatment target. • Drum: The pace of the system is set by the drum and in this environment it is determined by demand with no prior warning apart from the ability to forecast. The Department is expected to manage capacity in line with demand. • Rope: The rope would normally be used to control release of work into the system but in this environment there is no attempt to control release as all patients are considered to be in the 4 hour buffer on arrival. • Buffer: The buffer time of 4 hours commences on patient entry and as with standard buffer management practice this time is equally divided into three zones (see Figure 2) of 80 minutes each. This buffer management application is supported by Proceedings of the 16th International Annual EurOMA Conference (Implementation – realizing Operations Management), Goteborg, Sweden, June 09
software that tracks the patient buffer consumption with the priority being set by the time of entry. The buffer changes colour as time progresses and at each transition the activity currently delaying progress is selected from a drop down menu to provide data for subsequent analysis. This screen (see Figure 3) is updated by the person responsible for the patient and on discharge, or transfer to a Medical Assessment Unit (MAU), the patient is automatically removed from the screen. The practical application of the four functions of DBR buffer management are as follows: 1) The order of priority regarding the discharge target is simply the order of presentation, however, this clearly does not acknowledge clinical priorities that are expected to override this default priority sequence. 2) Patients in the red are within 80 minutes of breaching the target and the networked screen is used across the hospital to help expedite action by the resource causing the delay. The resource causing the delay of a patient is also informed separately from this screen.
Figure 3 ED Buffer Management system screen 3) The overall stability of the Emergency Department performance is monitored by the number of red zone penetrations and middle and senior management have visibility of this screen and can assess the situation and allocate additional resource to avoid ED going unstable. On an hourly basis analysis of the resources causing most delay across all patients is communicated. This escalation is deemed to be an essential part of the synchronisation of resources to enable flow. 4) The reasons for delay are subsequently analysed by charting the main causes of delay on entering the yellow, red and back zones. This data is used in buffer management meetings (typically weekly) aimed at focused continuous improvement effort. A Pareto graph is produced to present the main reasons for delay but this is also used in looking for causal links and any common causes that become a focus for rapid improvement. Patient discharge buffer management application Timely patient discharge applies to acute and community hospitals as well as social care homes and can be viewed as key to patient flow through the health and social care system. This application aims to shorten the length of stay (LOS) by subordinating all Proceedings of the 16th International Annual EurOMA Conference (Implementation – realizing Operations Management), Goteborg, Sweden, June 09
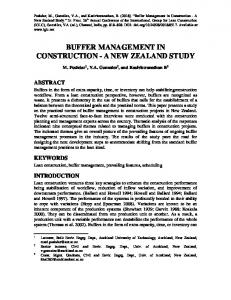
support activities to the medical needs of the patient with the aim that the patient’s position within the health and social care path is determined by medical needs alone. A first step in this discharge planning process is to set a Planned Discharge Date (PDD) when the patient first arrives as well as identify the activities that need to be completed before this date. In reality the PDD is initially indicative but can be updated as knowledge and circumstances dictate. The concept of a PDD is new to many hospitals but is essential to the planning and control system and as with CCPM the emphasis is on regularly updating the PDD to ensure relative priorities reflect the medical needs. With the time to discharge based on medical judgement alone it is necessary to ensure subordination (alignment) of the support activities. In this environment activity durations are more characteristic of a project where the touch time is significant as illustrated in Figure 4. Therefore, the projected buffer time remaining comprises the time to the planned discharge date (PDD) minus the longest activity duration yet to be completed. Accounting for the duration of activities has been simplified with the assumption that there is no activity dependency, therefore, the longest activity duration together with the time now and PDD enables the extent of the projected buffer penetration (see Figure 4). This application is effectively a hybrid combination of the CCPM and DBR buffering approaches. That is, the duration to PDD Planned effectively acts as a Patient Date of Arrives Discharge buffer as in DBR but the 25% longest activity duration 50% 25% 5 10 0 Days is acknowledged in Continuing Care Form determining the buffer (3 days) penetration. Finally, the Occupational Activities buffer regions have been Therapy (2 days) • The current time is in adjusted (see Figure 4) to Physiotherapy the green zone but the (2 days) account for the activity patient is projected to be in the red due to an duration offset. The activity duration of 3 software can provide days priority lists for the Figure 4 Discharge Buffer Management different specialists as in the case for continuing care. Buffer management Four buffer management functions operate in Discharge Buffer Management: 1) The priority status unlike ED will change with changes to the PDD and any changes to the longest remaining activity to complete. As PDDs can change in both directions the relative priority of different patient activities will change and are displayed simply through the on screen colour code. 2) Patient projected to stay beyond the PDD are shown in the black, therefore urgent, but as this predicts a future situation there is some room for recovery. The ‘reasons for delay’ data is circulated daily and the main reason for delay communicated as part of the escalation process. 3) As with DBR buffer management, the stability of the overall system is signified by the overall number of red and black buffer penetrations which provide advanced warning of the pending instability and the need to escalate recovery action. Proceedings of the 16th International Annual EurOMA Conference (Implementation – realizing Operations Management), Goteborg, Sweden, June 09
4) As with DBR buffer management the tracking of the activities that cause the delay are recorded to support the escalation process where the impact of the ‘reason for delay’ is measured but also analysed to identify common causes (see Figure 5). Figure 5 Discharge QFI Jonah top delay reasons by region These are then analysed at buffer management meetings, at the ward and the hospital/region level. Discussion The research evidence supports the claims of the CEOs that buffer management implementations having rapid, significant and a sustainable impact on patient flow, as illustrated in Figure 6. No of Breaches against 4 hour Target: March - August 1200 No. of breaches
1000 800
BHRT
600
KGH QH
400 200 20/07/2008
06/07/2008
22/06/2008
08/06/2008
25/05/2008
11/05/2008
27/04/2008
13/04/2008
30/03/2008
16/03/2008
02/03/2008
0
Weeks
Figure 6: Improvement in emergency breaches following buffer management implementations introduced from March to July 08. These improvements are the result of introducing both ED and Discharge Jonah buffer management within the wider delivery system. It is evident that understanding the flow relationship from ED through to social care has proved to be centrally important to the success of this approach which embraces these key concepts within a simple but Proceedings of the 16th International Annual EurOMA Conference (Implementation – realizing Operations Management), Goteborg, Sweden, June 09
effective variant on more traditional buffer management. Buffer management is concerned with managing flow in a variable and uncertain environment which clearly has links to earlier seminal work. Shewart (1931; 1939) introduced the modern concept of continuously reducing sources of variation and the associated waste, but it was Ford (1928) and then Ohno (1988) that showed how this applied in a flow environment. Buffer management would appear to conceptually link Statistical Process Control (SPC) and flow management, thereby providing means of managing the impact of variation and uncertainty on patient flow. Whereas Ohno (1988) used physical inventory buffering and the concept of enforced problem solving to target improvement time would appear to be a more appropriate choice in the healthcare environment. The buffer zoning, as with SPC, provides a simple means of interpreting the instability signals, focusing timely expediting and continuous improvement effort. Buffer management also has the potential to provide a timely signal to ensure growing capacity issues are escalated as the number of red zone penetrations are seen to change. This is the focus of some on-going research into establishing a responsive capability to dynamically adjusting capacity in response to special causes, such as trends in demand. The authors experience is that the buffer management concept is deceptively simple and it is easy to overlook the underlying concepts that make it work. This is evident in the growing number of commercial software tools that are not methodologically driven in their design and use. Conclusions Goldratt’s buffer management has provided an effective means of extending the flow principles associated with Ford and Ohno’s work to patient flow in health and social care. The focus on time, as oppose to inventory, has enabled the complex nature of patient flow to be controlled though the use of buffer aggregation and zoning, akin to Shewart’s SPC application. As with SPC this enables both system control signalling and the targeting of improvement activity. This paper has demonstrated how the concepts and theory has been practically extended to this environment as well as demonstrating the potential of integrating lean and TOC developments to improve overall patient flow. Whareas lean is acknowledged to be a medium to long term approach (Jones and Mitchell, 2006:3) TOC buffer management has demonstrated significant short term improvement to patient flow. The authors intend to follow this paper with a more detailed study of how lean and TOC buffer management can be effectively combined as advocated by Jones (2008). ‘The next phase of lean starts with top management learning to see the vital few actions, on the right products and service lines and the right customers that would have the biggest impact on the performance of the organisation. In the hospital getting the chaotic flow of patients through A&E under control is the key to establishing stability and a common rhythm across the rest of the hospital.’ (Jones, 2008) The authors respectfully propose that buffer management is a natural successor to kanban that enables flow control to be realised in a health and social care environment. However, more in depth research is needed to explore the underlying principles and develop their practical application further. References Bhasin, S. and Burcher, P.(2006), “Lean viewed as a philosophy,” Journal of Proceedings of the 16th International Annual EurOMA Conference (Implementation – realizing Operations Management), Goteborg, Sweden, June 09
Manufacturing Technology Management, Vol.17, pp. 56-72. Deming, W.E. (1986), Out of the Crisis. Cambridge, MA: MIT. Eisenhardt, K. M. (1989), Building Theories from Case Study Research. Academy of Management Review, 14(4), pp532-550. Fillingham, D., (2008), Lean healthcare. Kingsham Press, UK. Ford, H. (1926), Henry Ford – Today and Tomorrow. Portland, OR: Productivity. Goldratt, E.M. and Cox, J. (1984), The Goal. North River Press, NY. Goldratt, E.M. (1990), Theory of Constraints. New York: North River Press Goldratt, E.M. (1997), Critical Chain. North River Press, Great Barrington, MA. Goldratt, E.M. (2007), The Goldratt Webcast Program on Project Management Viewer Notes. V 4.71. GMG: Amsterdam. Graban, M., 2009, Lean Hospitals, Productivity Press, NY. Jones, T.J. (2008), Lean Enterprise Academy News Letter – 18 August. Download from www.leanuk.org on 13th Nov 08. Jones, D., Mitchell, A. (2006), Lean Thinking for the NHS, NHS Confederation, London. Ohno, T. (1988), The Toyota Production System; Beyond Large-Scale Production. Portland, OR: Productivity Press. Schragenheim, E., and Detmer, W. (2001), Manufacturing at Warp Speed. CRC Press. Shewart, W.A. (1931), Economic Control of Quality of Manufactured Product. New York, NY: Van Nostrand. Shewart, W.A. (1939), Statistical Method from the viewpoint of Quality Control. Washington. DC: Graduate School of the Department of Agriculture. Steyn, H. (2000), “An investigation into the fundamentals of critical chain project scheduling,” International Journal of Project Management 19, pp363-369. Stratton, R., Knight, A., and Williams, M. (2005), “Theory of Constraints and Healthcare Management”, Proceedings of the international conference of EUROMA (Operations and Global Competitiveness), Budapest, pp 1989-1998. Stratton, R., Robey D. and Allison I. (2008), “Utilising Buffer Management to Manage Uncertainty and Focus Improvement,” Proceedings of the International Annual Conference of EurOMA, Gronegen, the Netherlands (June). Stratton, R. (2009), “Critical Chain Project Management – Theory and Practice,” Proceedings of the 20th POMS Conference, Orlando, May 1st-4th. Umble, M.M., and Srikanth, M.L.,(1997), Synchronous Management: Profit based manufacturing for the 21st Century, Volume two: Implementation Issues and Case Studies. Spectrum Publishing Company, Guilford, CT. Umble, M.M. and Umble, E.J. (2006), “Utilising buffer management to improve performance in a healthcare environment,” European Journal of Operational Research 174, pp 1060-1075. Womack, J.P. and Jones, D.T. (1996), Lean Thinking-banish waste and create wealth in your Corporation, New York: Simon and Schuster. Yin, R.K. (1994), Case Study Research – Design and Methods. 2nd Ed., London: SAGE. Zidel, T.G. (2006), A Lean Guide To Transforming Healthcare, ASQ Quality Press, Milwaukee, Wisconsin.
Proceedings of the 16th International Annual EurOMA Conference (Implementation – realizing Operations Management), Goteborg, Sweden, June 09