SSGA & EDA Based Feature Selection and. Weighting for Face Recognition. Tamirat Abegaz#, Gerry Dozier#, Kelvin Bryant#, Joshua Adams#, Joseph Shelton# ...
SSGA & EDA Based Feature Selection and Weighting for Face Recognition Tamirat Abegaz#, Gerry Dozier#, Kelvin Bryant#, Joshua Adams#, Joseph Shelton#, Karl Ricanek^, Damon L. Woodard* #�orth Carolina A&T State University ^The University of �orth Carolina at Wilmington
*Clemson University Abstract— In this paper, we compare genetic and evolutionary feature selection (GEFeS) and weighting (GEFeW) using a number of biometric datasets. GEFeS and GEFeW have been implemented as instances of Steady-State Genetic and Estimation of Distribution Algorithms. Our results show that GEFeS and GEFeW dramatically improve recognition accuracy as well as reduce the number of features needed for facial recognition. Our results also show that the Estimation of Distribution Algorithm implementation of GEFeW has the best overall performance.
component), the second axis corresponds to the maximal remaining variation (the second principal component) in the dimension orthogonal to the first axis, and so on. The fundamental idea behind PCA is that if there are a series of multidimensional data vectors representing objects within a space (image space for our case) which have similarities, it is possible to use a transformation matrix to create a reduced space (i.e., face space) that accurately describes the original multidimensional vectors. Kirby and Sirovich [5] proposed the Keywords—Face Recognition, Steady State Genetic Algorithm, use of PCA for the analysis and representation of images, Turk and Pentalnd [6] used the PCA for face recognition Estimation of Distribution Algorithm, Eigenface, Feature systems. Selection. This work is an extension of the research performed by I. INTRODUCTION Abegaz et. al [7]. In their work, Abegaz et al. used Genetic The human face is an extremely complex visual stimulus and Evolutionary Feature Selection (GEFeS) and Weighting that articulates identity, emotion, ethnicity, age, and gender of (GEFeW) along with the Eigenface method. First, they individuals [1,2]. The human brain, by its nature, is highly implemented the Eigenface method to extract features from a adapted for compensating for changes that occur due to subset of the Face Recognition Grand Challenge (FRGC) various physiological (for example facial expression due to dataset [8]. In their dataset, they used 280 subjects, each emotion, aging), and environmental factors (such as subject having a total of 3 associated images (resulting in a illumination, pose) and performs face recognition efficiently total of 840 images). Abegaz et. al indicate that 560 features and accurately [3]. Automated Facial Recognition (FR) has were extracted for each image (for both in the gallery set, been a difficult task since it requires datasets that represent which is the pre-enrolled images, and the probe set, which is realistic scenarios in terms of changes such as illumination, the newly acquired images). They created Eigen-GEFeS and aging, and facial expression. On the other hand, automating Eigen-GEFeW that were instances of Steady State Genetic FR is useful for several applications such as passport Algorithms (SSGAs). In their work, Abegaz et. al. reported verification, entrance control, criminal investigation, and that Eigen-GEFeS and Eigen-GEFeW enhanced the overall performance of the Eigenface method while reducing the surveillance, to name a few [3]. The Eigenface method [3] is one of the most widely used number of features needed. Comparing Eigen-GEFeS with feature extraction techniques. It is capable of efficient and Eigen-GEFeW, their results showed that Eigen-GEFeW accurate feature extraction in a constrained environment performed better in terms of accuracy even though it used a where pose, illumination, and expression are similar between significantly larger number of features as compared to Eigenthe training and the test sets. Since all faces have similar GEFeS. In this paper, we extend the work of Abegaz et. al and structure such as two eyes, a nose between the eyes, a mouth, focus on two additional aspects: First, we used an Estimation etc, training and test set images can be grouped or of Distribution Algorithm (EDA) implementation of GEFeS concentrated at a specific location on a high dimensional data space. This method allows one to successfully extract those and GEFeW in addition to the SSGA implementations of dimensions required for efficient representation of the face GEFeS and GEFeW performed in [17]. Second, we investigate the performance of GEFeS and GEFeW across and ignore those that contribute less. The Eigenface method uses Principal Component Analysis multiple datasets which include FRGC [8, 9], Face (PCA) for feature extraction. In statistical terminology, PCA Recognition Technology (FERET) [10], Yale [11], and Essex [4] is a transform that chooses a new coordinate system for the [12]. The GEFeS and GEFeW implementations for our work dataset such that the greatest variance by any projection of the are instances of SSGAs and EDAs within eXploratory Toolset dataset comes to lie on the first axis (the first principal
for the Optimization Of Launch and Space Systems (XTOOLSS) [13]. The remainder of this paper is as follows. In Section II, we provide an overview of GEFeS and GEFeW, and in Section III we present our experiments. In Section IV, we present our results. Finally, our conclusions and future work are presented in Section V. II. GEFES AND GEFEW GEFeS and GEFeW [15, 16, 17, 18, 19, 20] were designed for the purpose of selecting and weighting high discriminating features used for biometric identification. In identification [21], the objective is to rank the gallery (the pre-enrolled images and their associated feature vectors) by similarity to the probe (the newly acquired images and their feature vectors) by comparing the probe features with each of the gallery features. Such ranking is computationally expensive particularly for real world applications that involve large number of images in a dataset. GEFeS and GEFeW are targeted to reduce the number of features by keeping only those features that have high discriminatory power and mask out those which have less contribution for FR.. Consider the matrix shown in Figure 1 as feature set.
56 �45 16 76
78 34 23 45
89 12 45 32
95 4 67 29
34 76 178 88
Figure 3 shows candidate binary-coded feature mask obtained from the real coded feature mask generated in Figure 2. In other words, the binary-coded value is a mapping of realcoded value into zeros and ones based on user specified threshold. When comparing a binary-coded candidate feature mask with the feature set, if a position corresponding to the feature set value in the candidate feature mask is 0 then that feature value is masked. Figure 4 shows the result of GEFeS when applied to the features matrix given in Figure 1.
0 45 � 16 0
0 0 23 0
89 0 0 0
95 0 0 29
34 76 178 0
Figure 4: The Resulting feature set after feature masking For GEFeW, the real-coded candidate feature mask is used to weight features. The value in Figure 5 is obtained by multiplying the real-coded feature mask with the feature matrix. In other words, when the real-coded value is multiplied by each feature value, it provides weighted feature matrix (see Figure 5). Whenever the weighted feature value of is 0 (or approximately equal to 0), it is considered as masked. Figure 5 shows the weighted feature set.
Figure 1: Sample feature set given as matrix
Consider also the matrix shown in Figure 2 as a candidate real-coded feature mask.
0.01 �0.91 0.62 0.22
0.4 0.3 0.5 0.43
0.77 0.02 0.45 0.11
0.54 0.0 0.34 0.87
Figure 2: Real-Coded Feature Mask
0.5 0.8 0.6 0.2
For GEFeS, in order to mask features, a masking threshold value of 0.5 is used as follows. If the value of a real-coded feature mask is less than 0.5, then the value corresponding to the real-coded feature mask is set to 0 (otherwise it is set to 1).
0 �1 1 0
0 0 1 0
1 0 0 0
1 0 0 1
1 1 1 0
Figure 3: Binary-coded candidate feature mask
Figure 5: Weighted Feature Set The computation of the fitness value for our GEFeS and GEFeW is shown in Equation 1. The objective of the evaluation function is to minimize the number of recognition errors (increasing accuracy) while reducing the number of features needed. As shown in Equation 1, the fitness returned by the evaluation function is the number of recognition errors encountered after applying the feature mask multiplied by 10 plus the percentage of features used. Fitness= (number of errors)*10 + %Features Used
(1)
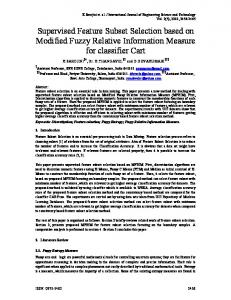
III. EXPERIMENT Four publicly available facial datasets were used for the multi-dataset GEFeS and GEFeW experiments. These datasets include FRGC, Face Recognition Technology (FERET), Essex, and Yale. For these experiments, a subset of each dataset with frontal images were used. The FRGC dataset used for this experiment was is composed of 840 images taken from 280 subjects. FERET dataset is composed of 787 images taken for 239 subjects, the Essex dataset consists of
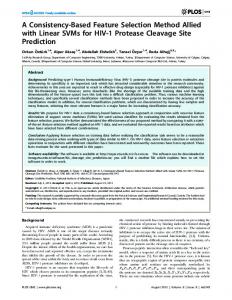
435 images taken from 145 subjects. The Yale dataset consists of 114 images taken from 36 subjects. Figure 6 shows five sample test images for each dataset used in the experiment. The first,, second, third, and fourth rows shows sample test set images from the FRGC, FRGC FERET, Essex, and Yale datasets respectively. processing stages Each image has been through the pre-processing such as eye rotation alignment, histogram equalization, equa resizing (225 x 195 pixels) and conversion of the images into greyscale. For all the datasets used,, the gallery contains two snapshots and the probe contains one snapshot per subject. The objective of GEFeS and GEFeW is to evolve feature mask and feature weight in an effect to improve accuracy while reducing the number of features needed for recognition purpose.
Eigen GEFeSSSGA, Eigen-GEFeSEDA, Eigen-GEFeW SSGA, EigenGEFeWEDA, and the baseline algorithm into equivalence classes. Table I shows the performance comparison of the five methods on our subset of the FRGC dataset. For FRGC dataset, the results show that Eigen-GEFe GEFeWSSGA and EigenGEFeWEDA significantly outperform the bbaseline method in terms of accuracy. Eigen-GEFeWEDA provides the best result in terms of accuracy though it uses almost tthe entire feature set. While Eigen-GEFeSEDA used only 49.58% of the features features, EigenfaceBaseline,, Eigen-GEFeSSSGA, and Eigen-GEFeSEDA fall in the same equivalent class with respect to accuracy. In general, the results indicate that EDA--based feature selection and weighting performs better than the corresponding SSGA. TABLE I EXPERIMENTAL RESULTS FOR EIGENFACE, EIGEN-GEFES AND EIGENGEFEW FRGC DATASET Method (for FRGC)
Figure 6: Sample images for datasets used in this experiment IV. RESULTS For our experiment, we will be comparing two instances of GEFeS (implemented using an SSGA and an EDA), and two instances of GEFeW (again, implemented using an SSGA and an EDA SSGA and EDA). The instances are as follows: Eigen-GEFeSSSGA, Eigen-GEFeSEDA, Eigen-GEFeW GEFeWSSGA, and Eigen-GEFeWEDA. The SSGA instances all have a population size of 20, Gaussian mutation rate of 1 and mutation range of 0.2. The EDA instances also had a population size of 20 individuals with elites size of 5 (25% of the population). Furthermore, they were each run a total of 30 times with a maximum of 1000 function evaluations. Our results are shown from Tables I to IV. In each table four instances are compared with the Eigenface method denoted as EigenfaceBaseline. The second column denotes the percentage of the average number of features used. The third and fourth columns represent the average and the best accuracy obtained, obtained respectively. ANOVA and t-Tests Tests were used to divide Eigen-
Average % Features Used
Average Accuracy
Best Accuracy
EigenfaceBaseline
100
87.14
87.14
Eigen-GEFeSSSGA
52
86.67
87.85
Eigen-GEFeWSSGA
88
91.42
92.5
Eigen-GEFeSEDA
49.58
87.05
88.21
Eigen-GEFeWEDA
98.33
93.19
94.64
Table II shows the performance comparison of the five methods on our subset of the FERET dataset dataset. The results indicate that Eigen-GEFeSSSGA and Eigen-GEFeSEDA instances fall into the same equivalence ence class in terms of accuracy. The percentage of features used for EigenEigen GEFeSSSGA and Eigen-GEFeSEDA is 51.79% and 44.88% 44.88%, respectively. The overall results of the four instances shown in Table II indicate that EDA-based based feature selection and weighting performs better than the corresponding SSGA. SSGA TABLE II EXPERIMENTAL RESULTS FOR EIGENFACE, EIGEN-GEFES AND EIGENGEFEW FERET DATASET Method (for FERET)
Average % Features Used
Average Accuracy
Best Accuracy
EigenfaceBaseline
100
75.31
75.31
Eigen-GEFeSSSGA
51.79
75.67
76.56
Eigen-GEFeWSSGA
88.59
77.59
78.24
Eigen-GEFeSEDA
44.88
75.72
76.99
Eigen-GEFeWEDA
98.14
78.91
79.91
Table III shows the performance comparison of the five methods on our subset of the ESSEX dataset. Once again Eigen-GEFeSEDA performs better than Eigen-GEFeSSSGA in terms of accuracy. However, the feature reduction of EigenGEFeSSSGA is significantly lower than Eigen-GEFeSEDA. Eigen-GEFeSSSGA used only 36.21% features. It reduces the features needed by approximately two thirds while obtaining better accuracy than the corresponding baseline method. Similar to the results reported for FRGC and FERET datasets, Eigen-GEFeWEDA provides the best result in terms of accuracy. In general, the results indicate that EDA-based feature selection and weighting performs better than the corresponding SSGA. TABLE III EXPERIMENTAL RESULTS FOR EIGENFACE, EIGEN-GEFES AND EIGENGEFEW ESSEX DATASET
Method (for ESSEX) EigenfaceBaseline
Average % Features Used 100
Average Accuracy 92.41
Best Accuracy 92.41
roughly uniform across the components histogram result of the distribution of feature selection experiment TABLE IV EXPERIMENTAL RESULTS FOR EIGENFACE, EIGEN-GEFES AND EIGENGEFEW YALE DATASET
Method (for Yale)
Average % Features Used
Average Accuracy
Best Accuracy
EigenfaceBaseline
100
100
100
Eigen-GEFeSSSGA
7.89
100
100
Eigen-GEFeWSSGA
64.07
100
100
Eigen-GEFeSEDA
6.22
100
100
Eigen-GEFeWEDA
67.63
100
100
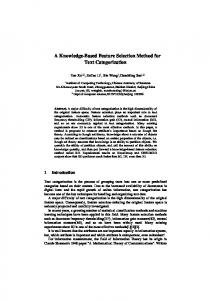
In other words, the experimental results show that EigenGEFeSSSGA and Eigen-GEFeSEDA does not necessary select those eigenfaces with greater eigenvalues. Notice that the Eigen-GEFeSSSGA 36.21 97.57 97.91 some Eigenfaces with smaller Eigenvalues can have a better feature contribution than some of the components with higher Eigen-GEFeWSSGA 95.77 98.06 98.32 eigenvalues. This indicates that being a principal component with higher eigenvalues does not necessary lead to better Eigen-GEFeSEDA 43.55 97.74 98.32 performance since some eigenfaces might capture unwanted information for recognition.. In other words, being a principal Eigen-GEFeWEDA 98.33 98.37 98.71 component with higher eigenvalues doesn’t necessarily make the eigenvector as candidate component for feature selection. Instead of relying on the eigenvalues, GEFeS selects those Table IV shows the performance comparison of the five components that have higher discriminatory power. This result methods on our subset of the YALE dataset. The baseline supports the work of Liu and Wechsler [22].Liu and Wechsler accuracy result is 100%. The aim of this experiment is to showed that PCA identifies the Most Expressive Feature, discover the percentage of features that are needed to produce which are not necessarily the most discriminatory features. the same accuracy as the baseline method (since the The overall result of comparing the SSGA and EDA performance of the baseline method is 100%). The results instances of GEFeS and GEFeW implementations indicates indicate that Eigen-GEFeSSSGA and Eigen-GEFeSEDA provide that EDA performs well in both reducing the number of a dramatic reduction in the percentage of feature usage. Both features required and providing improved accuracy. In most of the Eigen-GEFeSSSGA and Eigen-GEFeSEDA reduce the the results obtained, Eigen-GEFeSSSGA and Eigen-GEFeSEDA features needed by more than 90 percent. Eigen-GEFeW also reduced the features needed approximately by half. However, reduces the features needed considerably as compared to the both Eigen-GEFeWSSGA and Eigen-GEFeWEDA improve the FRGC, FERET, and ESSEX datasets. accuracy significantly while using more features than their Figures 7 through 10 show the percentage of Eigenface usage respective Eigen-GEFeSSSGA and EigenGEFeSEDA. In general, for the best accuracy of Eigen-GEFeSSSGA and Eigen- the FRGC, FERET, Essex, and Yale dataset based GEFeSEDA. The natural expectation for Eigenface based experimental results indicate that EDA instances of GEFeS systems is that the first few principal components (eigenfaces) and GEFeW GEFeS and GEFeW implementations perform with greater eigenvalues contain the most discriminatory better than the corresponding SSGA instances. features. However, as can be observed from the results presented in Figures 7 to 10, the histogram result the is
% Eigenface Usage for the best accuracy (GEFeS)-FRGC (SSGA) 100
90
80
70
60
50
Eigenface usage Histogram
40
30
20
10
1 13 25 37 49 61 73 85 97 109 121 133 145 157 169 181 193 205 217 229 241 253 265 277 289 301 313 325 337 349 361 373 385 397 409 421 433 445 457 469 481 493 505 517 529 541 553
0
% Eigenface Usage for the best accuracy (GEFeS)-FRGC (EDA) 100
90
80
70
60
50
Eigenface usage Histogram
40
30
20
10
1 13 25 37 49 61 73 85 97 109 121 133 145 157 169 181 193 205 217 229 241 253 265 277 289 301 313 325 337 349 361 373 385 397 409 421 433 445 457 469 481 493 505 517 529 541 553
0
Figure 7: Percentage usage of Eigenfaces in decreasing order of the eigenvalues Eigen-GEFESSSGA and Eigen-GEFESEDA for FRGC dataset
% Eigenface Usage for the best accuracy (GEFeS)-FERET(SSGA) 100 90 80 70 60 50 40
Eigenface usage Histogram
30 20 10
1 14 27 40 53 66 79 92 105 118 131 144 157 170 183 196 209 222 235 248 261 274 287 300 313 326 339 352 365 378 391 404 417 430 443 456 469
0
% Eigenface Usage for the best accuracy (GEFeS)-FERET(EDA) 100 90 80 70 60 50 40
Eigenface usage Histogram
30 20 10
1 15 29 43 57 71 85 99 113 127 141 155 169 183 197 211 225 239 253 267 281 295 309 323 337 351 365 379 393 407 421 435 449 463 477
0
Figure 8: Percentage usage of Eigenfaces in decreasing order of the eigenvalues Eigen-GEFESSSGA and Eigen-GEFESEDA for FERET dataset
% Eigenface Usage for the best accuracy (GEFeS)-Essex(SSGA) 100
90
80
70
60
50
40
30
Eigenface usage Histogram
20
10
1 9 17 25 33 41 49 57 65 73 81 89 97 105 113 121 129 137 145 153 161 169 177 185 193 201 209 217 225 233 241 249 257 265 273 281 289
0
% Eigenface Usage for the best accuracy (GEFeS)-Essex(EDA) 100 90 80 70 60 50 40
Eigenface usage Histogram
30 20 10
1 8 15 22 29 36 43 50 57 64 71 78 85 92 99 106 113 120 127 134 141 148 155 162 169 176 183 190 197 204 211 218 225 232 239 246 253 260 267 274 281 288
0
Figure 9: Percentage usage of Eigenfaces in decreasing order of the eigenvalues Eigen-GEFESSSGA and Eigen-GEFESEDA for ESSEX dataset
% Eigenface Usage for the best accuracy (GEFeS)-Yale(SSGA 100 90 80 70 60 50 40 30
Eigenface usage Histogram
20 10 0 1
3
5
7
9 11 13 15 17 19 21 23 25 27 29 31 33 35 37 39 41 43 45 47 49 51 53 55 57 59 61 63 65 67 69 71 73 75
% Eigenface Usage for the best accuracy (GEFeS)-Yale(EDA) 100 90 80 70 60 50 40 30
Eigenface usage Histogram
20 10 0 1
3
5
7
9 11 13 15 17 19 21 23 25 27 29 31 33 35 37 39 41 43 45 47 49 51 53 55 57 59 61 63 65 67 69 71 73 75
Figure 10: Percentage usage of Eigenfaces in decreasing order of the eigenvalues Eigen-GEFESSSGA and Eigen-GEFESEDA for YALE dataset
V. CONCLUSION AND FUTURE WORK Our results using GEFeS and GEFeW suggest that hybrid Genetic and Evolutionary Computation for feature selection/weighting enhances the overall performance of the Eigenface methods while reducing the number of features needed. When comparing the SSGA based instances with EDA instances, the EDA instances of GEFeS and GEFeW performed better both in terms of accuracy and feature reduction. Our future work will be devoted towards investigating the usage of GEFeS and GEFeW for other feature extraction algorithms such as LDA and EBGM. ACKNOWLEDGMENT This research was funded by the Office of the Director of National Intelligence (ODNI), Center for Academic Excellence (CAE) for the multi-university Center for Advanced Studies in Identity Sciences (CASIS) and by the National Science Foundation (NSF) Science & Technology Center: Bio/computational Evolution in Action CONsortium (BEACON). The authors would like to thank the ODNI and the NSF for their support of this research REFERENCES [1]
[2] [3]
[4] [5]
[6] [7]
[8]
[9] [10]
[11] [12]
[13]
[14]
[15]
D.C Hay and A.W. Young, “The human face, Normality and Pathology in Cognitive function”. A.W, Ellis London: Academic, pp. 173-202, 1982. Francis Galton, “Person Identification and description,” �ature, pp. – 173-177, June 21, 1888. Peter T. Higgins, "Introduction to Biometrics", The Proceeding of Biometrics consortium conference 2006, Baltimore”, MD, USA, Sept. 2006. K. Fukunaga., ”Introduction to statistical pattern recognition,” Academic Press,1990. M.Kirby and L.Sirovich, “Application of the Karhumen Loeve Procedure for the characterization of human-faces,” IEEE Trans. Pattern Anal. And Mach.Intell., Vol.12,�o.1 pp.103-108, 1990. M. Turk and A. Pentland, "Eigenfaces for recognition", Journal of Cognitive �euroscience, Vol. 13, No. 1, pp. 71-86, 1991. Tamirat Abegaz, Joshua Adams, Khary Popplewell, Joseph Shelton, Kelvin Bryant, Gerry Dozier, Karl Ricanek, Damon L. Woodard” “Hybrid GAs for Eigen-Based Facial Recognition”, accepted for IEEE J. Phillips, H. Moon, S. Rizvi, and P. Rauss, “The FERET Evaluation Methodologyfor Face-Recognition Algorithms,” IEEE Trans. Pattern Anal. and Mach. Intel., vol. 22, no. 10, pp. 1090–1104, October 2000. National Institute of Standards and Technology.”The Color FERET Dataset. “,http://face.nist.gov/colorferet/, Visited on �ov 06, 2010. P. Jonathon Phillips1, Patrick J. Flynn2, Todd Scruggs3, Kevin W. Bowyer2Jin Chang2, Kevin Hoffman3, Joe Marques4, Jaesik Min2, William Worek3,” Overview of the Face Recognition Grand Challenge”, IEEE Conference on Computer Vision and Pattern Recognition, 2005. http://www.frvt.org/FRGC/, Visited on Jan.46, 2111. Zuang-Chih Lee, Jeffrey Ho, David Kriegman,”Acquiring Linear Subspaces for Face Recognition under Variable Lighting”, IEEE Transactions on pattern analysis and machine intelligence, vol. 27, NO. 5, May 2005. M. L. Tinker, G. Dozier, and A. Garrett, “The exploratory toolset for the optimization of launch and space systems (x-toolss),” http://xtoolss.msfc.nasa.gov/, 2010. Peter T. Higgins, "Introduction to Biometrics", The Proceeding of Biometrics consortium conference 2006, Baltimore”, MD, USA, Sept. 2006. J. Adams, D. L. Woodard, G. Dozier, P. Miller, K. Bryant, and G. Glenn. Genetic-based type II feature extraction for periocular
[16]
[17]
[18]
[19]
[20]
[21]
[22]
biometric recognition: Less is more. In Proc. Int. Conf. on Pattern Recognition, 2010. to appear. Huang C. L. and Wang C. J. “GA-based feature selection and parameters optimization for support vector machines”,. C.-L. Huang, C.-J. Wang / Expert Systems with Applications. Vol. 31(2), 2006, pp231–240. Adams, J., Woodard, D. L., Dozier, G., Miller, P., Glenn, G., Bryant, K. "GEFE: Genetic & Evolutionary Feature Extraction for PeriocularBased Biometric Recognition," Proceedings 2010 ACM Southeast Conference, April 15-17, 2010, Oxford, MS. Dozier, G., Adams, J., Woodard, D. L., Miller, P., Bryant, K. "A Comparison of Two Genetic and Evolutionary Feature Selection Strategies for Periocular-Based Biometric Recognition via XTOOLSS,", Proceedings of the 2010 International Conference on Genetic and Evolutionary Methods (GEM'10: July 12-15, 2010, Las Vegas, USA). Simpson, L. , Dozier, G., Adams, J., Woodard, D. L., Dozier, G., Miller, P., Glenn, G., Bryant, K.. "GEC-Based Type-II Feature Extraction for Periocular Recognition via X-TOOLSS," Proceedings 2010 Congress on Evolutionary Computation, July 18-23, Barcelona, Spain. Dozier, G., Bell, D., Barnes, L., and Bryant, K. (2009). "Refining Iris Templates via Weighted Bit Consistency", Proceedings of the 2009 Midwest Artificial Intelligence & Cognitive Science (MAICS) Conference, Fort Wayne, April 18-19, 2009. D. M. Blackburn, J. M. Bone, and P. J. Phillips, “Facial Recognition Vendor Test 2000 Evaluation Report,” February 2001 . C. Liu, H. Wechsler, “Evolutionary pursuit and its application to face recognition”, IEEE Trans. Patt.Anal. Mach. Intell. 22 (6) (2000) 570582.