as "the continuous process of measuring products, services, and practices against the .... introduction to the DEA method and its applications to management ac-.
JMAR Volume Ten 1998
Standard Estimation, Standard Tightness, and Benchmarking: A Method With an Application to Nursing Services Rajiv D. Banker University of Texas at Dallas Hsihui Chang National Chengchi University Somnath Das University of Illinois at Chicago Abstract: This paper presents a new method for estimating standards. Prior accounting research suggests the need for flexibility in setting standards in order to allow managers to make trade-offs between efficiency and attainability, and also between inputs with different relative prices to minimize cost. Stochastic Data Envelopment Analysis (SDEA) is adapted to introduce flexibility in setting standards and deriving mix and yield variances relative to comparative data from historical records or from other organizations. This approach to relative performance evaluation and benchmarking has practical appeal since industry-level data is increasingly being shared, for example, in the health care sector. Hospital nursing cost data is used to illustrate this approach.
Standard setting for performance evaluation and control purposes has reeeived considerable attention in management aeeounting research. The process of estimating standards, however, has received seant attention. Textbook treatment is typically sketehy and assumes that the production function is known or can be determined using industrial engineering techniques such as time and motion studies. Implicit in such methods is the assumption that the production technology is linear and separable (Christensen and Demski 1995; Darrough 1990). In this paper, we present a Stochastic Data Envelopment Analysis (SDEA) model to estimate standards from comparative historical or benchmarking data (Banker 1993).^ ' Conventional DEA models, tn estimating the production frontier which provides the standard relative to which the performance of all units is measured, require atl variations from the frontier to lie only on one side, representing input usage greater than the minimum due to chance or tnefficiency In operations. By introducing variations on both sides of the frontier, such as those caused by random factors attributable to model specification or measurement errors, SDEA allows evaluators and standard setters of Individual units in the benchmark cohort, the opportunity to ex ante specify the likelihood of achieving the standard. The authors thank two anonymous reviewers and Mike Shields (the editor)for their comments and suggestions, and Ms. Viki Ardito, Acting Vice President of Patient Care Services at Alta Bates Medical Center in Berkeley, California and Ms. Helen B. Ripple, Associate Director of Medical Center and Director oJ Nursing at Mqffitt Hospital, University oJ California, San Francisco, Jor access to inforrruxtion on hospital operations and industry practice.
134
Journal of Management Accounting Research, 1998
The SDEA approach allows for the possibility of a nonlinear nonseparable relation between input eosts and outputs produced, relaxing assumptions implicit in industrial engineering methods. We also illustrate how mix and yield variances may be computed relative to such an estimated production technology to enable managers to assess the trade-offs inherent in the use of different inputs. A question of interest is the tightness of standards. The extant evidence suggests that tight standards enhance performance (Chow 1983); however, if the standards are too tight, job stress increases, leading to lower performance (Shields et al. 1998). Recently, organizations have been benchmarking their performance relative to comparative data from other organizations (Evans et al. 1997). The American Productivity and Quality Center defines a benchmark as "a measured *best-in-class' achievement recognized as the standard of excellence for that business process" (Andersen and Pettersen 1996).^ Thus, benchmarking entails comparison with the "best in the field." rather than some average target. If used as a standard, such as "best in the field," a benchmark may be perceived to be too tight, resulting in lower performance. It is important, therefore, to develop a procedure to estimate standards based on comparative data in a fashion that affords managers the fiexibility to adjust the tightness of the standards. Additionally, even where fiexible standards can be set using conventional methods, a simple benchmarking approach that considers each input separately does not reflect the opportunity for trade-offs among various inputs. The model presented in this paper addresses these benchmarking and standard-setting issues. Development of useful standards for performance evaluation and control is a problem faced by many organizations. The Tax Equity and Fiscal Responsibility Act of 1982 changed the reimbursement of hospital Medicare costs from a "cost plus" basis to a "comparative" cost basis. Access to information on relative hospital performance has also increased in recent times.^ This has enabled Kroger Company and several other organizations to evaluate relative performance and determine "who provides the most cost-effective and highest quality care" [Wall Street Journal 1993). As a result, considerable pressure exists now for hospitals to benchmark their performance relative to other hospitals. Hospital managers we interviewed for this research indicated that efficient use of nursing personnel is an important goal because nursing services comprise the largest single component of hospital costs. Nursing labor costs comprise over half of total hospital costs (American Hospital Association 1987). Because of a severe shortage of nurses in the late 1980s, salaries of nurses with 20 years experience has more than doubled in the United States over the past ten years (Kunen 1996). In addition to the importance of controlling nursing costs, comparative data are readily available for the nursing departments of hospitals (Carr 1993), Therefore, David T. Kearns, chief executive officer of Xerox Corporation, also defines benchmarking as "the continuous process of measuring products, services, and practices against the toughest competitors or those companies recognized as industry leaders" (Camp 1989). At present there are eight states that have approved health care data coilection arrangements that gather demographic, diagnosis, physician, procedure, payer, fee and other information. Iowa. New York, Pennsyivania and Wisconsin publish both comparative health care cost and comparative information collected as a result of mandated disclosures.
Banker, Chang and Das
135
we illustrate our approach using nursing services. We focus on cost minimization and control, and consider relatively few inputs and outputs for the nursing department to keep the illustration simple. However, the approach described in this paper is general and can be applied to other organizations. TTie remainder of the paper is organized as follows. The next section reviews prior research on standard costs and variance analysis. Section three describes the proposed method for estimating standards and evaluating variances. In section four, we illustrate the approach in the context of nursing services. Finally, section five summarizes the contribution of this paper and its conclusion.
RESEARCH ON STANDARD COSTS AND VARIANCE ANALYSIS Tightness of Standards Most cost and management accounting textbooks (for example, Atkinson et al. 1997) prescribe standards that are "efficient and attainable." There is considerable research supporting the use of "efficient" standards. Chow (1983) and Waller and Chow (1985) present experimental evidence that job standard tightness induces higher effort and consequently a higher performance level. Locke and Latham (1984) and Hollenbeck (1987), among others, find that difficult goals often lead to higher task performance than easy goals. However, there is also considerable evidence suggesting that "attainability" is important in setting standards. In a field study. Merchant and Manzoni (1989, 556) find that budget targets are achieved in about 80-90 percent of the cases they examine and suggest "that budget achievability is an important organizational controlsystem variable." In a study of Japanese automobile engineers. Shields et al. (1998) find that if targets are not attainable, job stress increases and performance declines. Thus, two opposite prescriptions result from the research on tightness of standards. On the one hand, there is a need to set tight standards to motivate agents to strive for superior performance. On the other hand, setting tight standards can result in lower performance due to job stress. It is important, therefore, that managers have the fiexibility when setting standards to make trade-offs between tightness and attainability, consistent with organizational goals and context. Cost Variance Analysis Mix variances and yield variances provide valuable information when there are multiple inputs that can be substituted for each other. Consider, for example, the use of nursing professionals in the production of health care services. Registered nurses can be substituted for licensed nurses, or vice versa. Senior hospital managers we interviewed informed us that managers of specific wards often reassign registered nurses and licensed nurses from one shift to another within a 24-hour period in order to optimize resource utilization within their budget constraints. Such substitution may be a rational response to changes in input prices or to changing workloads, or it may indeed be attributable to inefficient management of resources. Textbook analysis of mix and yield variances is based on the assumption that inputs are consumed only in fixed proportions (Wolk and
136
Journal qf Management Accotmting Research. 1998
Hillman 1972; Hasseldine 1967; Petes 1986). Mensah (1982) and Marcinko and Petri (1984) consider more general production possibilities by allowing for input substitution and incorrect estimation of input prices, respectively. Barlev and Callen (1986) and Darrough (1990) examine the relation between optimal input standards and input prices, technology and output level. A limitation of their parametric approaches is that the estimated efficiency measures depend on the assumed production function (Callen 1991). The validity of the assumed production function is an essential determinant of the validity of the standards and the variances derived from it. PROPOSED METHOD FOR ESTIMATION OF STANDARDS Standards are typically set based on past experience or an industrial engineering study. The use of comparative cost data from peer organizations provides an alternative approach to standard setting. For example, in the health care sector, cost data across different hospitals are collected by and are available from various governmental agencies. Senior hospital managers we interviewed indicated that health care organizations in a region are increasingly sharing cost data on a per patient and per case basis. These data are used for benchmarking the performance of individual units. Data Envelopment Analysis Data Enveiopnienl Analysis (DEA) provides a nonparametric representation ofthe input-output production correspondence (Banker et a!. 1984). It has the advantage of imposing minimal structure on the production frontier consistent with observed data (Banker and Maindiratta 1988). The regularity conditions include monotonocity and convexity. The production possibility set is represented by T = {(Y, X)| the outputs Y can be produced from the inputs X}, where Y is a vector of outputs and X is a vector of inputs. Monotonocity implies that if (Yp Xj) e T. Xj > X, and Y2 s Yp then (Y2, X2) E T: that is, less outputs can always be produced from more inputs. Convexity implies that if (Yp X,) G T and (Y2, X^] £ T, then (KYi + (1-X)Y2, \X, + {1-\]X^ e T for all 0 < \ < 1; that is, a production possibility obtained by interpolating two observed feasible possibilities is also feasible. The production frontier is the efficient boundary of this production possibility set. Banker et al. (1989) show this method to be particularly well suited for relative performance evaluation across a crosssection of health care organizations. Callen (1991) provides an introduction to the DEA method and its applications to management accounting. Banker (1993) characterizes the statistical properties of the DEA estimator of an organization's efficiency measured relative to the "best practice" frontier gmd proves that the DEA estimator is consistent and maximizes likelihood. Bogetoft (1994) shows that the DEA efficiency measure is optimal for relative performance evaluation in a multi-agent moral hazard model when the production possibility set is monotone and convex. Stochastic Data Envelopment Anatysis DEA uses the "best practice frontier" as the standard relative to which performance is measured. It allows for deviations only on one side of the frontier—the side that represents less output generation or more input
Banker, Chang and Das
137
consumption than the best practice due to unfavorable random conditions or due to inefficiency in operations. That is, DEA yields best practice targets which, although "efficient," may be almost impossible to "attain" by a given organization being evaluated relative to a benchmark group. Stochastic Data Envelopment Analysis (SDEA) extends DEA by allowing for random effects such as measurement errors or uncontrollable factors that may cause deviations on either side of the efficient production frontier Specifically, the SDEA model adds a parameter that weights deviations beyond the best practice frontier relative to those on its inefficient side.'' The fiexibility of the SDEA approach to choose how much relative weight to place on deviations on the two sides of the estimated production function, allows managers to make the trade-off between tightness and attainability of the benchmark. The basic objective is to determine the production frontier that represents an efficient and attainable standard relative to which an organizational unit can measure its performance. The SDEA model is represented as a linear programming problem minimizing the weighted sum of deviations inside and outside the production frontier that are estimated from the observed comparative data for j = 1 n organizations. The frontier is computed based on available observations without imposing any other assumptions about the specific underlying functional form of the input-output correspondence.^ n
Minimize 2 7Uj + (1 - 7)Vj
(1)
subject to: K
S &— 1
1
|yj
y
2
j Xj, j, - X^,) - (Vj - V^) + (Uj - U^) > (Xji - X^,)
1—2
Vj.m = 1 Wji,,
Zjp
Uj, Vj >
n 0
where yj^ is the quantity of output k for organization j . Xj, is the quantity of input i for organization j . ^ The Vj represent deviations outside the frontier. These result from favorable random effects, such as model specification and measurement errors, net of deviations in the other direction due to inefficiency or unfavorable random conditions. Similarly, the u, represent net deviations inside the frontier. These may result from random effects or inefficiencies or both.^ The n(n - 1) constraints for j . m = 1 n. '' An alternative is to use the parametric stochastic frontier estimation technique to arrive at benchmark cost standards (Aigner et al. 1977). This parametric approach, however, imposes assumptions different from basic regularity conditions, and estimated functions often violate those conditions (Caves and Christensen i980). Furthermore, it does not provide flexibility in specifying the degree of attainability. See Dopuch and Gupta (i997) for an application of tliis approach to public school expenditures in Missouri. ^ If additional a priori information is available about the input-output correspondence then the estimation of the model can be modified appropriately to reflect such information (Banker 1992). ^ Please refer to appendix A for a glossary of all symbols used in this paper. Observe that the constraint for j = m is obviously redundant as both sides are identically equal to zero. ' This assumption is consistent with an assumption common in stochastic production frontier estimation (Aigner et al. 1977; Forsund et al. 1980) that inefficiency distribution is onesided while other random factors causing deviations in observed output are symmetrically distributed about zero.
138
Journal qf Management Accounttng Research. 1998
j T^ m, in the linear program (1) ensure that after we adjust the observed Xjj* = Xji - Uj + Vj, j = 1 n, the resultant n points (Yj, X*j), where Yj - (yii,---.yjk) and X*j = (x*ji, X]2,...,x,,), lie on the boundary of a monotone and convex production possibility set. The objective of the programming problem is to find points (Yj, X*j) that minimize the weighted sum of deviations Uj and Vj, while satisfying the constraints to ensure that the estimated production set is monotone and convex." We require that 0 < -y ^ i. This is the parameter specified ex ante to represent the relative weight on deviations on the two sides of the frontier and reflects the ex ante likelihood of attaining the targets implied by the estimated standards. Observations j with optimal Uj* = Vj* = 0 are on the estimated production frontier and are represented by the set denoted Rl-v). The value of y has a useful interpretation: 100 y represents the ex ante expected percentage of observations outside the estimated production frontier (Koenker and Bassett 1978; Bassett and Koenker 1982). Specifically, for -y = 0.5, a median function is estimated with equal probability of an observation lying Inside or outside the estimated production frontier. In this case, all deviations from the frontier may be attributed to an assumed symmetric random error and none to inefficiency in production.^ For SDEA to be properly implemented, careful attention must be given to the definition and measurement of inputs and outputs, the specification of the appropriate functional relationships between inputs and outputs and robustness of results to infiuential observations. "^ Computationally, it is easier to solve the dual formulation as it has fewer constraints when the number of observations n > K + I + 3. This dual linear program is given in appendix B. Previous applications of SDEA have focused on assessing the robustness of inferences about factors influencing productivity. Banker et al. (1987) assess changes in input usage due to a regime shift caused by implementing a gain-sharing contract among workers. Banker etal. (1991) identify variables that impact the productivity of software maintenance projects. The objective behind the use of SDEA in these studies was to ensure that their results were not sensitive to the possibility of measurement error in the data. In contrast, the primary contribution of this paper is in adapting SDEA to provide managers the flexibility in setting the tightness of standards for relative performance evaluation. Intuitively, for the one-input one-output case, observe that the constraints require that (yj - y^)/(Xj* - x^*) ^ 1/W|. where x,* = Xj * u, + v, and x^* = x^ - Un, + v^. That Is. the slope of the chord joining the points j and m is greater than the slope 11 / Wj) of the production frontier at tlie point. This property characterizes the boundary of a monotone and convex set. The general result for the multiple-input multiple-output case follows from a similar supporting hyperplane theorem for convex sets. For any data set. \iy s l / n then Vj* = 0 for allj and all estimated deviations are attributed to inefficiency or unfavorable random conditions as in the usual DEA model. This is a maintained assumption based on the best a priori information that is available. For example, if we knew a priori, that there is no random influence, then we could model this by setting -y ^ l / n . Alternatively, if it were knoun a priori that all the units in a sample are efficient but they are subject to symmetric random shocks, then we could model this by setting 'I' = 0.5. and attribute equal weights to deviations on both sides. Of course, as in any econometric analysis, if the maintained assumptions are not valid then the properties of the estimators are distorted. ° See Cooper et al. (1996) for a detailed discussion of some limitations of the DEA approach.
Banker, Chang and Das
.
/
139
Mix and Yield Variance Ratios In order to construct ratio measures of yield and mix variances based on the production frontier estimated using SDEA, we proceed as follows. The lowest cost C* (Y^,, P^) to produce the outputs Y^. given the input prices Pp for the organization indexed "o," based on the benchmark set R(7) is estimated using the following linear program (Banker and Maindiratta 1988): I
C* (Y^.PJ = Minimize 2 Po. x, r
,
•
(2)
1 = 1
• •.
subject to:
k = 1
\ j . X, >
K
0
This linear program identifies the cost minimizing inputs x, that can produce the outputs Y^ for the organization indexed "o." The input possibilities are determined with reference to the observations j G R(7) that lie on the estimated production frontier. Since the production set is monotone and convex, we search over the set of all convex combinations: l(SjeR(^i ^Y,, SjgR(^|\jXj)|2jeR(.^, Xj = 1] of the observation in R(7) that produce as great an output as Y^, . The objective function in linear program (2) ensures that the Input cost to produce this output is minimized, given the input prices po,. The total cost variance ratio (TCVR^,) for the organization indexed "o" is then measured as:
where 2{=i PoiX^, is the actual cost for organization "o" and x,* are the cost minimizing inputs x, solving the linear program (2). This ratio is analyzed into two components: yield variance ratio (YVR^,) and mix variance ratio (MVR^,). The yield variance ratio is estimated using the Banker et al. (1984) model relative to the benchmark set R(7) as follows: = Minimize h^,
(3)
subject to:
— Yok
This linear program identifies the smallest quantities of the inputs Xj that are sufficient to produce the outputs Y,,. keeping the input proportions (mix) the same as the observed proportions in X^,. As in the previous linear
140
Journal qf Management Accounting Research. 1998
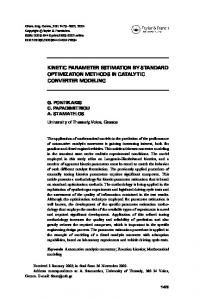
program, input possibilities are determined with reference to the observations j G R(7). The constraints are similar to those in the previous program as we search over all convex combinations of the observations in R(7). The objective function in linear program (3) ensures that the maximum proportionate reduction possible in the inputs is identified. The mix variance ratio can now be obtained as MVR^ = TCVR^ / YVR^,. Depending on the value of 7. we have different values for the mix, yield and total cost variance ratios. We use figure 1 to illustrate these measures. The two axes represent the two inputs (X^ and X^) used in production. Let RR' represent the relative price (isocost) line and let C^ be the actual observed cost for point A. representing a given output level Y with corresponding inputs usage (X^^. X^^), respectively. Let PESP' be a production isoquant such that it is the lower bound of the set of all input combinations that produce at least output level Y. Then the coordinates at the point E represent the cost minimizing input combinations (X^E. Xf^) with a resulting overall optimal cost of CE- The total cost variance ratio is defined as OT/OA. which is the ratio of optimal cost (Cg) to actual cost (CJ: OT _ OT^ OS OA " OS OA* The component of the total variance given by OS / OA. which measures how far the firm is inside the isoquant, is used to measure the yield variance ratio. The term OT/OS refiects the higher cost due to sub-optimal mix of inputs and is used to measure the (input) mix variance ratio. Thus, the total cost variance ratio Is represented as the product of the yield variance ratio (OS/OA) and mix variance ratio (OT/OS). ILLUSTRATIVE APPLICATION TO NURSING SERVICES We focus on the cost minimization and control problem in the nursing department of a hospital. For parsimony and expositional convenience in this illustration, we assume that in the hospital production function, the productivity of nursing inputs is separable from other inputs such as laboratory, dietary services, patient monitoring equipment and physician inputs. However, within the nursing department, we specificcilly allow for substitutions among different types of nursing inputs. Indeed, one of the benefits of the DEA and the SDEA models over traditional approaches to standard setting is the ability to allow for input (and output) substitutability or separability based on available a priori information (Banker 1992). Specification of Inpnts and Ontpnts The focus of much of prior empirical research on performance evaluation in the health care sector has been on examining the aggregate efficiency of entire hospitals rather than of individual services or departments. With the exception of Byrnes and Valdmanis (1989) and Morey et al. (1990), most prior studies have evaluated the overall productive efficiency without examining the mix and yield components. Also, most prior research has used parametric functional forms to estimate hospital production functions. In contrast. Banker et al. (1986). Banker et al. (1989), Capettini et al. (1985), Grosskopf and Valdmsinis (1987) and others have used Data Envelopment Analysis (DEA). •
Banker, Chang and Das
141
FIGURB 1
ninstration of Total Cost Variance Ratio RR' PESP'
Yield Variance Ratio
= OS/OA
Mix Variance Ratio
= OT/OS
Relative Price Line Production Frontier
Total Cost Variance Ratio = OT / OA = (OS/OA)*(OT/OS)
Most hospitals employ different types of nurses and nursing assistants, such as registered nurses, licensed nurses, apprentice nurses and unlicensed assistants, each of whom has a different wage rate and skill set. A hospital is interested in the lowest cost combination of the various
142
Journal qf Management Accounting Research. 1998
categories of nurses that provides the required level of service at the desired levels of quality. Quality considerations preclude the use of apprentice and unlicensed assistants for regular nursing tasks (Kunen 1996). Moreover, a registered nurse cannot be completely replaced by a licensed nurse. Licensed nurses cannot administer intravenous injections, make patient assessments and perform other higher skill tasks that only registered nurses can. However, to the extent licensed nurses are substitutable for registered nurses, the hospital manager may be able to lower nursing department costs by employing lower wage nurses. Prior research studies on hospital cost have used several measures of hospital output. For example. Tatchcll (1983) used the case mix approach. More recently, diagnostic related groups (DRGs). a variation of the case mix approach is used in some studies. However, there are more than 400 DRGs. which makes it difficult to perform statistical analysis with limited observations. A more detailed review and discussion of the measurement of hospital outputs is provided in Tatchell (1983) and Banker et al. (1989). In this paper, we illustrate the SDEA approach using total weighted inpatient days as a measure of output, where the weights indicate the a priori assessment by hospital professionals of different expected loads of demand for nursing services depending on the severity of individual components of the case mix. Each hospital functions within its own externally determined environment and. to some extent, certain factors affecting the efficiency of the hospital may be uncontrollable by the manager. When hospitals in a reference group do not all have the same set of external constraints, such factors need to be incorporated Into the benchmark cost variance analysis. For example, the proportion of elderly patients (over 65 years) served by a hospital leads to lower operating efficiency, but it is often among the factors which are beyond the control of the hospital manager (Pauly and Drake 1970). Therefore, we measure hospital output with two separate variables, one measuring older patient days and another measuring the remaining patient days. Thus, our model comprises two inputs: registered nurse hours (RNH) and licensed nurse hours (LNH) and two outputs: elderly patients days (EPD) and other patient days (OPD). The objective of this paper is to illustrate the SDEA approach and not to measure the performance of the sample hospitals or to present policy inferences about the sample. Hence, we do not use a broader range of inputs and outputs. For example, one could use DRGs as outputs, but that merely complicates the setting without providing any additional intuition about the benefits or limitations of the proposed method. Moreover, we have introduced one form of patient mix control with the output measure for older patient days, to illustrate how the method deals with multiple outputs. The proposed method thus allows the possibility of incorporating a diverse set of inputs and outputs as well as more control variables. Description of Data We illustrate our approach using Medicare audited data from 66 government-supported hospitals located in one state. Teaching and charitable
Banker. Chang and Das
143
hospitals are excluded from the analysis. Data related to Inpatient-days, wage rates and nursing-hours for registered and licensed nurses are available from audited cost reports. Table 1 provides descriptive statistics for this data set. For example, the average wage rate for registered nurses is 67 percent higher than that for licensed nurses. Empirical Observations Initially, the estimates of mix and yield variance ratios for the entire sample are examined. Table 2 presents the distribution of the ratio measures for yield (panel A), mix (panel B) anri total (pane! C) variances, corresponding to different levels of 7. As the value of 7 increases from 0.01 to 0.5, the yield variance ratios and total variance ratios increase while the mix variance ratios decrease. This increase in the yield variance ratio is expected because increasing the value of 7 increases the penalty weight on deviations attributed to yield inefficiency, which is minimized in the SDEA program. The correlation matrix for yield variance ratios in panel A of table 3 shows that these scores are very highly correlated for each of the six different values of 7 and suggests that the relative value of a hospital's yield variance ratio is robust to the choice of the parameter 7. Similarly, the mix variance ratios are also very highly correlated across riifferent values of 7, as shown in panel B of table 4. Although not reported here, similar correlations are observed for the total cost variance ratios as well. We note that while the relative values of variance ratios are robust to the choice of 7, the targets or estimated standards themselves are different. To verify that the variance ratios are independent of the output mix, we present in table 4 the correlation between the variance ratios and the proportion of elderly patient days serviced by a hospital. For each of the six values of 7, both Pearson anri Spearman correlations are not significant at conventional levels of significance. This suggests that once we control for the differences in the levels of the two outputs in estimating the relation between inputs and outputs, the resulting variance ratios do not depend on the differences in output mix across units. Our earlier empirical finding of a decrease in the mix variance ratio with an increase in the value of 7 (table 2) does not follow from any a priori theoretical analysis. To explore this further, we examine the relation between the level of 7 and the ratio of the optimal relative inputs to the actual relative inputs. These results reported in table 5 indicate that the ratio is increasing in the value of 7. i.e., when we place relatively less penalty on deviations outside the production frontier, the optimal ratio of RNs to LNs (given their wage rates) increases relative to the actual observed ratio. This implies that the relative productivity of RNs is estimated to be higher for higher values of 7. Therefore, hospitals should use more of the RNs than the LNs for higher values of 7 than for lower values. The sensitivity of the production frontier to the values of 7 is illustrated in figure 2. We fix the output levels at their median values and then plot six production functions, corresponding to the six values of 7. As the value of 7 increases, the production isoquant moves outward (away from the origin) as expected, because increasing the value of 7 implies that more of the deviations are
144
Journal qf Management Accounting Research, 1998 in
X ^ X CO CO
CO -H ,-. ^ CO ^ ^ 01 X CO CO i n CN CO
X X ^
tn
o
•=}• d i n >—
CO
05 X (N
IN
IN