Proceedings of the 2013 Winter Simulation Conference R. Pasupathy, S.-H. Kim, A. Tolk, R. Hill, and M. E. Kuhl, eds
STARTUP METHODOLOGY FOR PRODUCTION FLOW SIMULATION PROJECTS ASSESSING ENVIRONMENTAL SUSTAINABILITY Tobias Dettmann Clas Andersson Jon Andersson Anders Skoogh Björn Johansson
Per-Olof Forsbom Manufacturing Engineering Office Dept. 109620, Volvo Car Corporation SE-541 36 Skövde, SWEDEN
Product and Production Development Chalmers University of Technology SE 412 96 Gothenburg, SWEDEN ABSTRACT Environmental impact assessments for companies and products are important to increase sales and reduce environmental impact. To support improvements and detailed analyses, researchers have extended the use of simulation of production flows to include sustainability performance indicators. The research cases performed until recently lack standardized methodology and thus have comparability issues and an increase number of common faults. By using a common methodology and gathering best practice, future cases can gain a lot. Especially noted by the authors is that the project startup phase is critical for success. This paper proposes a methodology to support the startup phases of simulation projects with sustainability aspects in production flows. The methodology is developed and applied in an automotive industry study presented in this paper. Using a rigid project startup, such as the proposed methodology, reduces iterations during modeling and data collection and decreases time spent on modeling. 1
INTRODUCTION
There is a trend in companies' management to augment the importance of sustainability in strategy agendas (Kiron et al. 2012). Close to all companies in Kiron’s study thought sustainability is an important factor in their strategies to be competitive. Strategies are important, however, the company must implement and spread the ideas down the organization. The individual functions in an organization need tools to analyze sustainability aspects as companies take a larger responsibility for a sustainable future. Environmental sustainability is one of the core aspects of sustainability. This paper targets the use of Discrete Event Simulation (DES) to analyze a manufacturing system's environmental impact. Multiple research results have shown that using DES to analyze environmental impact has large potential to provide detailed analyses and future state analyses in manufacturing industry (Widok, Wohlgemuth and Page 2011, Andersson et al. 2012a). The approach has been developed and tested during the latest decade but is still in need of development (Andersson et al. 2012a). The main problems are that no commercial tools support environmental analysis in DES (Thiede et al. 2013), data management takes significant time (Andersson et al. 2012b) and there is a lack of structured methodologies and methods (Andersson et al. 2012a). The research project EcoProIT (www.ecoproit.com) aims to develop methods and tools to enable environmental impact analysis using DES. The research front currently focuses on development of tools and methods. Previous research projects have developed a few research tools. Heilala et al. (2008) presented the SIMTER software, which can an
978-1-4799-2076-1/13/$31.00 ©2013 IEEE
1926
Dettmann, Andersson, Andersson, Skoogh, Johansson, and Forsbom alyze multiple aspects of sustainability including ergonomic, environmental impact and economic aspects. Herrmann et al. (2011) developed a generic interface to analyze energy consumption. Successful simulation projects rely on a structured methodology. To perform sustainability assessments and publish their results, it is required to show a structured working procedure. This paper is part of the research project EcoProIT. The research project develops a complete methodology for such simulation projects. The purpose of the methodology is to support simulation engineers to structure the projects and provide helpful experiences for robust modeling, verification, validation, and analysis of the models, using structured modeling and transparent code. Previous presented methodologies as Reinhard et al. (2011) and Jimenez et al. (2013) used a standard Life Cycle Analysis (LCA) approach, but substituted parts of the life cycle inventory (LCI) modelling with dynamic simulations. However, a review of used methodologies for such cases in Andersson et al. (2012a, 2012b) shows that needs during the project start-up differ compared to a normal LCA method. The target application for the intended methodology is detailed modelling of manufacturing systems where the simulation engineer can impact a limited part of a product's life cycle. The production engineers that use the results want detailed information on how they can improve their area of the production flow and processes. Thus, the approach needs to handle a different need for data requirements, prioritization, and ability to focus on critical and interesting parts. The aim of this paper is to provide a structured methodology for the start-up of simulation projects analyzing the environmental impact and productivity of a manufacturing company. The methodology contains experiences and guidelines to support successful projects. This paper starts with a short summary of LCA, followed by a description of the research method. The next part develops an initial methodology and describes its application in an industrial environment serving as a study object. Then the experiences from methodology application are analyzed and the outcomes are presented as a detailed methodology. The end of the paper contains a discussion and conclusion that summarize the outcomes. 2
LIFE CYCLE ASSESSMENT
Life cycle assessment is a method to assess a product's or a service's environmental impact. The International organization for standardization (ISO) has defined and standardized LCA in ISO 14040 and 14044. It consists of 4 parts: Goal and scope definition to define the project, life cycle inventory (LCI) to sum up and allocate emissions to a product or service, life cycle impact assessment (LCIA) to assess the environmental impact for those emissions and resource usage, and interpretation to give recommendations to the commissioner of the project. This project focuses on the startup of a simulation project, which relates to the LCA goal and scope phase. During the goal and scope phase, the commissioner transforms the purpose and goal of the study to information to constrain the study. The information that needs to be processed is the goal of the study, purpose, intended audience, whether the study is comparative or accounting, the functional unit, system boundaries, assumptions and limitations, allocation methods, data requirements and chosen impact categories. For deeper insight in LCA read Baumann and Tillman (2004). 3
METHOD
The focus for the development is to help simulation experts avoiding pitfalls by guiding them to do right modeling decisions early. Previous studies and experiences, documented in Andersson et al. (2012a, 2012b), are the basis to develop an initial methodology approach, described in section 4. The methodology practitioners apply this initial concept during their study and continuously document, evaluate, and discuss experiences from the study with the researchers. The team uses outcomes from those discussions to further develop and specify the methodology. The result is a detailed methodology proposal based on experiences of the study and previous studies. Figure 1 visualizes the research approach.
1927
Dettmann, Andersson, Andersson, Skoogh, Johansson, and Forsbom
Inital methodology based on previous experience
Apply initial methodology
Methodology proposal
Figure 1: Research approach For experienced simulation engineers it is important to highlight important parts in the methodology that differ from a production flow analysis that does not consider environmental impact. The study used in this paper compared the methodology to a project approach for another similar study at the same company not investigating environmental impact. The comparison highlights different needs during project startup, conceptual modeling, and data collection. 4
INITIAL METHODOLOGY AND APPLICATION
This paper uses an environmental footprint analysis of a brake disc manufacturing line as a study object to concretize the methodology and test it. Figure 2 briefly shows the initially developed methodology from project start until modeling. This chapter elaborates on the activities before modeling as initially conceptualized and describes their application on the studied case. Project set-‐up
Goals, system boundaries, functional unit, etc.
Concept
Concept model, pre-‐data collection logic definition, details specification
Data not collectible Data collection
Data to i nformation transformation
Need more information?
Modelling
Figure 2: First part of the used methodology 4.1
Project Set-up
The first step is to understand the commissioner’s purpose and goal of the study. From that information, the simulation engineer needs to set a project-specific goal and purpose, and define a functional unit and boundaries for the study. Boundaries are set traditionally in LCA in terms of geographical, time, and system boundaries. The boundaries limit the scope and define what data are needed and how far to follow material flows. This methodology considers three levels of boundaries: what the simulation model should simulate in detail, which consumables to include, and whether the simulation study needs LCI data sheets to calculate resulting emissions, provided those are available. A simulation study's purpose and goal are the basis for the choices made. The purpose and goals should have a primary focus to investigating the manufacturing system for detailed simulation to be appropriate. Any other case should use conventional LCA. For setting the boundaries, it is important for the simulation engineer to understand which consumables are relevant from a process system perspective. The simulation engineer starts to define major con-
1928
Dettmann, Andersson, Andersson, Skoogh, Johansson, and Forsbom sumables to monitor, e.g. electricity and waste. Additionally, the simulation engineer has to be adaptive throughout the startup of the project and include those consumables that have major impact on costs or environment. Compared to conventional LCA the project's most important boundaries are set on a low system level, to decide the model’s level of detail in each system part. This is decided with consideration to data availability, project time, and needed results. The goals in the studied case are to label the environmental impact for each brake disc variant and to identify hot spots accounting for significantly high impact. The system boundaries of the DES model include an automated production line from material input to packaging of the finished products. Environmental impacts by production of raw material, transports, and painting are not included in the simulation model, but taken into account by using static values extracted from databases. For calculation of environmental impact, the functional unit is one brake disc. 4.2
Concept
In the conceptual phase, the simulation engineer combines the prerequisites into a conceptual map of the production for modeling. It is important that the simulation engineer understands the manufacturing process, inventories, available data and prerequisites for modeling, and relates the information to the goals and purpose of the study. The conceptual model describes energy-, materials- and process flows detailed enough for creating a simulation model. The process flow defines the logics of the studied system, the energy and material flows (consumables) define the location and rate of consumptions. Important activities in the conception of the brake disc case were observations of the process and interviews with operators and other employees familiar with the production line. Both methods generated valuable qualitative data about process logic, material flow and machine operations. Figure 3 shows the graphical part of the conceptual model of the study object. The consumables are important for the sustainability aspects, as they are the bases for LCI data and thus, environmental impact. Through further observations and comparisons of the real production line, the model was eventually verified after minor corrections. A production engineer and a process expert validated the conceptual model and gave additional background information about flow logic and consumables in the production system that own observations had not identified.
Figure 3: Conceptual model containing energy- material- and process flow The project’s goal, labeling the environmental impact of the products through simulation, imposed special requirements on data collection, especially regarding energy consumption. Studying the operations in the machines through observations gave information about the needed level of detail for input data. As operations in the machines might consist of sub-operations with significantly different power levels, breakdown of the cycle times were necessary, i.e. a definition of several machine states per cycle. Based on the nature of the machine operations, all activities corresponded to a processing or a loading state. When a
1929
Dettmann, Andersson, Andersson, Skoogh, Johansson, and Forsbom machine is not working, it is either in idle or in breakdown state. Cycle times are split into processing and loading times. 4.3
Data Collection
After the conceptual phase, the simulation engineer focuses on data collection and transformation of these data into simulation modeling information. During the modeling phase there will probably be a few iterations back to data collection or even conceptual phase. A rigid work early in the conceptual phase limits the number of iterations to previous states. LCI data should be a minor focus for the data collection phase. Analyzing LCI data most often gives the same results as analyzing just the consumable data level due to a linear relation between LCI data and consumable mass (Andersson 2012a). A model should only collect LCI data to give preliminary results for environmental impact. The study should use LCI data that are available and collectible in databases or available sources. In the brake disc case, a comparison of existing data to the needed data specified in the conceptual model revealed that even though vast amount of data was available through databases and collected statistics, a large part did not comply with the requirements on the level of detail. A crucial lack of data quality concerned cycle times for the manufacturing operations. As those were needed as loading and processing times, but only available as complete cycles, own time measurements with stopwatches were taken for every operation. Other process data, i.e. failure times, setup times and scrap rates, were widely available as raw data in databases. This data is complemented by interviews with process experts, who also provided information about auxiliary material consumption. The environmental impact analysis required data about energy consumption of the process and any other kind of consumables entering the process. Whereas data about these consumables were available in datasheets or databases, power levels in the machines had to be measured for the chosen states. To determine the applicability of measuring equipment and formulate specification requirements, two different types of equipment were tested. The first equipment was a three-phase power quality meter that the company uses to measure energy consumption on a factory level. As it measures power with a sampling rate of 0.20 Hz and there is no possibility to save the data, it was necessary to define a method ensuring that the obtained results would be usable. Other studies (Lindskog et al. 2011; Skoogh, Johansson, and Hansson 2011) measured energy consumption by calculating average values per cycle, based on samples taken with a sufficiently high sampling rate. This method was not applicable using this equipment since with the given sample interval some cycles would only generate 2-3 samples. To cover peaks and variation in consumptions, it was instead necessary to take many samples and to record simultaneously which machine state each power value corresponds to. This implied the need to observe the machines during the complete measuring period and to synchronize these records with the power measurements. The second equipment is another three-phase power quality meter with a sampling rate of 1Hz and the possibility to log data for later analysis, similar to the approach used by Skoogh, Johansson, and Hansson (2011). The need for observing the machines during measurements persisted since the machine states are not logged automatically. However, through the higher sampling rate fewer samples is needed to get a reliable result. 5
ANALYSIS
The analysis handles three aspects. Firstly, it states the differences between the studied case and a traditional simulation project. Secondly, it compares the two different approaches for power measurements, and finally it evaluates and refines the initial methodology.
1930
Dettmann, Andersson, Andersson, Skoogh, Johansson, and Forsbom 5.1
Project Comparison
To analyze the experiences of the studied case, this paper compares it to a second simulation study performed at the same production facility. The simulation model of the other project included the whole brake disc department (9 production lines) and the project questions were of a traditional nature. Thus, not only different input data were needed, but also differences in data collection methods and the modeling approach can be seen. Table 1 shows the different questions of the projects. Based on those differences the research team compares the needed input data and modeling approaches. Table 1: Project questions •
• • •
Traditional case In which way does variation in material handling time at the picking robot influence the flow? What is the lead-time of one product? How should buffer sizes between line and painting be set? Which gains would an automated packaging station give?
• • • •
Environmental impact case What is the environmental impact of one product? In which way does the environmental impact vary between different variants? Which process operations are the hot spots for environmental impact? Which potentials to increase productivity can be identified?
These questions are used to derive data requirements. Overall, requirements of traditional simulation studies also apply to the environmental impact case. The environmental analysis goals still require additional data due to the holistic view of an environmental impact analysis, which takes into consideration any kind of consumables rather than just being performance-oriented. Table 2 summarizes differences in data requirements for both cases. Table 2: Different requirements on data collection Cycle times Setup / tool change Machine data
Traditional case Whole cycle Frequency and duration Times, failures, setup times
Product data
Dimensions
Environmental impact case Broken down into sub-operations Frequency, duration and type of material Times, failures, setup times, energy consumption, other in- and outflow (chips, tools, oils, coolants, lubricants etc.) Dimensions, weight, material, transportation of raw material
Obviously, the different questions in the cases change data collection significantly. The sustainability aspects in the environmental impact case led to a considerably higher amount of time spent on data collection than in traditional simulation studies, because the additional data are not always obvious, but can be difficult to identify. In traditional studies, already about 31% of the total project time can be approximated for input data management, whereof about 50% for actual data collection (Skoogh and Johansson 2009). In particular this time portion can be expected to increase through sustainability aspects. In the simulation model, however, the differences can be more subtle. This is because the additional data in the environmental impact case are of more static nature and can be mostly calculated externally based on model output data (Andersson et al. 2012b). Energy consumption, for example, depends on the time portions the machines spent in different states. Such statistics are in general available in simulation software, but extra work may be necessary if individual states have been defined during conception. Nevertheless, there are also special requirements on the simulation model, in particular on cycle times and data recording during simulation. Since cycle times are broken down into processing and loading,
1931
Dettmann, Andersson, Andersson, Skoogh, Johansson, and Forsbom both their states and times have to be represented in the same way in the model. To generate the required output data for the environmental impact calculations, large amounts of data need to be recorded during simulation, which the model needs to be prepared for. Thus, also the time needs for modeling increase when including sustainability aspects, although in the studied case not on the same level as for data collection. As it becomes clear, the output of a simulation model including an environmental analysis generates more data and is more detailed than output from a conventional model. The output data are still usable for conventional analysis purposes - in that case the simulation engineer can simply ignore the additional data and focus on the aspects that are important for him. On the contrary, the conventional model output data would not suffice for environmental analysis purposes. The simulation model of the case study was actually integrated in the parallel simulation project, where mostly productivity data was used. The opposite way, i.e. using the model of the other project within this case study, would not have led to applicable results. 5.2
Proposed methodology for environmental impact simulation projects
Applying the initially proposed methodology in the case confirmed that a more detailed description of the project phases is necessary to give better guidelines for the simulation engineer. Based on the gained experiences, the authors propose a refined methodology. This section describes the methodology steps in detail and visualizes them in Figure 4, Figure 5 and Figure 7. The categories are taken from the initial methodology shown in chapter 4. 5.2.1 Project Set-up From the studied case it was evident that the definition of the project goals influenced decisions about what to include in the model and on what level data should be represented. Hence, it is crucial to be clear about the goals of the project in the startup phase, which will facilitate execution of the following project phases. The proceeding during project set-up is comparable to LCA studies, as further described in section 4.1. Particularly important decisions to make are in which way environmental impact should be measured and presented, and which boundaries of the system should be set.
Goals & research questions
Decide how environmental impact should be presented
Set functional unit
System boundaries: A. S imulation model B. Consumables C. LCI data
Figure 4: Project Set-up 5.2.2 Concept Experience from the studied case showed that the conception is separable into two sub-processes: concept modeling and data pre-collection. Thorough work at this step was vital for the case and saved a lot of time later in the project, as the performed activities were preparatory for the upcoming steps and provided the practitioners with a deep understanding about what to do during the project. The goal of concept modeling is to understand the production process and to identify all parameters and consumables the simulation model and the calculations require. It needs to be pointed out that especially this step is crucial as misunderstandings of the process will lead to errors and iterations back to conception later in the project. The outcomes of concept modeling are a process description containing all information needed to understand the process, as well as a conceptual model visualizing process, energy and auxiliary material flow.
1932
Dettmann, Andersson, Andersson, Skoogh, Johansson, and Forsbom Data pre-collection covers all activities that need to be done before data gathering is started. This phase is critical for an efficient data collection and can save a lot of time if performed properly. A major activity before data collection is to determine which data to collect. To decide which factors to include for environmental impact analysis, Andersson et al. (2012b) present a large number of options, but propose to focus on raw material, waste and spillage, direct energy and overhead energy. Particularly important during data pre-collection is also the definition of machine states, which is the basis for time and energy measurements. Skoogh et al. (2011) propose the states busy, idle, down, and stand-by. However, the authors want to point out that dependent of the nature of the process and different levels of power consumption, individual choices of states may be necessary, which is especially advisable when states have to be manually identified. Similar activities can be aggregated to one state, as done in the case study for the loading state. Furthermore, preparatory activities as contacting all people that can help in data collection, or making needed measuring equipment available, should be performed.
Process description Observe the p rocess until you have understood it
Define and structure required data
Validate process concept with operators, engineers, process experts Conceptual model: Process-‐, energy-‐ and material flow
Identify data sources & establish contacts
Define machine states
Identify and get needed measuring equipment
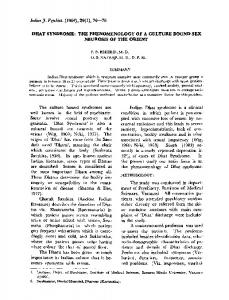
Figure 5: Concept Concerning measurements of energy consumptions, it is clear from studying the environmental impact case that the quality and specifications of the measuring equipment are crucial for the quality of results. Both devices were tested on a machining center with two chambers processing independently from each other. During the measurements, the samples were assigned to different states, depending on the activities in the chambers. To compare the equipment, Figure 6 visualizes the power of the machine during an interval of one minute, including a complete cycle.
Sampling rate 0.2Hz
Power [kW]
50
Power [kW]
40
60
Sampling rate 1Hz
40
30
20
20 10 0
0
-‐20
Time [mm:ss]
Time [mm:ss]
Figure 6: Result comparison between measuring equipment The equipment with high sampling rate shown on the right clearly shows the dynamics in consumption, whereas the results from the first equipment were not applicable. These samples were widely spread 1933
Dettmann, Andersson, Andersson, Skoogh, Johansson, and Forsbom between 8 and about 45 kW, and no patterns were recognizable. Moreover, the average value for processing simultaneously in both chambers actually was lower than the averages for only one processing chamber. To be able to judge the quality of results, information about the dynamics in energy consumption during a machine cycle are important, which is only available through a sufficiently high sampling rate. Without this information, it is impossible to draw conclusions about repetitive patterns and randomness in energy consumption. The required sampling rate is dependent on the length of the analyzed cycles, respectively sub-cycles. Generally, the shorter the cycles the higher the sampling rate needs to be to generate a sufficient number of samples per cycle. Equipment with lower sampling rate may still work if the power level is rather constant. On the contrary, when the power level is prone to high variation as for the cycle in Figure 4, every measured cycle will have a significantly different average value, even though the average power level may be the same for all cycles in reality. Leveling out this effect in average calculation requires an extensively high number of samples. Moreover, no observations of start-up behavior, states or cycles are possible. Consequently, availability of measuring equipment with high accuracy and high sampling rate can be regarded as a requirement for an energy consumption analysis. The authors want to emphasize that measuring equipment can be a trap, and it has to be assured that equipment with sufficient quality for the intended measurements is chosen. 5.2.3 Data Collection Data collection can be divided into two processes for available data and for collectible own measurements. The simulation engineer checks if the required data are available and usable or collectable. To be usable, the gathered data have to match the requirements on level of detail and quality. The simulation engineer should do own measurements if these requirements are not met. In the case study, data that first appeared available and applicable eventually failed the requirements on level of detail and had to be measured. For the available historical data collected in databases it is important that the same period is chosen for all data to ensure comparability. Taking own measurements can be an iterative process. After the measurements, it is necessary to verify if the chosen method was appropriate and if sample size was sufficient. New definitions of method or sample size may be needed if the verification gives a negative result. The experience in section 5.2.2 shows the importance of choosing a reliable measurement method. A method that cannot ensure reliable and consistent measurement needs to be refined. At the end of data collection, the data need to be transformed into usable information for the model. Some data need to be allocated, especially overhead energy consumption or waste materials (chips, fluids, etc.) that cannot be assigned to one product directly. Suitable allocation methods need to be chosen dependent on the goals, the system environment and the available data. For allocation methods, see (Baumann and Tillman 2004).
Gather available data
yes
Data a vailable?
no
Matching requirements?
Decide on a period for historical data
Filter and c ompile data
Data transformation and allocation
no Define h ow to measure
Define sample size
Take measurements
no
Figure 7: Data collection
1934
Method applicable? no
Enough samples?
Dettmann, Andersson, Andersson, Skoogh, Johansson, and Forsbom 6
DISCUSSION
The proposed methodology is a general guideline for simulation projects with sustainability aspects. The activities in the early project phase, in particular setting clear goals and data requirements, as well as thorough process observations, greatly contributed to the success of the study. The methodology therefore helps simulation engineers focus on important factors. However, in possible future studies following the proposed methodology, the method applications may differ in some steps. In particular, the goals of a study, as well as the available data influence the study. Purposes with less weight on environmental aspects reduce work in the conception and the data collection phase, since both the amount of data and the required level of detail are lower when focusing on traditional instead of environmental factors, as seen in the project comparison in section 5.1. Also setting a common system boundary for modeling and consumables could simplify the work. Concerning available data, data collection will be easier if more data is automatically recorded. For example, there would be no need to observe and record machine states for energy consumption if those were available in a data logging system, or derivable from the recorded data. Nevertheless, the proposed methodology is valid and applicable for other cases than the given examples, as it covers different aspects, regardless of their relevance for a specific case. This means that the simulation engineer can skip steps regarded as not applicable. For the measurements of energy consumption, it depends on the specific properties of the process which choice of states and cycle time divisions is suitable. This study divided the state working into loading and processing since non-processing activities accounted for up to 40% of the cycle and consisted of many small operations that could be summarized into loading time. This was applicable to all machines, as all performed machining operations and their process structure were comparable. However, for other types of processes, different division of times and states may be more suitable. It is possible to apply an individual choice of states tailored to the machines. The chosen approach depends on the amount of nonprocessing activities (both in number and length), as well as the differences in power level for those activities. If the power level during the cycle is rather stable and non-processing activities only account for a small part of the cycle, a division of the working state on a further detailed level may not be necessary at all, and simple averages over the cycles may be sufficient, as proposed by Skoogh et al. (2011). Alternatively, it may also be possible to use summed total energy consumptions per state, instead of calculating the consumption from power and time spent in the state. In other cases, estimations about differences in power levels may be necessary. The authors recommend observing the process thoroughly and making an intuitive judgment of process states. The simulation engineer can perform test measurements of energy consumption to support the decision. In any case, the practitioners must take the decision before they measure the process data times to prevent waste of resources by doing repeated measures with different methods. Before starting the modeling phase the practitioners need to decide on simulation software to use. This paper does not discuss software criteria. Thiede et al. (2013) evaluate the suitability of common current software for simulation projects assessing environmental sustainability. 7
CONCLUSION
The start-up phase has a major impact on the project costs or result quality. This paper proposes a methodology to guide simulation projects with sustainability aspects from start into modeling phase. In particular, clear definitions of goals and data requirements, as well as a thorough concept phase have been success factors in the case study. The article describes special requirements on data collection for sustainability aspects and points out that available data only are applicable for the project if they match the requirements. For measurements of energy consumption, the authors suggest defining individual machine states dependent on the analyzed process rather than using common state definitions, and highlight the importance of suitable measuring equipment. Including environmental sustainability aspects in the
1935
Dettmann, Andersson, Andersson, Skoogh, Johansson, and Forsbom simulation project lead to an extended simulation model with augmented data collection and a more detailed machine state definition. ACKNOWLEGEMENTS This research is partly funded through the project EcoProIT funded by ProViking, which is gratefully acknowledged. This work is carried out within the Sustainable Production Initiative and the Production Area of Advance at Chalmers. The support is gratefully acknowledged. VINNOVA and the Swedish Research Council are thanked for financial support to the Sustainable Production Initiative. REFERENCES Andersson, J., A. Skoogh & B. Johansson. 2012a. “Evaluation of Methods used for Life-cycle Assessment in Discrete Event Simulation.” In Proceedings of the 2012 Winter Simulation Conference, Edited by C. Laroque, J. Himmelspach, R. Pasupathy, O. Rose and A. M. Uhrmacher Berlin, Germany Andersson, J., A. Skoogh, J. Berglund and B. Johansson 2012b. "Environmental Impact Assessment for Manufacturing: Data Requirements for a Simulation-Based Approach" In Proceeding of the 2012 Swedish Production Symposium, Linköping, Sweden Baumann, H. and A.-M. Tillman 2004. ”The Hitch Hiker's Guide to LCA.” An orientation in life cycle assessment methodology and application, Studentlitteratur, Sweden Heilala, J., S. Vatanen, H. Tonteri, J. Montonen, S. Lind, B. Johansson, and J. Stahre. 2008. “SimulationBased Sustainable manufacturing System Design.” In Proceedings of the 2008 Winter Simulation Conference, Edited by. S. J. Mason, R. R. Hill, L. Mönch, O. Rose, T. Jefferson, J. W. Fowler, 19221930. Piscataway, New Jersey: Institute of Electrical and Electronics Engineers, Inc. Herrmann, C., S. Thiede, S. Kara and J. Hesselbach 2011. "Energy oriented simulation of manufacturing systems - Concept and application" Cirp Annals-Manufacturing Technology, 60: 45-48. ISO - International Organization for Standardization 2006. "ISO 14040:2006b Environmental management - Life cycle assessment - Principles and framework" Geneva ISO - International Organization for Standardization 2006. "ISO 14044:2006c Environmental management -- Life cycle assessment -- Requirements and guidelines" Geneva Jimenez, E., E. Martinez, J. Blanco, M. Perez & C. Graciano 2013. "Methodological approach towards sustainability by integration of environmental impact in production system models through life cycle analysis: Application to the Rioja wine sector" Simulation. Lindskog, E., L. Lundh, J. Berglund, Y. T. Lee, A. Skoogh and B. Johansson 2011. ”A Method for Determing the Environmental Footprint of Industrial Products using Simulation.” Edited by S. Jain, R. R. C., J. Himmelspach, K.P. White, and M. Fu In: Proceedings of the 2011 Winter Simulation Conference, Phoenix, Kiron, D., N. Kruschwitz, K. Haanæs and I. V. S. Velken 2012. "Sustainability nears a tipping point" MIT Sloan Management Review, 53:69-74. Reinhard, J., M. F. Emmenegger, A. H. Widok and V. Wohlgemuth. 2011. “RSB Tool: A LCA Tool for the assessment of biofuels sustainability.” Edited by S. Jain, R. R. C., J. Himmelspach, K.P. White, and M. Fu In: Proceedings of the 2011 Winter Simulation Conference, Phoenix, Skoogh, A., and B. Johansson. 2009. “Mapping of Time-Consumption During Input Data Management Activities.” Simulation News Europe, 19(2):39-46. Skoogh, A., B. Johansson and L. Hansson 2011. ”Data Requirements and Representation for Simulation of Energy Consumption in Production Systems. In: Proceedings of the 44th CIRP Conference on Manufacturing Systems. Thiede, S., Y. Seow, J. Andersson and B. Johansson 2013. "Environmental aspects in manufacturing system modelling and simulation - State of the art and research perspectives" CIRP Journal of Manufacturing Science and Technology, 6:78-87. 1936
Dettmann, Andersson, Andersson, Skoogh, Johansson, and Forsbom Widok, A. H., V. Wohlgemuth and B. Page. “Combining sustainability criteria with discrete event simulation.” Edited by S. Jain, R. R. C., J. Himmelspach, K.P. White, and M. Fu In: Proceedings of the 2011 Winter Simulation Conference, Phoenix, USA AUTHOR BIOGRAPHIES TOBIAS DETTMANN holds a MSc in Production Engineering from Chalmers University of Technology. He carried out the case study as a part of his Master's project together with Clas Andersson. Currently he is working as a production engineer for ÅF. His email address is
[email protected] CLAS ANDERSSON holds a MSc in Production Engineering from Chalmers University of Technology. He carried out the case study as a part of his Master's project together with Tobias Dettmann. His email address is
[email protected] JON ANDERSSON is a PhD student in the field of virtual production system at the Department of Product and Production Development, Chalmers University of Technology. He is currently active in the field of simulation of production flows and especially in a project called EcoProIT (http://www.ecoproit.com). The project aims to develop methodologies and tools for environmental impact assessment in DES. His email address is
[email protected]. ANDERS SKOOGH is an Assistant Professor in the area of Virtual Production at the Department of Product and Production Development, Chalmers University of Technology, Sweden. In 2011, he received his PhD in Production Systems from Chalmers. Before starting his research career, he accumulated industrial experience as a logistics developer at Volvo Car Corporation. His main research area is virtual tools for decision support in development of sustainable production systems. The current focus is on efficient management of production data, mainly for simulation and maintenance purposes. Anders is also the Director of Chalmers’ Masters Programme in Production Engineering. His email address is
[email protected]. BJÖRN JOHANSSON is Associate Professor and vice head of Production Systems division at the Department of Product and Production Development, Chalmers University of Technology, Sweden. He serves as Production Modeling Corporation director for the European office in Gothenburg. His research interest is in the area of discrete-event simulation applied for manufacturing industries, including environmental effects modeling, modular modeling methodologies, software development, user interfaces, and input data architectures. His email address is
[email protected]. PER-OLOF FORSBOM is a production simulation engineer at the manufacturing department at Volvo Cars Corporation in Skövde, Sweden. Forsbom has worked with discrete-event simulation in traditional simulation projects for two years. He completed his training in flow simulation through a number of courses at the University of Skövde and has a degree in production engineering and eleven years of experience of production and manufacturing engineering at Volvo Car Corporation division engine.
1937