Smart [Sal91] and Alta Vista provide some simple automa- tion by computing ... it is ineffective for users to scan a list of hundreds of docu- ment titles. To cull the .... center and construct a cluster from the star center ..... an E(p, r) value. For better ...
Static and Dynamic Information Organization with Star Clusters Javed Aslam Katya Pelekhov Daniela Rus Department of Computer Science Dartmouth College Hanover, NH 03755
Abstract In this paper we present a system for static and dynamic information organization and show our evaluations of this system on TREC data. We introduce the off-line and on-line star clustering algorithms for information organization. Our evaluation experiments show that the offline star algorithm outperforms the single link and average link clustering algorithms. Since the star algorithm is also highly efficient and simple to implement, we advocate its use for tasks that require clustering, such as information organization, browsing, filtering, routing, topic tracking, and new topic detection.
1
Introduction
Modern information systems have vast amounts of unorganized data that change dynamically. Consider, for example, the flow of information that arrives continuously on news wires, or is aggregated by a news organization such as CNN. Some stories are new while other stories are follow-ups on previous stories. Yet another type of stories make previous reportings obsolete. The news focus changes regularly with this flow of information. In such dynamic systems, users need to locate information quickly and efficiently. Current information systems such as Inquery [Tur90], Smart [Sal91] and Alta Vista provide some simple automation by computing ranked (sorted) lists of documents, but it is ineffective for users to scan a list of hundreds of document titles. To cull the critical information out of a large set of potentially useful dynamic sources, we need methods for organizing information to highlight the topic content of a collection and reorganize the data to adapt to the incoming flow of documents. Such information organization algorithms would support incremental information processing tasks such as routing, topic tracking and new topic detection in a stream of documents. In this paper, we present a system for the static and dynamic organization of information and we evaluate the
system on TREC data. We introduce the off-line and online star clustering algorithms for information organization. We also describe a novel method for visualizing clusters, by embedding them in the plane so as to capture their relative difference in content. Our evaluation experiments show that the off-line star algorithm outperforms the single link and average link clustering algorithms. Since the star algorithm is also highly efficient and simple to implement, we advocate its use for tasks that require clustering, such as information organization, routing, topic tracking, and new topic detection.
1.1
Previous Work
There has been extensive research on clustering and applications to many domains [HS86, AB84]. For a good overview see [JD88]. For a good overview of using clustering in information retrieval see [Wil88]. The use of clustering in information retrieval was mostly driven by the cluster hypothesis [Rij79] which states that relevant documents tend to be more closely related to each other than to non-relevant documents. Efforts have been made to determine whether the cluster hypothesis is valid. Voorhees [Voo85] discusses a way of evaluating whether the cluster hypothesis holds and shows negative results. Croft [Cro80] describes a method for bottom-up cluster search that could be shown to outperform a full ranking system for the Cranfield collection. The single link method [Cro77] does not provide any guarantees for the topic similarity within a cluster. Jardine and van Rijsbergen [JR71] show some evidence that search results could be improved by clustering. Hearst and Pedersen [HP96] re-examine the cluster hypothesis by focusing on the Scatter/Gather system [CKP93] and conclude that it holds for browsing tasks. Systems like Scatter/Gather [CKP93] provide a mechanism for user-driven organization of data into a fixed number of clusters, but user feedback is required and the computed clusters do not have accuracy guarantees. Scatter/Gather uses fractionation to compute nearest-neighbor clusters. In a recent paper, Charika et al. [CCFM97] consider a dynamic clustering algorithm to partition a collection of text documents into a fixed number of clusters. However, since the number of topics in a dynamic information systems is not generally known a priori, a fixed number of clusters cannot generate a natural partition of the information.
1.2
Our Work
Our work on clustering presented in this paper and in [APR98] describes a simple incremental algorithm, provides positive evidence for the cluster hypothesis, and shows promise for on-line tasks that require dynamically adjusting the topic content of a collection such as filtering, browsing, new topic detection and topic tracking. We propose an off-line algorithm for clustering static information and an on-line version of this algorithm for clustering dynamic information. These two algorithms compute clusters induced by the natural topic structure of the space. Thus, this work is different than [CKP93, CCFM97] in that we do not impose a fixed number of clusters as a constraint on the solution. As a result, we can guarantee a lower bound on the topic similarity between the documents in each cluster. To compute accurate clusters, we formalize the clustering problem as one of covering a thresholded similarity graph by cliques. Covering by cliques is NP-complete and thus intractable for large document collections. Recent graph-theoretic results have shown that the problem cannot even be approximated in polynomial time [LY94, Zuc93]. We instead use a cover by dense subgraphs that are star-shaped1 , where the covering can be computed off-line for static data and on-line for dynamic data. We show that the off-line and on-line algorithms produce high-quality clusters very efficiently. Asymptotically, the running time of both algorithms is roughly linear in the size of the similarity graph that defines the information space. We also derive lower bounds on the topic similarity within clusters guaranteed by a star covering, thus providing theoretical evidence that the clusters produced by a star cover are of high-quality. We packaged these algorithms as a system that supports ad-hoc queries, static information organization, dynamic information organization, and routing. In this system we contributed a novel way of visualizing topic clusters by using disks whose radii are proportional to the size of the cluster and that are embedded in the plane in a way that captures the topic distance between the clusters. Finally, we provide experimental data for off-line and online topic organization. In particular, our off-line results on a TREC collection indicate that star covers exhibit significant performance improvements over either the single link [Cro77] or average link [Voo85] methods (21.6% and 16.2% improvements, respectively, with respect to a common cluster quality measure) without sacrificing simplicity or efficiency.
1.3
Utility
Our algorithms for organizing information systems can be used in several ways. The off-line algorithm can be used as a pre-processing step in a static information system or as a post-processing step on the specific documents retrieved by a query. As a pre-processor, this system assists users with deciding how to browse a database of free text documents by highlighting relevant topics and irrelevant subtopics. Such clustered data is useful for narrowing down the database over which detailed queries can be formulated. As a post-processor, this system classifies the retrieved data into clusters that capture topic categories and subcategories. The on-line algorithm can be used for 1 In [SJJ70] stars were also identified to be potentially useful for clustering.
constructing self-organizing information systems, for routing problems, for topic detection, and for topic tracking.
2
Off-line Information Organization
In this section, we begin by presenting an efficient algorithm for off-line organization of information. We then describe our system built around this algorithm, including user interface design and visualization techniques. Finally, we present a performance evaluation of our organization algorithm. We begin by examining the organization problem and introducing the star algorithm.
2.1
The Star Algorithm
We formalize our problem by representing an information system by its similarity graph. A similarity graph is an undirected, weighted graph G = (V, E, w) where vertices in the graph correspond to documents and each weighted edge in the graph corresponds to a measure of similarity between two documents. We measure the similarity between two documents by using the cosine metric in the vector space model of the Smart information retrieval system [Sal89, Sal91]. G is a complete graph with edges of varying weight. An organization of the graph that produces reliable clusters of similarity σ (i.e., clusters where documents have pairwise similarities of at least σ) can be obtained by first thresholding the graph at σ and then performing a minimum clique cover with maximal cliques on the resulting graph Gσ . The thresholded graph Gσ is an undirected graph obtained from G by eliminating every edge whose weight is lower that σ. The minimum clique cover has two features. First, by using cliques to cover the similarity graph, we are guaranteed that all the documents in a cluster have the desired degree of similarity. Second, minimal clique covers with maximal cliques allow vertices to belong to several clusters. In our information retrieval application this is a desirable feature as documents can have multiple subthemes. However, the algorithm can also be used to compute non-overlapping clusters. In our experimental evaluations (see Figure 4) we show that the difference in results between star with overlapping clusters and star without overlapping clusters is very small. Unfortunately, this approach is not tractable computationally. For real corpora, similarity graphs can be very large. The clique cover problem is NP-complete, and it does not admit polynomial-time approximation algorithms [LY94, Zuc93]. While we cannot perform a clique cover nor even approximate such a cover, we can instead cover our graph by dense subgraphs. What we lose in intra-cluster similarity guarantees, we gain in computational efficiency. In this section and the sections that follow, we describe off-line and on-line covering algorithms and analyze their performance and efficiency. We approximate a clique cover by covering the associated thresholded similarity graph with star-shaped subgraphs. A star-shaped subgraph on m + 1 vertices consists of a single star center and m satellite vertices, where there exist edges between the star center and each of the satellite vertices. While finding cliques in the thresholded similarity graph Gσ guarantees a pairwise similarity between documents of at least σ, it would appear at first glance that finding star-shaped subgraphs in Gσ would provide similarity guarantees between the star center and each of the satellite vertices, but no such similarity guarantees between
For any threshold σ: 1. Let Gσ = (V, Eσ ) where Eσ = {e : w(e) ≥ σ}. 2. Let each vertex in Gσ initially be unmarked. 3. Calculate the degree of each vertex v ∈ V . 4. Let the highest degree unmarked vertex be a star center and construct a cluster from the star center and its associated satellite vertices. Mark each node in the newly constructed cluster. 5. Repeat step 4 until all nodes are marked. 6. Represent each cluster by the document corresponding to its associated star center.
similarity between S1 and S2 must be at least cos(α1 + α2 ) = cos α1 cos α2 − sin α1 sin α2 . If σ = 0.7, cos α1 = 0.75 and cos α2 = 0.85, for instance, we can conclude that the similarity between the two satellite vertices must be at least2 (0.75) · (0.85) −
2.2
Cluster Quality
In this section, we argue that the clusters produced by a star cover have high average intra-cluster similarity weights; thus, the clusters produced are accurate and of high quality. Consider three documents C, S1 and S2 which are vertices in a star-shaped subgraph of Gσ , where S1 and S2 are satellite vertices and C is the star center. By the definition of a star-shaped subgraph of Gσ , we must have that the similarity between C and S1 is at least σ and that the similarity between C and S2 is also at least σ. In the vector space model, these similarities are obtained by taking the cosine of the angle between the vectors associated with each document. Let α1 be the angle between C and S1 , and let α2 be the angle between C and S2 . We then have that cos α1 ≥ σ and cos α2 ≥ σ. Note that the angle between S1 and S2 can be at most α1 + α2 , and therefore we have the following lower bound on the similarity between satellite vertices in a star-shaped subgraph of Gσ . Theorem 1 Let Gσ be a similarity graph and let S1 and S2 be two satellites in the same star in Gσ . If α1 ≥ σ and α2 ≥ σ are the respective similarities between S1 and the star center and between S2 and the star center, then the
1 − (0.75)2
p
1 − (0.85)2 ≈ 0.29.
While this may not seem very encouraging, the above analysis is based on absolute worst-case assumptions, and in practice, the similarities between satellite vertices are much higher. We further undertook a study to determine the expected similarity between two satellite vertices. Under the assumption that “similar” documents are essentially “random” perturbations of one another in an appropriate vector space, we have proven the following [APR97]:
Figure 1: The star algorithm satellite vertices. However, by investigating the geometry of our problem in the vector space model, we can derive a lower bound on the similarity between satellite vertices as well as provide a formula for the expected similarity between satellite vertices. The latter formula predicts that the pairwise similarity between satellite vertices in a starshaped subgraph is high, and together with empirical evidence supporting this formula, we shall conclude that covering Gσ with star-shaped subgraphs is a reliable method for clustering a set of documents. The star algorithm is based on a greedy cover of the thresholded similarity graph by star-shaped subgraphs; the algorithm itself is summarized in Figure 1. The star algorithm is very efficient. In [APR98] we show that the star algorithm can be correctly implemented in such a way that given a thresholded similarity graph Gσ , the running time of the algorithm is Θ(V + Eσ ), linear in the size of the input graph.
p
medline mean square error 0.025 0.02 0.015 0.01 0.005 0 0 0.2 0.4 0.6 0.8 0.8
0.6
0.4
0.2
0
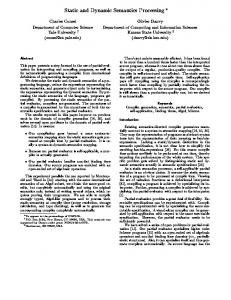
Figure 2: This figure shows the actual mean-squared prediction error for a 6,000 abstract subset of MEDLINE. Theorem 2 Let Gσ be a similarity graph and let S1 and S2 be two satellites in the same star in Gσ . If α1 ≥ σ and α2 ≥ σ are the respective similarities between S1 and the star center and between S2 and the star center, then the expected similarity between S1 and S2 is σ sin α1 sin α2. cos α1 cos α2 + 1+σ For the previous example, the above formula would predict a similarity between satellite vertices of approximately 0.78. We have tested this formula against real data, and the results of the test with the MEDLINE data set are shown in Figure 2. In this plot, the x- and y-axes are similarities between a cluster center and each of two satellite vertices, and the z-axis is the actual mean squared prediction error of the above formula for the similarity between satellite vertices. Note that the root mean square error (RMS) is quite small (approximately 0.13 in the worst case), and for reasonably high similarities, the error is negligible. From our tests with real data, we have concluded that this formula is quite accurate and that star-shaped subgraphs are reasonably “dense” in the sense that they imply relatively high pairwise similarities between documents. 2
Note that sin θ =
√ 1 − cos2 θ.
Figure 3: This is a screen snapshot from a clustering experiment. The top window is the query window. The middle window consists of a ranked list of documents that were retrieved in response to the user query. The user may select “get” to fetch a document or “graph” to request a graphical visualization of the clusters as in the bottom window. The left graph displays all the documents as dots around a circle. Clusters are separated by gaps. The edges denote pairs of documents whose similarity falls between the slider parameters. The right graph displays all the clusters as disks. The radius of a disk is proportional to the size of the cluster. The distance between the disks is proportional to the similarity distance between the clusters.
2.3
The System
We have implemented a system for organizing information that uses the star algorithm. This organization system was used for the experiments described in this paper. It consists of an augmented version of the Smart system [Sal91, All95], a user interface we have designed, and an implementation of the star algorithm on top of Smart. To index the documents we used the Smart search engine with
a cosine normalization weighting scheme. We enhanced Smart to compute a document to document similarity matrix for a set of retrieved documents or a whole collection. The similarity matrix is used to compute clusters and to visualize the clusters. The user interface is implemented in Tcl/Tk. The organization system can be run on a whole collection, on a specified subcollection, or on the collection of
documents retrieved in response to a user query. Users can input queries by typing free text. They have the choice of specifying several corpora. This system supports distributed information retrieval, but in this paper we do not focus on distribution and we assume only one centrally located corpus. In response to a user query, Smart is invoked to produce a ranked list of the top most relevant documents, their titles, locations and document-to-document similarity information. The similarity information for the entire collection, or for the collection computed by the query engine is provided as input to the star algorithm. This algorithm returns a list of clusters and marks their centers.
2.4
Visualization
We have developed a visualization method for organized data that presents users with three views of the data (see Figure 3): a list of text titles, a graph that shows the similarity relationship between the documents, and a graph that shows the similarity relationship between the clusters. These views provide users with summaries of the data at different levels of detail (text, document and topic) and facilitate browsing by topic structure. The connected graph view (inspired by [All95]) has nodes corresponding to the retrieved documents. The nodes are placed in a circle, with nodes corresponding to the same cluster placed together. Gaps between the nodes allow us to identify clusters easily. Edges between nodes are color coded according to the similarity between the documents. Two slider bars allow the user to establish minimal and maximal weight of edges to be shown. Another view presents clusters as disks whose size is proportional to the size of the corresponding cluster. The distance between two clusters is defined as a distance between the central documents and captures the topic separation between the clusters. Simulated annealing is used to find a cluster placement that minimizes the sum of relative distance errors between clusters. We selected a cooling schedule α(t) = t/(1 + βt), where β = 10−3 , initial temperature is 500 and the freezing point is 10−2 . This setting provides a good placement when the number of clusters returned by the algorithm is small. This algorithm is fast, and its running time does not depend on the number of clusters. When the number of clusters is large, the ellipsoid-based method for Euclidean graph embeddings described in [LLR95] can be used instead. All three views and a title window allow the user to select an individual document or a cluster. A selection made in one window is simultaneously reflected in the others.
2.5
Performance Comparison with Two Clustering Algorithms
In order to evaluate the performance of our system, we tested the star algorithm against two classic clustering algorithms: the single link method [Cro77] and the average link method [Voo85]. We used data from the TREC-6 conference as our testing medium. The TREC collection contains a set of 130,471 documents of which 21,694 have been ascribed relevance data with respect to 47 topics. These 21,694 documents were partitioned into 22 separate subcollections of approximately 1,000 documents each. Within a subcollection, each of the 47 topics has a corresponding subset of documents which is relevant to that topic.
The goal of a clustering method is to organize the set of documents in such a way that the subset of documents corresponding to a selected topic appears as a cluster in the organization. For each of the subcollections, we performed the following experiment. Given a selected topic, the set of documents was organized by a clustering method in question, and the “best” cluster corresponding to this topic was returned. Two issues immediately arise: first, how does one measure the “quality” of a cluster to determine which is “best”; and second, how does one appropriately generate clusters from which to choose. To measure the quality of a cluster, we use the common E measure [Rij79] as defined below E(p, r) = 1 −
2 1/p + 1/r
where p and r are the standard precision and recall of the cluster with respect to the set of documents relevant to the topic. Note that E(p, r) is simply one minus the harmonic mean of the precision and recall; thus, E(p, r) ranges from 0 to 1 where E(p, r) = 0 corresponds to perfect precision and recall and E(p, r) = 1 corresponds to zero precision and recall. It is worthwhile to note that when viewing data comparing two clustering methods, lower E(p, r) values correspond to better performance. In order to compare the clustering methods fairly, each of the methods was run in such a way so as to produce the “best” possible cluster with respect to a given topic, as defined by the E(p, r) measure above. (This is in keeping with previous comparative analyses of clustering methods; see, for example, Burgin [Bur95] and Shaw [Sha93].) In the case of the single link and star cover algorithms, the algorithms were run using a range of thresholds, and the best cluster obtained over all thresholds was returned. (One can view the clustering obtained with respect to a given threshold as a “slice” within a hierarchical clustering over all thresholds; thus, in effect, the best cluster in the hierarchy was returned in these experiments.) In the case of the average-link algorithm which naturally produces a hierarchical clustering, the best cluster within the hierarchy was returned. Unlike the star algorithm, single and average link algorithms do not allow overlapping clusters. It has been suggested [All98] that the differences in performance may be attributed to the effects of overlapping rather than to the actual properties of the algorithm. To investigate this issue we conducted the same experiments using a version of the star clustering algorithm that eliminates the overlapping clusters. In this setting we used the star algorithm to find a set of star centers, then partitioned a collection by assigning a document to the closest star center. This methodology has been used before [JD88]. We note that the difference in results between star with overlapping clusters and star without overlapping clusters is very small. Both algorithms still outperform single link and average link (See Figure 4). Each subcollection of 1,000 documents corresponded to an individual experiment. For a given clustering method, the appropriate algorithm was employed to determine the best possible cluster (as defined by the E(p, r) measure) for each of the 47 topics. For each optimal cluster, the E(p, r), precision and recall values were calculated with respect to the actual set of documents relevant to the topic,
star (overlap) r E
star (partition) p r E
average link r E
coll
p
1 2 3 4 5 6 7 8 9 10 11 12 13 14 15 16 17 18 19 20 21 22
0.78 0.74 0.78 0.76 0.80 0.76 0.76 0.75 0.82 0.74 0.82 0.80 0.81 0.76 0.75 0.87 0.64 0.77 0.73 0.71 0.74 0.76
0.56 0.59 0.53 0.50 0.50 0.41 0.62 0.57 0.49 0.52 0.55 0.55 0.53 0.47 0.54 0.47 0.53 0.56 0.54 0.51 0.61 0.63
0.35 0.35 0.37 0.40 0.38 0.47 0.32 0.35 0.39 0.39 0.34 0.35 0.36 0.42 0.37 0.39 0.42 0.35 0.38 0.41 0.33 0.31
0.79 0.70 0.79 0.81 0.78 0.68 0.79 0.73 0.80 0.79 0.86 0.83 0.81 0.73 0.79 0.86 0.64 0.81 0.74 0.76 0.79 0.80
0.53 0.55 0.48 0.46 0.50 0.45 0.61 0.57 0.50 0.46 0.48 0.53 0.49 0.46 0.48 0.46 0.51 0.51 0.50 0.48 0.56 0.60
0.36 0.38 0.41 0.41 0.39 0.46 0.31 0.36 0.38 0.42 0.38 0.36 0.39 0.43 0.40 0.40 0.43 0.37 0.40 0.41 0.34 0.32
0.74 0.88 0.84 0.71 0.85 0.78 0.81 0.82 0.89 0.85 0.83 0.82 0.84 0.86 0.83 0.91 0.80 0.79 0.83 0.81 0.84 0.83
0.50 0.43 0.44 0.46 0.40 0.39 0.52 0.48 0.44 0.42 0.45 0.49 0.46 0.36 0.35 0.40 0.39 0.53 0.42 0.41 0.49 0.47
avg
0.77
0.54
0.37
0.78
0.51
0.39
0.83
0.44
p
p
single link r
E
0.40 0.43 0.43 0.44 0.46 0.48 0.36 0.39 0.41 0.44 0.42 0.38 0.40 0.50 0.50 0.45 0.48 0.36 0.45 0.45 0.38 0.40
0.77 0.88 0.83 0.73 0.81 0.83 0.78 0.86 0.87 0.87 0.85 0.83 0.89 0.91 0.87 0.95 0.76 0.81 0.85 0.86 0.88 0.85
0.47 0.41 0.43 0.41 0.40 0.34 0.50 0.44 0.43 0.38 0.44 0.40 0.40 0.31 0.33 0.39 0.39 0.48 0.39 0.36 0.46 0.46
0.41 0.44 0.43 0.48 0.46 0.51 0.39 0.42 0.43 0.47 0.42 0.46 0.44 0.54 0.52 0.45 0.48 0.40 0.46 0.49 0.40 0.40
0.43
0.84
0.41
0.45
Figure 4: This figure shows comparison data for the star algorithm, the partitioning star algorithm, the single link algorithm, and the average link algorithm for 22 subcollections of TREC documents. For each algorithm, p represents the average precision computed across all clusters found for the collection; r represents the average recall computed across all 2 clusters found for the collection; and E(p, r) is the aggregate measure 1 − 1/p+1/r .
1
1 star single link
0.8 1-2/(1/p+1/r)
1-2/(1/p+1/r)
0.8
0.6
0.4
0.2
star average link
0.6
0.4
0.2
0
0 0
50 100 150 200 250 300 350 400 450 500 cluster #
0
50 100 150 200 250 300 350 400 450 500 cluster #
Figure 5: This figure shows the E(p, r) measure for the partitioning star clustering algorithm and for the single link clustering algorithm. The y axis shows the E(p, r) measure, while the x axis shows the cluster number. Clusters have been sorted according to the E(p, r) values of the star algorithm.
Figure 6: This figure shows the E(p, r) measure for the partitioning star clustering algorithm and for the average link clustering algorithm. The y axis shows the E(p, r) measure, while the x axis shows the cluster number. Clusters have been sorted according to the E(p, r) values of the star algorithm.
and these values were averaged over all topics to obtain the three numbers reported for each experiment and clustering method in Figure 4. Averaging over all 22 experiments, we find that the mean E(p, r) values for star, partitioning star, average link and single link are 0.37, 0.39, 0.43 and 0.45, respectively. Thus, the star algorithm represents a 16.2% improvement in performance with respect to average link and an 21.6% improvement with respect to single link. The difference is only partly due to the effect of allowing overlapping clusters - the partitioning star algorithm still gives us a 10.2% and 15.4% improvement in performance over average link and single link respectively.
We repeated this experiment on the same data, using one collection only (of 21,694 documents.) The precision, recall, and E values for star (overlap), star, average link, and single link were (.52, .36, .58), (.53, .32, .61), (.63, .25, .64), and (.66, .20, .70) respectively. We note that the E measures are worse for all four algorithms on this larger collection and that the star algorithm outperforms average link by 10.3% and single link by 20.7%. Figures 5 and 6 show detailed E(p, r) values for the star algorithm vs. the single link algorithm and for the star algorithm vs. the average link algorithm over the collection of experiments. Each cluster computed by the algorithm has
an E(p, r) value. For better readability of these graphs, we sorted the clusters produced by the star algorithm according to their E(p, r) values. We plotted the corresponding E(p, r) values for the single link algorithm (see the oscillating line in Figure 5) and for the average link algorithm (see the oscillating line in Figure 6). We note that the E(p, r) values for the star clusters are almost everywhere lower than the corresponding values for the single link and average link algorithms; thus, the star algorithm outperforms these two methods. These experiments show that the star algorithm outperforms the single link and average link methods. Since the star algorithm is also simple to implement and highly efficient, we believe that the star algorithm is very effective for information organization and other text clustering applications.
3
On-line Information Organization
our discussion on adding documents to the collection. The delete algorithm is similar. The intuition behind the incremental computation of the star cover of a graph after a new vertex is inserted is depicted in Figure 7. The top figure denotes a thresholded similarity graph and a correct star cover for this graph. Suppose a new vertex is inserted in the graph, as in the middle figure. The original star cover is no longer correct for the new graph. The bottom figure shows the correct star cover for the new graph. How does the addition of this new vertex affect the correctness of the star cover? In general, the answer depends on the degree of the new vertex and on its adjacency list. If the adjacency list of the new vertex does not contain any star centers, the new vertex can be added in the star cover as a star center. If the adjacency list of the new vertex contains any center vertex c whose degree is higher, the new vertex becomes a satellite vertex of c. The difficult case that destroys the correctness of the star cover is when the new vertex is adjacent to a collection of star centers, each of whose degree is lower than that of the new vertex. In this situation, the star structure already in place has to be modified to assign the new vertex as a star center. The satellite vertices in the stars that are broken as a result have to be re-evaluated. Motivated by the intuition in the previous paragraph, we now describe an on-line algorithm for incrementally computing star covers of dynamic graphs. The algorithm is shown in Figure 8. This algorithm uses a special data structure to efficiently maintain the star cover of an undirected graph G = (V, E). For each vertex v ∈ V , we maintain the following data. v.type v.degree v.adj v.centers v.inQ
Figure 7: This figure shows the star cover change after the insertion of a new vertex. The larger-radius disks denote star centers, the other disks denote satellite vertices. The star edges are denoted by solid lines. The inter-satellite edges are denoted by dotted lines. The top figure shows an initial graph and its star cover. The middle figure shows the graph after the insertion of a new document. The bottom figure shows the star cover of the new graph. In this section we consider algorithms for computing the organization of a dynamic information system. We derive an on-line version of the star algorithm for information organization that can incrementally compute clusters of similar documents. We continue assuming the vector space model and the cosine metric to capture the pairwise similarity between the documents of the corpus.
3.1
The On-line Star Algorithm
We assume that documents are inserted or deleted from the collection one at a time. For simplicity, we will focus
satellite or center degree of v list of adjacent vertices list of adjacent centers flag specifying if v being processed
Note that while v.type can be inferred from v.centers and v.degree can be inferred from v.adj, it will be convenient to have all five pieces of data in the algorithm. Let α be a vertex to be added to G, and let L be the list of vertices in G which are adjacent to α. The algorithm in Figure 8 will appropriately update the star cover of G. See [APR97] for a more detailed correctness argument.
3.2
Analysis
We have shown that the star cover produced by the online star algorithm is correct in that it is identical to the star cover produced by the off-line algorithm (or one of the correct covers, if more than one exists) [APR97]. Furthermore, the on-line star algorithm is very efficient. In our initial tests, we have implemented the on-line star algorithm using a heap for the priority queue and simple linked lists for the various lists required. The time required to insert a new vertex and associated edges into a thresholded similarity graph and to appropriately update the star cover is largely governed by the number of stars that are broken during the update, since breaking stars requires inserting new elements into the priority queue. In practice, very few stars are broken during any given update (see Figure 9). This is due partly to the fact that relatively few stars exist at any given time (as compared to the number of vertices or edges in the thresholded similarity graph) and partly to
300 aggregate number of stars broken
Update(α, L) 1 α.type ← satellite 2 α.degree ← 0 3 α.adj ← ∅ 4 α.centers ← ∅ 5 forall β in L 6 α.degree ← α.degree + 1 7 β.degree ← β.degree + 1 8 Insert(β, α.adj) 9 Insert(α, β.adj) 10 if (β.type = center) 11 Insert(β, α.centers) 12 else 13 β.inQ ← true 14 Enqueue(β, Q) 15 endif 16 endfor 17 α.inQ ← true 18 Enqueue(α, Q) 19 while (Q 6= ∅) 20 φ ← ExtractMax(Q) 21 if (φ.centers = ∅) 22 φ.type ← center 23 forall β in φ.adj 24 Insert(φ, β.centers) 25 endfor 26 else 27 if (∀δ ∈ φ.centers, δ.degree < φ.degree) 28 φ.type ← center 29 forall β in φ.adj 30 Insert(φ, β.centers) 31 endfor 32 forall δ in φ.centers 33 δ.type ← satellite 34 forall µ in δ.adj 35 Delete(δ, µ.centers) 36 if (µ.inQ = false) 37 µ.inQ ← true 38 Enqueue(µ, Q) 39 endif 40 endfor 41 endfor 42 endif 43 endif 44 φ.inQ ← false 45 endwhile
ures 9 and 10 show the experimental data. Note that the number of broken stars is roughly linear in the number of vertices, the running time is linear in the number of edges in the graph, although we can see the effects of lower order terms.
We evaluated the on-line star cover algorithm on a 2224 document corpus consisting of a judged subcollection of TREC documents augmented with our department’s technical reports. We ran 4 experiments. Each time we selected a different threshold and proceeded to insert the 2224 documents in random order, using the on-line star cluster algorithm. The results of these experiments were averaged. The running time measurements appear to be linear in the number of edges of the similarity graph. Fig-
200 150 100 50
0
400
800 1200 1600 number of vertices
2000
Figure 9: The dependence of number of broken stars on the number of vertices for TREC data.
1.6e+08 1.4e+08 1.2e+08 1e+08 8e+07 6e+07 4e+07 2e+07 0 0.0e+00 2.0e+05 4.0e+05 6.0e+05 8.0e+05 1.0e+06 number of edges
Figure 10: This figure shows the dependence of the running time of the on-line star algorithm on the number of edges in a TREC subcollection.
4 Figure 8: The on-line star algorithm for clustering.
250
0
aggregate running time (clock ticks)
the fact that the likelihood of breaking any individual star is also small [APR97].
Discussion
We have presented, analyzed, and evaluated the star clustering algorithm for information organization. We described an off-line version of this algorithm that can be used to organize static information in accurate clusters efficiently. We also described an on-line version of the algorithm that can be used to organize dynamic data for tasks that require incremental updates in the topic structure of the corpus, such as the routing task, the new topic detection task, and the topic tracking task. Our implementation of this algorithm contributes a novel visualization method for clusters that presents users with
disks whose radii correspond to the cluster size and that are embedded in the plane so as to capture the topic distance between the clusters. We evaluated the star algorithm by comparing it against the single link and the average link algorithms in several experiments with TREC data. We found that the star algorithm outperforms the single link algorithm and the average link algorithm. Since the star algorithm is faster and easier to implement and than the average link algorithm, we advocate its use. The on-line algorithm produces the same clustering as the off-line algorithm. Thus, our evaluation of the off-line star algorithm also suggests using the on-line star algorithm for tasks that require computing the topic structure incrementally and adaptively. Our findings so far suggest using the star algorithm for a variety of tasks. We are currently conducting experiments using the on-line star algorithm for new topic detection and topic tracking. Because of its cluster quality, efficiency, and incremental properties, we believe this algorithm will lead to improved results in solving these tasks.
Acknowledgements We thank James Allan for many useful comments and suggestions on this research. This work is supported in part by ONR contract N00014-95-1-1204, Rome Labs contract F30602-98-C-0006, and Air Force MURI contract F49620-97-1-0382. We are grateful for this support.
References [AB84] M. Aldenderfer and R. Blashfield, Cluster Analysis, Sage, Beverly Hills, 1984. [All95] J. Allan. Automatic hypertext construction. PhD thesis. Department of Computer Science, Cornell University, January 1995. [All98] J. Allan, Personal communication, March 1998.
[CCFM97] M. Charikar, C. Chekuri, T. Feder, and R. Motwani, Incremental clustering and dynamic information retrieval, in Proceedings of the 29th Symposium on Theory of Computing, 1997. [Cro80] W. B. Croft. A model of cluster searching based on classification. Information Systems, 5:189-195, 1980. [Cro77] W. B. Croft. Clustering large files of documents using the single-link method. Journal of the American Society for Information Science, pp189-195, November 1977. [CKP93] D. Cutting, D. Karger, and J. Pedersen. Constant interaction-time Scatter/Gather browsing of very large document collections. In Proceedings of the 16th SIGIR, 1993. [FG88] T. Feder and D. Greene, Optimal algorithms for approximate clustering, in Proceedings of the 20th Symposium on Theory of Computing, pp 434-444, 1988. [HP96] M. Hearst and J. Pedersen. Reexamining the cluster hypothesis: Scatter/Gather on Retrieval Results. In Proceedings of the 19th SIGIR, 1996. [HS86] D. Hochbaum and D. Shmoys, A unified approach to approximation algorithms for bottleneck problems, Journal of the ACM, no. 33, pp533-550, 1986. [JD88] A. Jain and R. Dubes. Algorithms for Clustering Data, Prentice Hall 1988. [JR71] N. Jardine and C.J. van Rijsbergen. The use of hierarchical clustering in information retrieval, Information Storage and Retrieval, 7:217-240, 1971.
[APR98] J. Aslam, K. Pelekhov, and D. Rus, Generating, visualizing, and evaluating high-accuracy clusters for information organization, in Principles of Digital Document Processing, eds. C. Nicholas, Lecture Notes in Computer Science, Sprinter Verlag 1998 (to appear). Also available as Technical Report PCS-TR97-319, Department of Computer Science, Dartmouth, 1997.
[KP93] G. Kortsarz and D. Peleg. On choosing a dense subgraph. In Proceedings of the 34th Annual Symposium on Foundations of Computer Science (FOCS), 1993.
[APR97] J. Aslam, K. Pelekhov, and D. Rus, Computing Dense Clusters On-line for Information Organization, Technical Report PCS-TR97-324, Department of Computer Science, Dartmouth, 1997.
[LY94] C. Lund and M. Yannakakis. On the hardness of approximating minimization problems. Journal of the ACM 41, 960–981, 1994.
[Bol95] B. Bollob´ as, Random Graphs, Academic Press, London, 1995. [Bur95] R. Burgin, The retrieval effectiveness of five clustering algorithms as a function of indexing exhaustively, Journal of American Society for Information Science 46(8:562-572, 1995. [Can93] F. Can, Incremental clustering for dynamic information processing, in ACM Transactions on Information Systems, no. 11, pp143-164, 1993.
[LLR95] N. Linial, E. London, and Y. Rabinovich. The geometry of graphs and some of its algorithmic applications. Combinatorica 15(2):215-245, 1995.
[Rij79] C.J. van Rijsbergen. Information Retrieval. Butterworths, London, 1979. [Sal89] G. Salton. Automatic Text Processing: the transformation, analysis, and retrieval of information by computer, Addison-Wesley, 1989. [Sal91] G. Salton. The Smart document retrieval project. In Proceedings of the Fourteenth Annual International ACM/SIGIR Conference on Research and Development in Information Retrieval, pp 356-358. [Sha86] W. Shaw, On the foundation of evaluation, Journal of the American Society for Information Science, vol 37, pp 346-348, 1986.
[Sha93] W. Shaw, Controlled and uncontrolled subject descriptions in the CF database: a comparison of optimal cluster-based retrieval results, Information Processing and Management, vol. 29, pp 751-763, 1993. [SJJ70] K. Spark Jones and D. Jackson. The use of automatically-obtained keyword classifications for information retrieval. Information Storage and Retrieval, 5:174-201, 1970. [Tur90] H. Turtle. Inference networks for document retrieval. PhD thesis. University of Massachusetts, Amherst, 1990. [vRC75] C.J. van Rijsbergen and B. Croft, Document clustering: an evaluation of some experiments with the Cranfield 1400 collection, Information Processing and Management, 11, 171-182. [Voo85] E. Voorhees. The effectiveness and efficiency of agglomerative hierarchical clustering in document retrieval, PhD Thesis, Department of Computer Science, Cornell University 1985, available as TR 85705. [Voo85] E. Voorhees. The cluster hypothesis revisited. In Proceedings of the 8th SIGIR, pp 95-104, 1985. [Wil88] P. Willett. Recent trends in hierarchical document clustering: A critical review. Information Processing and Management, 24:(5):577-597, 1988. [Wor71] S. Worona. Query clustering in a large document space. In Ed. G. Salton, The SMART Retrieval System, pp 298-310. Prentice-Hall, 1971. [Zuc93] D. Zuckerman. NP-complete problems have a version that’s hard to approximate. In Proceedings of the Eight Annual Structure in Complexity Theory Conference, IEEE Computer Society, 305–312, 1993.