Replace this file with prentcsmacro.sty for your meeting, or with entcsmacro.sty for your meeting. Both can be found at the ENTCS Macro Home Page.
Static and Dynamic Strategies to Understand C Programs by Code Annotation Mario M. Ber´on, Pedro R. Henriques
1,2
University of Minho Department of Computer Science Campus de Gualtar 4710 - 057 Braga, Portugal
Maria Jo˜ao Varanda Pereira 3 Polytechnic Institute of Bragan¸ca Campus de Sta. Apol´ onia Apartado 134 - 5301-857, Bragan¸ca, Portugal
Roberto Uzal 4 University of San Luis Department of Computer Science San Luis, Argentina
Abstract In this paper we present strategies aimed at understanding program written in C language. These strategies use the code annotation technique to extract information from programs. With these strategies we can define the architecture of a comprehension system that allows us to integrate multiple views important to understand the application under analysis. These views are presented in different abstraction levels, and the user can navigate between them. Both features (views and navigation) are useful because they can be used to carry out various program understanding approaches, similar to our mental models. In order to implement these features we define: a scheme to recover static and dynamic information; and an way to manage this information. Furthermore, with the purpose to facilitate the program understanding process we describe a procedure aimed at relating the problem and program domains denominated BORS (Behavioral-Operational Relation Strategy). Key words: program understanding, information extraction, information visualization, program comprehension, BORS.
c 2007 Published by Elsevier Science B. V. °
Beron, Henriques, Varanda, Uzal
1
Introduction
PCVIA, Program Comprehension by Visual Inspection and Animation, is a research project looking for technologies and tools to help the software engineer in the analysis and comprehension of (traditional or web-oriented) computer applications in order to maintain, reuse, and re-engineer software systems. To build up a Program Comprehension environment we need tools to cope with the overall system, identifying its components (program and data files) and their relationships; complementary to those, other kind of tools is also necessary in order to explore individual components. These fine grain tools are concerned with programs instead of applications, and their purpose is to extract and display static or dynamic data about a program to help the analyst to understand its structure and behavior. The Program Comprehension (PC) is a subfield of Software Engineering (SE) aimed at elaborating methods, models and techniques to facilitate the process of understanding programs. This subfield presents many challenges because the underlying algorithms are difficult to implement and they are not good enough to produce an useful program comprehension. For this reason, it is very important to conceive new strategies with the objective of reducing the gap between the algorithms following by a program to build its output and the user understanding about it [6] [3]. A very attractive, if not the main and better, approach to attack this problem is to build tools that allow us to obtain different views of the system under study and navigate between them. Normally, these views corresponding to different abstraction levels. This characteristic allows the user inspect the system in any abstraction level and then helps him to adapt the comprehension process to his knowledge about the problem domain. In order to build the views defined above, it is necessary to extract information from the programs. We think that making both, static and dynamic information available is useful. The first is important because allows us to present classical views such us Module Communication Graph, Function Communication Graph, etc. The second allows to get information about the system’s behavior and complementing the static analysis. On the other hand, we think that the integration between them permit to build important views and relations in order to improve the PC. We apply traditional compiling techniques to extract static information but, for the dynamic information extraction, we define new strategies that allow us to follow the execution flow and to understand the task made by the system to build its output. 1
This work was developed in the context of PCVIA, a Portuguese research project sponsored by FCT under the contract... 2 Email: {marioberon,prh}@di.uminho.pt 3 Email:
[email protected] 4 Email:
[email protected]
2
Beron, Henriques, Varanda, Uzal
With our approach, we deal with a difficult challenge in PC context that consists in relating two levels: Operational (at program domain) and Behavioral (at problem domain). The first is concerned with objects like functions, data, types, etc. that are used to build the output; the second describes the problem domain objects this, of course, depend on the application. This approach was proposed by Brooks twenty nine years ago. Brooks [13] stated that program comprehension could be improved if is possible to get a good relation between both program and problem domains, because the user can understand exactly the operations (program domain) executed by the system to build each object of its output (problem domain). We believe that our strategy give an answer to Brook’s challenge. We consider this last task the main result obtained in our investigation. The paper is organized in the following way. Section 2 describes the characteristics of a comprehension system characteristics; Section 3, presents the strategies used for information extraction; Section 4 illustrates the application of our technique to a case study. Finally, section 5 present, the conclusion and future work.
2
A Comprehension System
In this section we explain the characteristics that a good Comprehension System must have to provide multiple views of an Application. We describe the interesting views, the relation between them. Finally, we present a strategy to relate program and problem domains. 2.1 Important Views of a System Normally when the user wants to understand a system he needs to inspect different aspects of that program. For this reason, program comprehension tools must recover information an represent it using approaches that help the user to understand the program under analysis [10]. We conceptualize these representations as system views. There are many important system views each one acquire importance depending on the level of abstraction used to study the system. In this sense, we can think that lower level corresponds to the system assembly code of the functions that conform the system. This view can be useful to the user interested in to improve the efficiency of the generated code by the compiler. Furthermore, when is not possible to have the source code is good idea to inspect the assembly code to build system views and understand its functionalities. In other way, the more natural view is the system source code. It is because the user commonly use the programming language. However, it is not enough because generally the systems are too complex. To attack this problem is necessary to find other system representation 3
Beron, Henriques, Varanda, Uzal
more simple [5]. An approach possible is the Call Function Graph (CFG). CFG is defined in the following way: CFG=(P,E) where P = {x | x is a system function } and E= {(x, y)|x ∈ P ∧ y ∈ P ∧ x call y } this view a good but in the same form that the source code, when the number of functions is to high, this alternative is not enough to help the PC process. The reader can see the example showed in the case study (see section 4). Other possibility to reduce the view complexity is present the module communication graph (MCG). MCG can be seen as an abstraction of CFG. MCG is defined in the following as we show below: MCG=(P,E) where P = {x | x is system module} and E = {(x, y)|x ∈ P ∧ y ∈ P ∧ x be communicate with y through the f unction f def ined in y } Finally other interesting view shows only a piece of the CFG that was used in the system execution. It is important because show only the system component used to build the result. From the discussion above we can distinguish the following views: (i) Machine (ii) Program (iii) Function and data used at runtime (iv) Function (v) Module (vi) Behavioral With the Machine Level we want to describe the assembly code used to implement the system functions. With the Program Level we describe the source code. With the Function and Data used at runtime level we want to denote the recovered dynamic information. With the Function Level we want to symbolize the recovered static information at function level. The Module Level represents the recovered static information at module level. Finally the last level, Behavioral, is concerned with the system output. We consider the first five levels as Program Domain Levels and the last level as Problem Domain Level. Each level acquires importance depending on the program inspection state.
4
Beron, Henriques, Varanda, Uzal Operational Visualizer
Level 1
Level 2
Visualization and Navigation Manager
System under Analysis Information Extraction System
Level 4
Module 1
Module 2
Level 3
Static Information Extractor Information Dynamic Information Extactor
Level 5
Repository
Module n
Level 6
Behavioral Visualizer
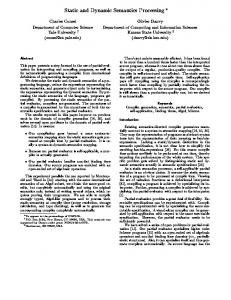
Fig. 1. Program Comprehension Tool Architecture
2.2 Program Comprehension Tool Architecture Simply to provide various views is an important characteristic of a PC tool but we believe that it is not enough. PC tools also give direct access to a view at any level and navigate between them [8]. In other way, the user can be working at a specific abstraction level and them wish to access the information defined in a different level. Yet more problematic, the user can change the abstraction level depending on the system aspect under analysis. Figure 1 shows an architecture [7] that supports these main requirements. The first two levels are represented naturally by the assembly and source code. The third level can be represented by a function list or using an feTree (see section 2.4). We think the fe-Tree representation is better once it allows the user to know the relation called-caller clearer. The level 4 and 5 are represented by two graphs: The Module Communication Graph (MCG) and Function Call Graph (FCG). We intend to display these graphs as layered directed graphs, because the relation between the different components (functions or modules) is normally hierarchical. Therefore a graph with these characteristics is more adequate to represent it. The last level representation consists on the system output. The block diagram of the architecture in Figure 1 shows an information repository. The information extracted from the application and available in this repository is the following: (i) Runtime functions (a) Name (b) Module (c) Place (ii) System Modules (a) Name (b) Directory (c) Functions and data defined in the module, 5
Beron, Henriques, Varanda, Uzal
(d) FCG for this module (iii) System functions (a) Parameters (b) Local variables (c) Module where the function is defined (iv) System MCG (v) Study system FCG The Visualization and Navigation Manager can produce an animated trace. Actually this trace is made in a top-down traversal way, beginning from highest program domain abstraction level to lowest program domain abstraction level. To carry out this task our approach uses the recovered runtime functions. MCG is shown on the screen; then the module corresponding to the executed function is illuminated; then FCG is shown and the node that identifies the function is illuminated, if the user wishes, the function source code is shown and finally the object code is presented on the screen. This process is repeated until all the executed functions have been consumed. This animated trace can be made in automatic mode or in step-by-step form. In the first case, the computer introduces a delay between the different steps. In the second case, the user decides when to step to the next phase. Furthermore, the architecture diagram in Figure 1 shows relations between different levels. In the following section we explain how these relations are implemented. Finally, the information extraction system uses the techniques defined in section 3 to fill the information repository. 2.3 Approaches to Navigation In this section we describe a possible approach to carry out the navigation between the different abstraction levels defined in subsection 2.1. Relation between Levels 1 and 2 The relation between levels 1 and 2 is implemented by applying a command to inspect the wished module object code (objdump). Therefore the relation is direct. Each source module has its proper object module and it can be disassembly to get the corresponding assembly code. Having the source and assembly codes is possible to navigate between them. For example, sometimes the user can be interested in seeing the specific function object code. This task easily carried out because the assembly code produced by the objdump command has a specific format. Therefore, we can get the function definition using the grep command with the appropriate pattern. Then, it is possible to look up the function in the next level. In this case, we have two possibilities: i) use the grep command and ii) use the information repository. Both are adequate to carry out this task. The navigation from level 2 to level 1 is implemented in a similar form. First we need to look up the desired function in the source code and 6
Beron, Henriques, Varanda, Uzal
then we disassembly the object code and look up the function name in the assembly code using the grep command. Relation between Levels 2 and 3 The relation between levels 2 and 3 is implemented using our code annotation strategy (see section 3 and the static analysis necessary to implement it). Through the dynamic information we recover the runtime function. Through the static analysis we record the modules and their places in secondary memory, the functions and their positions in the corresponding module, the data and their definition as well as the places where they are referenced. All this information is stored in the architecture information repository. The navigation between both levels is simple because all information is available in the information repository, ie, it is only is necessary to look up the information in that place. Relation between Levels 3 and 4 The relation between levels 3 and 4 is implemented directly using the information repository. Relation between Levels 4 and 5 The relation between levels 4 and 5 is simple because from the static analysis we know which are the functions defined in the system and to which module they belong. All these information is available in the information repository. Relation between Levels 5 and 6 The relation between levels 5 and 6 is too complex. We define an procedure aimed at resolving this problem, which is explained in subsection 2.4. 2.4 BORS To relate the operational and behavioral views, we will use the program execution flow. Our strategy to capture the execution flow (as will be described in section 3) give us the functions used to build the output. On the other hand, we know a list of the problem domain objects because we can observe the system output. Mixing the knowledge about the program and problem domain, we can develop a strategy to reach our purpose. To start we change the form of seeing at the available information and then we define a procedure to manage. The list of runtime functions can be seen as a tree. With this data structure we can represent adequately the called-caller relation defined between the functions of the system. This approach of looking at the function is better than a simple function list because it is possible to identify more clearly the functionality of each individual function. The description of a function is given by all functions called directly or indirectly by the function under study. Assuming that A,B,C,D,E,F,G are functions used by a hypothetic system to build its output and observing Figure 2 on left hand side. We note that it is not possible to identify the description of the any functions. On the other hand, if we use a tree, like in the right hand side of the Figure 2 to represent this information this problem can be successfully studied. 7
Beron, Henriques, Varanda, Uzal MAIN
MAIN
A
A B B
C
C
D
D
E E F
F
G
G
Fig. 2. Function list vs. feTree
Observe again the Figure 2 on right hand side is clear how get the explanation for each function. For example, the description of the function A is composed by the functions B and C, and function D is composed by the functions E and F. Finally, function G can not expressed in terms of other function. This characteristic justify our preference for representing the runtime function as a tree instead of a list of runtime function. We denominate this tree fe-Tree (Function Execution Tree) [1]. A fe-Tree is a tree with arity r where: (i) The fe-Tree root is the first function executed by the system (normally called main), and (ii) For each node (function) n, its descendent are the functions invoked directly by n at execution time. With the fe-Tree we can explain any function in the system. Furthermore, we can know the different context where the functions were invoked. For this reason, we can use the fe-Tree to inspect only the aspects considered important by the user. The aspect selection is decided by the user. For example, sometimes could be important to inspect the functionality of some abstract data type. In other occasion, the focus can be a specific function. Therefore, the system aspects are composed by a function set and the description of these aspects is composed by the description of each component function. If we use a fe-Tree to inspection aspects we can recover the function context and reduce the fe-Tree to a subtree of it. The function context is important for code inspection because the user can 8
Beron, Henriques, Varanda, Uzal
know the exact places where the function has been used. The fe-Tree reduction is important because it reduce significatively the amount of information. In other way, consider, for simplicity, that the system under analysis was written following the concepts of abstract data type (ADT). If this approach is used it is natural that each problem domain object is implemented by an ADT. Then, it is clear that they have well defined data and function. The data representing the problem domain object state, while the functions implement the transition between the different states. This characteristics are commonly implemented in C language using a header (file .h) to declare the ADT data and another file (file .c), where we can find all the operations related with the ADT. If we furthermore think that each problem domain object is implemented with an ADT, then we can reach the expected relation. In the following paragraphs we describe BORS (Behavioral-Operational Relation Strategy), a strategy aimed at relating the bevioral and operation views based in problem domain object observation and system ADT inspection. BORS has three steps clearly defined: (i) Detect the functions related with each Problem Domain Object (ii) Build a fe-Tree with the function used in runtime (iii) Explain the functions found in step i using the tree built in step ii. The first step is carry out recovering the ADT interface. This task is simple (assuming that the system is implemented with the ADT concepts). We need to extract the functions defined in the corresponding file .c. The second step consist in using the runtime information. We need to know which functions were used to build the system output, and furthermore it is necessary to know when to begin and end each function (all this information is extracted using the scheme describe in the following sections). The third step is implemented applying a breath-first traversal to visit each fe-Tree node. When the name of a visited node match some name of the function selected to be described we report the corresponding subtree. Figure 3 shows an example that illustrates this procedure. On left hand side is the hypothetic system fe-Tree and on right hand side is the list that contains the functions selected by the user. In this Figure, the reader can see the explanation for each functions.
3
Information Extraction
To define a strategy to annotate the source code [2] [4] we need to answer two important questions: i) which is the relevant system information to extract and ii) which are the strategies points in the source code The answer to the first question is clear; the more important system in9
Beron, Henriques, Varanda, Uzal system aspects / functions
fe−Tree
g
context
f
context
i
g
j
h
i
m
n
l
k
o
p explanation
q
r
explanation
Fig. 3. Strategy to explain system aspects
int f(int x, int y) {float z,y; /*more declarations*/ INPUT_FUNCTION("f") ........... /*actions*/ OUTPUT_INSPECTOR("f"); return value; }
int f(int x, int y) {float z, y; /*more declarations*/ .......... /*actions*/ return value }
Table 1 Insertion of Inspection Functions
formation is given by its global variables because they represent the system state. The function local variables only represent memory places necessary to produce changes in the system state. The answer to the second question is: we can know the global variables state at the beginning and at the end of each function. In other words, we can look at the system as a big state machine where each state is composed by its global variables and the transitions are determined by the execution of its functions. 3.1 Function Handling To implement the strategies describe in section 3, we need to build parser for the source language with the appropriate semantic actions to incorporate the sentences that allow us to show the states and the transitions between them. The sentences inserted are inspection functions that show the function names used by the system. Table 1 shows the scheme. The problem with this approach is that the recovered information is huge. 10
Beron, Henriques, Varanda, Uzal
{ 1 for(init.; cond.; action) {actions; 2; } 3 }
for(init.; cond.; action) actions;
Table 2 Iteration Control: Check Points
This is because the functions can contain loops and inside loops we can have more function calls. Therefore, we need to annotate the code in such a way that allows us to control the repetitive statements. The idea to overcome this problem is to insert control statements in iterations. We distinguish three main points (indicated in Table 2 on the right side). In 1 and 3, we insert a control function showFunction(value). In 2, we insert another control function called dec(). The function showFunction(value) enables the inspector functions to show the called functions during the iteration. The parameter value and the dec function will be described after explaining the control scheme. Besides these functions we also need a stack. It is so because the program can have nested iteration sentences and the user may want to see the functions invoked during the iterations a given number of times. To better understand this situation, please consider the code segment of Table 3.a and assume that the user wants to see, once or several times, the functions invoked during the iteration. The code transformation can be seen in Table 3.b. The parameter value is used to indicate the number of times that the functions within the loop will be showed. The function dec decrement the parameter value each time that it is executed. When the parameter value is zero the inspection function do not show the function name. 3.2 Data Handling In order to know the data used in runtime and increment the scheme defined in subsection 3.1 with the state recovery, we need to extract the data defined in the study system. To reach our purpose we add the necessary semantic actions to the ANSI-C parser and save all the information recovered in a hash table. The process resulted is not as simple as function extraction because the C language allows data definition too complex. This data definition implies the definition of so many anonymous type and this characteristic complicates the information extraction about data. Let us observe the C declaration below: 11
Beron, Henriques, Varanda, Uzal
{showFunction(value); for(i=0;i