GFAP (a protein expressed by astrocyte cells), and blob-shaped nuclei (labeled with ... CCL algorithms segment the domain of a binary image into partition that ...
Statistical 3D Segmentation With Greedy Connected Component Labelling Refinement Jiuxiang Hu1,2
Gerald Farin3
Matthew Holecko II1 Anshuman Razdan2
Stephen P. Massia1
Gregory Nielson3
Bioengineering Dept1 , PRISM Lab2 , and Computer Science Dept3 , Arizona State University
Abstract A new approach for segmenting 3D voxel data sets is presented. It is semi-automatic and consists of two phases. First, the initial segmentation is accomplished by voxel labeling using statistical maximum likelihood estimation techniques. The novelty of the present approach is that the type probability distribution function is not required a priori. A multi-parameter distribution which includes a variety of widely applicable distributions is utilized. The second phase refines the segmentation by the use of a new greedy connected component labeling (GCCL). The overall effectiveness of this new approach is illustrated with data examples of multichannel laser scanning confocal microscope (LSCM) images where the structure of GFAP (a protein) and nuclei, and the geometry of an electrode implant are extracted. CR Categories: I.4.6 [Image Processing and Computer Version ]: segmentation—Region growing, partitioning; I.4.10 [Image Processing and Computer Version]: Image Representation— Statistical, Volumetric Keywords: LSCM images, Weibull statistical model, voxel labelling, greedy connected component labelling, 3D segmentation
1
Introduction
Multichannel laser scanning confocal microscopy (LSCM) equipped with a specific laser/filter combination to collect multiple fluorescence signals in a single scan is applied increasingly in experimental biological investigation. In our application, the confocal 3D images collected from two channels. The stack of 2D images (each 2D image referred to as a slice) make up the volumetric data [Razdan et al. 2001]. A typical section is from 10 ∼ 100 µ m. It is composed of different shaped structures, for example, tree-shaped GFAP (a protein expressed by astrocyte cells), and blob-shaped nuclei (labeled with a DAPI stain) and sheet-shaped electrode implants. The segmentation of these regions can yield important biological information [Sarti et al. 2000]. For example, segmentation and subsegment determination of GFAP volume allows for quantitative analysis of the immune response to the implanted electrode [Turner et al. 1999]. In LSCM in particular, measurement of the relative positions of regions labeled with different cells/implants
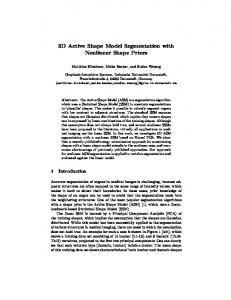
Figure 1: Test bed for our volumetric segmentation scheme, the right one, denoted by (a), shows an LSCM image of GFAP-labeled astrocytes and DAPI stained nuclei, in which the green highlights regions targeted with GFAP labeled astrocytes, and the red regions identify DAPI, which consistently targets nuclei cells. The left one, denoted by (b), shows a LSCM image of GFAP-labeled astrocytes and electrode implant, in which the red targets implant and the green GFAP. Both are rendered by MIP in 3D.
can provide an insight into their inter functional relationship. Due to image noise and different shapes of the cells/implants to be segmented, considerable effort is required to develop accurate image segmentation for localizing the structures. Recently, several probabilistic frameworks to determine algorithms for the segmentation in an image have been given [Chanda et al. 1988][Lee 1998][Chesnaud 1999][Chakraborty and Duncan 1999][Li et al. 2001]. It is now well known that to obtain efficient algorithms, the statistical properties of voxels should be taken into account. Members of the exponential family includes Gaussian, Gamma, Rayleigh, Poisson, and other familiar distributions [Chesnaud 1999] that have been used to model real data. Indeed, there are several kinds of 2D images for which the pixel values are correctly described by such statistical law. Gaussian distribution [Li et al. 2001] is widely used to characterize the probabilistic feature of random variables of an image. In [Chanda et al. 1988], some ultrasonic medical images are modelled using Rayleigh’s law. In [Lee 1998], Astronomical images have been presented using Poisson distribution and compared to the classical linear intercorrelation technique. In [Chesnaud 1999], the authors assumed that the probability density function (pdf ) of the random fields, which describe the gray levels in the input image, belongs to the exponential family. However, a pdf with a single distribution shape [Li et al. 2001] will limit the use of the segmentation approach, and asks users to distinguish the different pdf s of input images. In this paper, we use the Weibull pdf, whose kernel shape can be controlled by selecting different parameters (see Section 2). When a statistical model-based method is used, both voxel and its neighbors should be considered, to estimate the parameters of the pdf for each voxel [Chesnaud 1999][Li et al. 2001]. Then, a
Research, OnlinID paper-0017
2 g(a)
0
0.7
2.1
9.8
3.05 {4.60 0.71 0.48 0.36 0.28 0.23 0.19 0.16 {0.71 0.30 0.54 0.68 0.71 0.65 0.59 0.40 {0.55 0.73 0.87 0.96 0.98 0.91 0.78 0.62 {1.08 1.36 1.68 2.03 2.38 2.70 2.95 3.07
Figure 2: Plot of Weibull distribution equation (1) with different shape parameters a and scale parameter b = 1.2 and v0 = 0
histogram, called the Weibull a-b histogram, is generated. Using voxel labeling guided by the Weibull a-b histogram, the initial segmentation result can be obtained. However, due to the unavoidable noise in LSCM images [Manders et al. 1992], the initial segmentation is quite coarse, e.g. this results in many isolated small regions. In order to overcome the problem, we introduce a new algorithm of connected component labeling (CCL), called Greedy Connected Component Labeling (GCCL), to delete the unwanted small regions. CCL algorithms segment the domain of a binary image into partition that corresponds to connected components. CCL is one of the fundamental segmentation techniques used in image processing [Moga and Gabbouj 1997]. The classical CCL algorithms pay more attention to the cost of memory but not time complexity. The most common approach to avoid making several passes over the image is to process the image in a sequential order and keep an equivalence table that stores the information about the equivalence of labels assigned to the voxels from the same component. In [Khanna 2001], two passes in which the image is scanned in raster order are used, and the size of equivalence table is bounded to O(N) for a N ×N 2D raster image. Due to the increase in the size of 3D image, GCCL takes into account the computation time cost as well as the smaller size of the equivalence table. In our GCCL algorithm, one pass for a 3D image is used, the size of local equivalence table is O(the width of connected component), and the time cost is O(N) with low constant, where N is the number of voxels in the image. We have tested our algorithm using LSCM volume data shown in Figure 1. Figure 1(a) shows a LSCM image of GFAP-labeled astrocytes and DAPI stained nuclei, in which the green indicates regions targeted with GFAP-labeled astrocytes, and the red regions identify DAPI, which consistently targets nuclei cells. Figure 1(b) shows a GFAP and implant LSCM image, in which the red targets electrode implant devices and the green GFAP. Figure 1(a) and 1(b) are rendered using maximum intensity projection (MIP) [Razdan et al 2001]. In Section II, we introduce Weibull statistical modeling and describe how to create a Weibull a-b histogram and how to obtain an initial segmentation. In Section III, we discuss segmentation refinement using GCCL. This is further extended to demonstrate the accuracy and reproducibility of the algorithms in Section IV, where we apply the algorithm to real LSCM images. Finally, future work is discussed in Section V.
2 2.1
Statistical Image Model Weibull Modelling
Consider a 3D image I organized as a stack of 2D transverse slices, and the grid point set is denoted by I, whose size is Nx × Ny × Nz where the intensity of each voxel (i, j, k) ∈ I is given by v(i, j, k). The Weibull probability density function (pdf ) of gray level of each
a 0.14 0.12} 0.28 0.17} 0.45 0.29} 3.03 2.80}
Figure 3: Plot of function g(a) defined by equation (3) for four samples which are generated by Weibull pdf with b = 1.2, and v0 = 0.0 and a = 0.7, 2, 3, or 10, respectively. And 0.7, 2.1, 3.05 and 9.8 are the roots of g(a) = 0 corresponding to the samples.
voxel is given by [Suhir 1997][Hirose and Hideo 1996] p(v) =
a b
µ
v − v0 b
¶a−1
· µ ¶ ¸ v − v0 a exp − , b
(1)
where v ≥ v0 , a ≥ 0, b ≥ 0, v0 ≥ 0, and v is the gray level of the voxel, a is a shape parameter, b is a scale parameter, and v0 is a shift parameter (the minimum possible value of the random variable). This triparametric distribution was introduced in 1939 by Swedish engineer, W Weibull, on empirical grounds in the statistical theory of the strength of materials. It can be shown that when a = 1.0, it is the Possion pdf ; and when a = 2.0, one has the Rayleigh pdf, and when a = 3.0, it turns to the Gaussian pdf. When a À 1, the distribution tends to a uniform pdf. Therefore, the Weibull model is a suitable model to fit the histogram distribution of these images and these regions in them whose statistical properties are unknown since the kernel shape can be controlled by selecting different a value. Figure 2 gives Weibull distribution equation (1) with different the shape parameters a and the scale parameter b = 1.2 and the shift v0 = 0. For LSCM imaging, the minimum possible intensity value is zero, i.e. v0 = 0. Therefore, in the next part of this paper, we assume that the shift parameter of the Weibull distribution satisfies v0 = 0. We assume that the observed image I is composed of two zones: the target having one (or several) simple connected region(s) and the background. Under this assumption, the target in the image is completely defined by a binary image T = {T (i, j, k)|(i, j, k) ∈ I} that defines a certain shape for the target so that T (i, j, k) is equal to one within the target and to zero elsewhere. Thus, the target in the image is the region: ΩT = {(i, j, k) ∈ I|T (i, j, k) = 1} . The purpose of segmentation is, therefore, to estimate the binary image T for the target in the image. Without more a priori knowledge about the target, we first introduce the maximum likelihood estimation to compute the Weibull parameters.
2.2
Maximum Likelihood Estimation
The parameter estimates obtained using the maximum likelihood technique are unique, and as the size of the sample increases, the estimates statistically approach the true values of the sample. Let v1 , v2 , · · · , vn represent n voxels of image. It is assumed that the intensity of each voxel is characterized by the Weibull distribution. The likelihood function associated with the sample is the joint density of n random variables, and thus is a function of the unknown Weibull distribution parameters (a, b). The likelihood function for a sample under these assumptions is given by the expression [Hirose and Hideo 1996] n
L(a, b) = ∏
i=1
³a´³v ´
h ³ v ´a i i exp − . b b i
b
(2)
Research, OnlinID paper-0017
3 N(a, b)=0
r
r
r
r
r
r
r
r
r
r
r
r N r¾ O r¾ P r
r
r
r
r
r
r
r @ I @ r I r¾ Q r r r J r @ Kr @ I 6 @ r Er r @ r Fr Gr Hr 6 6 I @ @ r Ar @ r r Br Cr Dr
r
r
r
r
r
r
r
r
r
r
r
0.0 ≤ log( N (a, b) < 0.5
0.5 ≤ log( N (a, b) < 1.0
1.0 ≤ log( N ( a, b) < 1.5 1.5 ≤ log( N (a, b) < 2.0 2.0 ≤ log( N (a, b) < 2.5 2.5 ≤ log( N (a, b) < 3.0
log( N ( a, b) > 3.0
Figure 4: The Weibull parameter a-b histogram for the LSCM image shown in Figure 1(a) and the color legend, where N(a, b) is the number of voxels which satisfy Weibull parameters are a, and b
The parameter estimates are determined by taking the partial derivatives of the logarithm of the likelihood function with respect to a and b and equating the resulting expressions to zero. The system of equations obtained by differentiating the log likelihood function for a sample is given by [Hirose and Hideo 1996] " Ã !#1/a n a n 1 n a 1 . ∑i=1 vi ln(vi ) 1 − ∑ ln(vi )− = 0, b = . g(a) = ∑ vi n i=1 a n i=1 ∑ni=1 vai (3) In order to find the parameter a from equations (3), we first introduce a function g(a) defined by equation (3). For any sample v1 , v2 , · · · , vn with vi > 0(1 ≤ i ≤ n) , we can directly compute that the derivative that satisfies g0 (a) > 0, and so g(a) is a monotonic ascending function with shape parameter a, and lima→0+ g(a) = −∞, and lima→∞ g(a) = k ln(max(vi )) − 1n ∑ni=1 ln(vi ) > 0 , where k ≥ 1 is the number of the elements, which reach the maximum in the set {v1 , v2 , · · · , vn }. Therefore, for any sample v1 , v2 , · · · , vn with vi > 0(1 ≤ i ≤ n) , g(a) has one and only one positive root. Figure 3 shows the plot of function g(a) for different samples. Once a is determined, this value is inserted into equation (3) and b is calculated directly. From equation (3), it is easy to see that b is the a-moment of sample v1 , v2 , · · · , vn with vi > 0(1 ≤ i ≤ n) , and a indicates the deviation of this sample. The less deviation, the larger the root of equation g(a) = 0 (see Figure 3 ). By the analysis above, we can use the bisection algorithm to solve equations (3) and get the Weibull parameters.
2.3
Voxel labelling by Weibull a-b Histogram
Once the Weibull model is obtained, the segmentation problem amounts to assigning labels to each voxel in the volume. A straightforward way is to label voxels as the target or the background by maximizing the individual likelihood function. This approach is called ML classifier, which is equivalent to a multiple thresholding method. Usually, this method may not achieve good performance since there is a lack of local neighborhood information to be used to make a good decision [Wang et al. 2001]. Therefore, we incorporate the local neighborhood information at a voxel into a labeling procedure, thus improving the segmentation performance. Suppose vi, j,k is the intensity of a voxel (i, j, k) ∈ I in the image I, wi, j,k is a size d × d × d window centered at (i, j, k) for maximum likelihood estimation, where d is an odd integer greater than 1. We regard wi, j,k as the local region while we calculate the Weibull parameters for the voxel (i, j, k) using equation (3). When the intensity value ranges from 0 to 255, then the value of the Weibull scale parameter b is also from 0 to 255 by equation (3). On other hand, the more uniform the region surrounding a voxel is, the larger the Weibull shape parameter a becomes. Experimentally, we set the upper boundary of the Weibull shape parameter a to be 100. The size of the window has influence on the calculation of the Weibull parameters. The window should be large enough to allow
r
r
r
r
L r¾ M r
r
r
r
Figure 5: An example of hierarchy frame for a 2D image
enough local information to be involved in the computation of the Weibull parameters for the voxel. Furthermore, using a larger window in the computation of the parameters increases the smoothing effect. However, smoothing the local area might hide some abrupt changes in the local region. Also, a large window may require significant processing time. Weighing the pros and cons, we choose a 3 × 3 × 3 or 5 × 5 × 5 window for estimating the Weibull parameters and have experimental data to back that choice. A classical histogram is a statistical graph counting the frequency of occurrence of each gray level in the image or in part of an image [Ritter and Wilson 2000]. We extend this idea and define a histogram in the Weibull a-b domain. First, the Weibull shape parameter a and scale parameter b for each voxel are calculated. Second, for each Weibull parameter pair (a, b) ∈ [0, 100] × [0, 255], count the number of voxels with this parameter pair. Here two issues arise in computing the frequency for each parameter pair. One is that the step of the Weibull a-b domain is (1,1). The other is that we set a low boundary for the scale parameter b, since b is the a-moment of the intensity sample surrounding a voxel. We should identify the target with higher intensity, not the background with lower intensity. Last, we have the frequency for each parameter pair logarithmized, and plotted against that pair, and colored as the legend shown in Figure 4. The Weibull a-b histogram gives us a global description of the distribution of the uniform regions across intensity levels. We use a movable rectangle in the histogram to locate the range of the colored peak zone by moving its top-left or bottom-right vertex, and select all the voxels with the Weibull a-b parameter histogram being in this rectangle. An advantage of segmentation using the Weibull a-b parameter histogram is that local information and global information are both taken into account in determining the segmentation, whereas in traditional histogram approaches only global information is considered.
3
Segmentation Refinement Using GCCL
Although LSCM images have a much high accuracy, these images are still noisy and blurred. Several sources of noise can be identified [Manders et al. 1992] : thermal noise induced by the photomultiplier, photon-shot-noise, biological background (autofluorescence), and unspecific staining. The quality of the image depends also on possible mismatch of refractive indices, on tissue scattering, on dye concentration inside the cell, and the histological methods used for staining methods. These factors contribute to a position-dependent noise and blurring. Therefore, segmentation results using voxel labelling by the Weibull a-b histogram can be quite coarse and may lead to the problem that there are many isolated small segmented components, as shown in Figure 6(a). This is due to two reasons.
Research, OnlinID paper-0017
4
(a) (a)
(b)
(b)
Figure 6: Segmentation (a) before GCCL, and (b)after GCCL. Both are rendered by point clouds in 3D.
First, a thresholdingbased segmentation is a binary representation of a region that either includes or excludes a given voxel as being in or out of the region. Second, the voxel labelling can not distinguish the targets from the noise. On the other hand, voxel labelling can not show the shape of cells and implants segmented and the relationship among them, because voxel labelling only uses the information around a voxel. We wish to correct these problems by deleting the unwanted small regions and finding structural and quantitative information in an image using connected component labelling (CCL), which segment the domain of a binary image into partitions that correspond to connected components. Here, two voxels are 6-connected if at most one of their 3D coordinates differs by 1, 18-connected if at most two coordinates differ by 1, and 26-connected if all three coordinates are allowed to differ. A 6/18/26-connected path through the 3D image is a sequence of 6/18/26-connected voxels. A 6/18/26-connected component in a binary image is a subset in which for every two voxels there is a 6/18/26-connected path between them. The partitioning is represented by an 3D image in which all voxels that lie in the same connected component have the same voxel value. Distinct voxel values are assigned to distinctly connected component. It is clear that only the target voxels are affected by this labelling i.e. the background voxels remain unchanged.
3.1
Hierarchy Frame For a Connected Component
For a connected component C, a hierarchy frame HC (r) rooted from voxel r is defined as a partitioning of C into hierarchy {h1 (r), h2 (r), · · · , hn (r)} satisfying 1. h1 (r)={r}; 2. All voxels adjacent to voxels in hierarchy hi (r), (i = 2, · · · , n − 1) are in hierarchies hi−1 (r), hi (r) and hi+1 (r); 3. All voxels adjacent to voxels in hierarchy hn (r) are in hierarchies hn−1 (r) and hn (r). where n is the total number of hierarchies,and is simply the depth of C. maxi {|hi (r)|} is called the width of C, where | · | denotes the number of the elements in a set. Figure 5 shows a 2D 8-connected component which is labeled by the set {A, B,C, D, E, F, G, H, I, J, K, L, M, N, O, P, Q}. If the root is A, then the hierarchy frame for this connected component is h1 (A) = {A}, h2 (A) = {B, E}, h3 (A) = {C, F, Q, E}, h4 (A) = {D, E}, h5 (A) = {H, J}, h6 (A) = {K, L, M}, and h7 (A) = {P, O, N}. Therefore, the depth of C is 7, and the width is 4.
(c)
(d)
Figure 7: Smoothing connected components using convolution: a GFAP labeled astrocyte (a) before smoothing ,and (b) after smoothing, and a nuclei (c) before smoothing and (d) after smoothind
3.2
GCCL
For a binary image T, when GCCL finds a unlabeled voxel, called a root r, it does not stop until all voxels in ΩT connected to r though a 6/18/26-connected path are labeled. The procedure of labelling a connected component C by GCCL is to find the hierarchy frame HC (r) rooted from r. In our implementation of GCCL, we regard a connected component as a dynamic list (DL), and different components are assigned to different DLs. However, the main problem with GCCL is that GCCL may repeat to label a voxel in C. In order to avoid the expensive operation of DL, such as adding a unique node to a DL, we use 4-valued flags to determine the value of a voxel in T. Let t(i, j, k) denote the value at voxel (i, j, k) ∈ T , and set t(i, j, k) to be either 0 or 1 or 2 or 3. If t(i, j, k) = 0, then the voxel (i, j, k) belongs to the background and is not changed. When t(i, j, k) = 1, the voxel (i, j, k) belongs to the target, it is not labeled, and can be a root to form a new component or a new node to be added to the DL. When t(i, j, k) = 2, the voxel (i, j, k) can be a new node to be added to the DL, but can not be a root to form a new component. When t(i, j, k) = 3, it means that the voxel (i, j, k) has been added to a DL, neither as a new root nor as a new node. The GCCL algorithm is as follows: GCCL Algorithm: Read T, and set t(i, j, k) = 1, if (i, j, k) ∈ ΩT ; while t(i, j, k) == 1 loop /* the first loop*/ Generate a DL, denoted by dl, to store the connected component whose root is (i, j, k), and a temporary DL, denoted by tdl, to store middle results. Two countes, denoted by num1 and num2, represent the increase of dl and tdl, respectively, and are initialized to zero. Add voxel (i, j, k) into tdl; while tdl 6= 0/ , and voxel (l, m, n) ∈ tdl loop
Research, OnlinID paper-0017
5
(a)
(b)
Figure 9: The connection analysis for GFAP labeled astrocytes in LSCM image Figure 1(b)
Table 1: The efficiency of the GCCL algorithm
Figure 8: The segmentation results of the LSCM image of the GFAP-labeled astrocytes and DAPI stained nuclei (Figure 1(a))
Data
Data Size
GFAP & Nuclei GFAP & Implant
29.9MB 63.9MB
Connected Component Amount Largest 2514 87536 3115 234976
Time(s) 4 8
/* the second loop*/ if t(l, m, n) == 1 or 2 then while all the 6/18/26-connected voxels of (l, m, n), denoted by (l ± 1, m ± 1, n ± 1), and t(l ± 1, m ± 1, n ± 1) = 1 loop /*the third loop*/ num1++; Add voxel (l ± 1, m ± 1, n ± 1) into tdl; Set t(l ± 1, m ± 1, n ± 1) = 2; End loop Set t(l, m, n) = 3; Add (l, m, n) into dl; num2++; End if Remove voxel (i, j, k) from the tdl; if num1 6= num2 then Reset the tdl; End loop End loop Here, four issues arise in the GCCL algorithm. One is that for a connected component C, its root is the voxel (i0 , j0 , k0 ), where k0 = min(i, j,k)∈C k, j0 = min(i, j,k0 )∈C j, and i0 = min(i, j0 ,k0 )∈C i. The second is that we use three primitive operations of DL: • Add(x): It creates a new node for containing a voxel. The node is then pushed on the DL of voxel x at O(1) time cost. • Remove(x): This operation first moves the pointer of DL to the root of DL, and then finds the voxel x in the DL. If x is in DL, then delete, If not, go through the DL. In general, if there are n nodes in the DL, this operation costs O(n). In this algorithm, the voxel to be removed is always the root of the DL, therefore, this operation has O(1) cost.
• Reset: It reinitializes the DL and returns the root of the DL in O(1) cost. The third issue is that the number of times the first loop is excuted in the GCCL algorithm is the number of the connected components in the image. The number of times in the second loop is dependent on the number of voxels in a connected component, and the third is a constant either 6, 18 or 26. Therefore, the time complexity of the GCCL algorithm is O(N) with small constant, where N is the number of the voxels in the image. The last issue is that the size of local equivalence table is O(the width of connected component), because each local equivalence table is the DL tdl in GCCL algorithm. In Figure 6, the right image is the voxel labelling result by means of Weibull a-b histogram, includes 2514 26-connected components, and the left one is the results of the GCCL. Table 1 shows GCCL on different data. This was run on PIV 1.7GHz with 4GB RAM Window 2000. As shown in Figure 7(a) and 7(c), the resulting surface from our segmentation can be very coarse. This is due to the noise in the images and thresholdingbased segmentation methods. We smooth connect components using convolution with Weibull kernel whose parameters are determined by the equation (3). Figure 7 shows the smoothing results of connected components.
4
Results
We have already described the theory behind Weibull statistical modeling and GCCL. One example is a set of LSCM volume data shown in Figure 1(a). Figure 1(a) is composed of 58 slices with an in-plane 512×512 pixels, and 100 × 100 × 57.8 µ m field of view. After computation of the Weibull a-b histogram shown in Figure 4, we move the topleft vertex to (24, 0) and the bottom-right to (255, 100). After the initial segmentation using voxel labelling by the Weibull a-b histogram, the corresponding result T 0 is given in Figure 6(a). Using GCCL for T 0 and setting the threshold of the number of voxels in
Research, OnlinID paper-0017
6 M OGA , A.N., AND G ABBOUJ , M. 1997. Parallel image component Labelling with Watershed Transformation. IEEE Transactions on Pattern Analysis and Machine Intelligence 19, 5, 441 -450. L I H., WANG Y. , L IU K.L. , L O S.C.B. , AND F REEDMAN M. T. 2001. Computerized Radiographic Mass Detection-Part I: lLesion Site Selection by Morphological Enhancement and Contextual Segmentation”, IEEE Transactions on Medical Images., 20, 4, 289-301.
(b)
(a)
(c)
Figure 10: The segmentation results of the GFAP and implant LSCM image Figure 1(b), (a) two channel data, and (b) the GFAPlabeled astrocytes, and (c) the electrode implant segmented
a connected component 200, we can get the segmentation results shown in Figure 8. Figure 9 shows the effect of the top-left vertex on Weibull a-b histogram on the connection for glia cells in LSCM image Figure 1(b). By adjusting the position of vertex on Weibull a-b histogram, the connections between adjacent astrocytes can be more clearly defined, allowing for the potential identification of individual astrocyte. Figure 9(a) is obtained, when the top-left vertex is moved to (31,0), and Figure 9(b) to (24,0). As another example, we consider a GFAP and implant LSCM volume data shown in Figure 1(b). Figure 1(b) is 127 slices with an in-plane 512 × 512 matrix. Figure 10 shows the segmentation results of the GFAP and implant data. We have tested our algorithm with 69 different LSCM volume data. As illustrated here, we have observed that the overall approach can be very effective at segmenting LSCM images.
5
Conclusion
In this paper, we have presented a new statistical modeling of volume data to segment a target of interest, and a GCCL algorithm to refine the initial segmentation from the Weibull statistical modeling. This method, as illustrated by pilot application in LSCM images analysis, is capable of segmenting the structures within data and can be applied to real problems such as those encountered in tissue segmentation. One of the remaining limitations of the present approach is that it is still semi-automatic and consequently requires the intervention and expertise of the user. It would be desirable to move in the direction of a more fully automatic segmentation procedure.
6
Acknowledgements
This work was in part supported by National Science Foundation’s (NSF) KDI grant (IIS-998016), and the Defense Advanced Research Projects Agency’s (DARPA) ANIC grant (MDA972-00-10027), NIH HD 32621. We would like to thank PRISM, W.M. Keck BioImaging lab and the Cell Biology lab in ASU for providing the data and computing resources.
7
References
S ARTI A. , S OLORZANO C. O., L OCKETT S. , AND M ALLADI R. 2000. A Geometric Model for 3-D Confocal Image Analysis. IEEE Transactions on Biomedical Engineering, 47, 12, 16001609. C HANDA B. ,C HAUDHURI B.B. , AND M AJUMDER D. D., 1988. A Modified Scheme for Segmenting the Noise Images. IEEE Transactions on System, Man, and Cybernetics, 18, 3, 458-466. R AZDAN A. ,PATEL K. , FARIN G. AND C APCO D. G. 2001. Visualization of Multicolor LCM data set. Computers and Graphics, 25, 3, 371-382. H ANSEN M.W. ,H IGGINS W.E. 1997. Relaxation Methods for Supervised Image Segmentation. IEEE Transactions on Pattern Analysis and Machine Intelligence, 19, 9,949-962. C HESNAUD C. ,R EFREGIER P. ,B OULET V. 1999. Statistical Region Snake-based Segmentation Adaped to Different Physical Noise Models. IEEE Transactions on Pattern Analysis and Machine Intelligence, 21, 11, 1145-1157. S UHIR E. 1997. Applied Probability for Engineering and Science, McGraw-Hill. C HAKRABORTY A. AND D UNCAN J. S. 1999. Game-theoretic Integration for Image Segmentation. IEEE Transactions on Pattern Analysis and Machine Intelligence, 21, 1, 12-30. L EE T. C. M. 1998. Segmentation Images Corrupted by Correlated Noise. IEEE Transactions on Pattern Analysis and Machine Intelligence, 20, 5, 481-492. B ERKMANN J. , AND C AELLI T. 1994. Computation of Surface Geometry and Segmentation Using Covariance Techniques. IEEE Transactions on Pattern Analysis and Machine Intelligence, 16, 11, 1114-1116. H IROSE , AND H IDEO 1996. Maximum Likelihood Estimation in the 3-parameter Weibull distribution: a Look Through the Generalized Extreme-value Distribution. IEEE Transaction on Dielectrics and Electrical Insulation, 3, 1, 43- 55. K HANNA , V., G UPTA , P., AND H WANG , C.J 2001. Finding connected components in digital images. In Proceedings. International Conference on Information Technology: Coding and Computing, 2001, 652 -656. T URNER J., S HAIN W., S ZAROWSKI D. H., A NDERSEN M., M ARTINS S., I SAACSON M. AND C RAIGHEAD H. 1999. Cerebral Astrocyte Response to Micromachined Silicon Implants. Experimental Neurology, 156, 33-49. 7. M ANDERS , E.M.M., S TAP, J., AND B RAKENHOFF , G.J., VAN D RIEL , R., ATEN , J.A. 1992. Dynamics of Three Dimensional Replication Patterns During the S-phase, Analyzed by Double Labeling of DNA and Confocal Microscopy. J. Cell Science, 103, 3, 857-862. R ITTER G. X. , AND W ILSON J. N. 2000. Handbook of Computer Vision Algorithm in Image Algebra. CRC press (second edition)