Statistical Characterization of PM-QPSK Signals after ... - IEEE Xplore
Recommend Documents
Reconstruction of Signals after Filtering and Sampling Rate Reduction. Abstract-A wave digital filter (WDF) two-port has two input and two output-terminals.
similarity parameters such as Hurst exponent of ECG signals. Since the human interbeat interval (IBI) time series is fractal in nature, in [5], the Hurst exponent H ...
Dec 17, 1990 - Abstract-The problem of the parameter estimation of chirp signals is addressed. Several closely related estimators are proposed whose.
Correct interpretation of measured process data is essential for the supervision of control systems. Qualitative representation of signals based on episodes is ...
At the end of 2006 I have completed five years as the Editor-in-Chief of the IEEE Transactions on Dielectrics and Electrical. Insulation (TDEI). I am pleased to ...
Heterogeneous Packet Transmission in. Communication Networks. Soumik Sarkar, Member, IEEE, Kushal Mukherjee, Member, IEEE, Asok Ray, Fellow, IEEE,.
Oct 15, 2014 - [life sciences]. IEEE SIGNAL PROCESSING MAGAZINE [130] NOvEMbER 2014 ... has already been standardized in IEEE. Standard ...
a large book, but this is deceiving as it is full of information. It should be especially valuable to ... chapters take on different cases of the pulse train. First up are.
Universidad Tecnológica de Pereira. Electrical Engeenering. Pereira, Colombia [email protected]. Alvaro A. Orozco. Universidad Tecnológica de ...
System Identification Using Nonstationary Signals. Ofir Shalvi and Ehud Weinstein, Fellow, IEEE. Abstract-The conventional method for identifying the transfer.
for carrying out antenna transfer function measurements in the frequency domain, thus borrowing intact many highly refined calibration procedures associated ...
wireless interface boards, allows measurement instruments equipped with standard RS232, IEEE488, universal serial bus, and local area network interface ...
noise characteristics of two-port amplifiers and transis- tors, including the well known IEEE noise parameters [1], [2] and their variants, the noise matrix in either ...
Spatial-Temporal Characterization of Synchrophasor Measurement Systems. â A Big Data Approach for Smart Grid System Situational Awareness. 1.
IEEE TRANSACTIONS ON ELECTRON DEVICES, VOL. 62, NO. 9, SEPTEMBER 2015. Characterization of CMOS Metamaterial. Transmissi
Postgrowth Nondestructive Characterization of Dilute-Nitride VCSELs Using. Electroreflectance Spectroscopy. S. A. Choulis, T. J. C. Hosea, S. Ghosh, P. J. Klar, ...
thermal manner known as irreversible electroporation (IRE). IRE has shown promise in the focal ablation of pathologic tissues. Its non-thermal mechanism ...
E-mail: [email protected] ... providers such as Amadeus, Galileo or Sabre, via B2B XML ... access time to the database, time spent accessing external B2B.
AbstractâThe dual corona-electrostatic electrodes consist of one or several ionizing elements (wires, needles, and blades) at- tached to a metallic support.
acterized by Agilent PNA-X (N5247A) on probe station. (CASCADE Microtech Elite-300). Note that in higher frequency range measurement for the CRLH T-line,.
AbstractâThe observed discrepancy in the light output, mea- sured for a number of LSO, LYSO and BGO scintillators by different photomultipliers (PMTs) ...
Abstract: Low Temperature Co-Fired Ceramic (LTCC) technology is one of the most ... characterization of two dielectric LTCC tapes (Heraeus AHT 01-005 and ...
Tel: +49 40 42878 2758, Fax: +49 40 42878 2755, email: [email protected]. Abstract- An efficient ... plers based on the effective even and odd mode characteristic ... useful, for instance, when designing compensated high directivity.
Statistical Characterization of PM-QPSK Signals after ... - IEEE Xplore
Abstract We show by simulation that PM-QPSK signal components, after propagating in uncompen- sated fiber links, assume Gaussian distribution, both in linear ...
ECOC 2010, 19-23 September, 2010, Torino, Italy
P4.07
Statistical Characterization of PM-QPSK Signals after Propagation in Uncompensated Fiber Links A. Carena(1) , G. Bosco(1) , V. Curri(1) , P. Poggiolini(1) , M. Tapia Taiba(1) , F. Forghieri(2) (1)
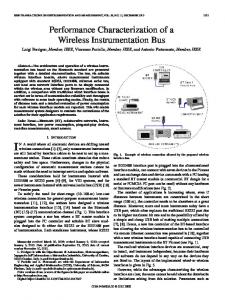
Dipartimento di Elettronica, Politecnico di Torino, C.so Duca Degli Abruzzi 24, 10129 Torino (Italy) B [email protected] (2) Cisco Photonics Italy srl, viale Philips 12, 20052 Monza (Italy) B [email protected] Abstract We show by simulation that PM-QPSK signal components, after propagating in uncompensated fiber links, assume Gaussian distribution, both in linear and non-linear regime, even in absence of ASE noise. After DSP equalization, the statistics of decision variables is also Gaussian. Introduction The path toward 100G channels has guided optical communication systems research in the direction of coherent detection. In particular, polarization-multiplexed QPSK seems to be a good solution for future transport networks, showing a better trade-off between complexity and performance than other proposed multi-level formats. This work is devoted to the study of the statistical distribution of the signal components of PMQPSK, after propagation in uncompensated fiber links. We analyze them by simulation in the absence of all noise sources, in order to highlight the effects of propagation on signal alone. To achieve a thorough insight, we conducted a comprehensive study analyzing first the linear and then the nonlinear regime, considering both single channel and WDM scenarios. We carried out this study focusing on uncompensated links, since they have been shown to substantially outperform dispersion-managed ones for this class of systems 1–3 . Systems set-up The analyzed system is shown in the top part of Fig. 1. We considered 100 Gb/s PM-QPSK channels with 11% overhead due to FEC and line coding, yielding a total symbol rate of 27.75 GBaud. Every wavelength in the 50 GHz spaced WDM comb was generated by a separate NRZ transmitter, based on two nested Mach-Zehnder modulators, one for each polarization. An optical multiplexer and a demultiplexer are present at the transmitter (Tx) and the receiver (Rx) respectively. In the simulations, they are both modeled as 4th order Super-Gaussian filters with bandwidth Bopt =40 GHz. Each WDM channel encoded four uncorrelated pseudo-random binary sequences (PRBSs) of degree 16. Different and uncorrelated PRBSs were used for all WDM channels. The link was composed of several 100-km fiber spans, each followed by an Erbium-Doped Fiber Amplifier (EDFA) to recover the span loss. We
Fig. 1: Top: link set-up. Bottom: coherent receiver structure.
considered Standard Single Mode Fiber (SSMF) with attenuation α=0.22 [dB/km], chromatic dispersion D=16.7 [ps/nm/km] and non-linearity coefficient γ=1.3 [1/W/km]. ASE noise added by EDFA was not considered in the simulation in order to analyze the distribution of signal components alone. This approach is also justified by the fact that signal-to-noise non-linear interaction at high baud-rate and in uncompensated link is negligible, as shown for instance in 1 . The Rx structure is shown in the bottom part of Fig. 1: it included a local oscillator (LO) that was mixed with the incoming signal in two 90-degree hybrids, one for each polarization. The alignment of the LO to the channel center frequency was assumed ideal, as well as its linewidth. Four balanced photo-detectors (BPDs) were used to detect the received signal components. The signals were then filtered by 5th order low-pass Bessel filters with -3dB bandwidth equal to 20 GHz. The four filtered signals were then sampled at 2 samples per symbol for digital signal processing (DSP). In this work, we neglected quantization effects. Chromatic dispersion was fully recov-
P4.07
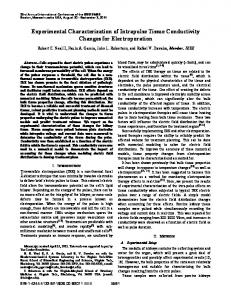
ered by a DSP electronic dispersion compensating (EDC) stage based on finite impulse response (FIR) filters. Then the signals were processed by a ‘butterfly’ second-stage equalizer using four 15taps FIR filters, whose coefficients are adjusted through a least-mean-square (LMS) algorithm 4 . We analyzed signal components distribution both at the Rx input and after the DSP. Signal analysis: at Rx input We first analyzed the four sampled signals at the Rx input, before any processing occurs: we call them XI, XQ, YI and YQ (X,Y, referring to polarizations and I,Q, referring to in-phase and quadrature). Our analysis considered systems of different lengths, from 100 km to 5000 km. They were simulated both in single-channel and in WDM condition, with non-linear effects either switched on or off. In case of non-linear propagation, we increased the fiber launch power per channel PTx from -3 to +6 dBm (in 3 dB steps). The interesting result that we found is that the statistical distribution of all four signal components very quickly (100 km are enough) becomes zero-mean and essentially Gaussian, irrespective of the sampling instant. The variance is directly related to the overall signal power and is always identical for all four signal components. These results hold true both in linear and non-linear regime, at least within the power boundaries and total distance shown above. Both in-linearity and with non-linear effects on, the four components appear to have negligible cross-correlation. This is an interesting result too, since in the non-linear case some correlation might have been expected. The distribution of the four components does not change along the link and in fact seems to increasingly adhere to Gaussian. For lack of space, we graphically report only a few of these results. In Fig. 2 and Fig. 3 we show the histograms of the signal distribution (together with a Gaussian fitting) for all the four components for WDM propagation in nonlinear regime at PTx =0 dBm at 100 and 500 km, respectively. Signal analysis: Rx DSP output We then analyzed signals at the DSP output, after chromatic dispersion was compensated for and polarization, frequency and phase were recovered, generating the decision signals for the four data streams. At the optimum sampling instant, as expected, the four components have two definite peaks corresponding to the bit ‘0’ or ‘1’ carried by each component. The distribution about each peak in all considered cases (WDM and single channel, different power levels and distance) is again re-
8
8
6
6
4
4
2
2
0
−0.2
0 XI [A.U.]
0.2
0
8
8
6
6
4
4
2
2
0
−0.2
0 YI [A.U.]
0.2
0
−0.2
0 XQ [A.U.]
0.2
−0.2
0 YQ [A.U.]
0.2
Fig. 2: Histogram of the four signal components at the Rx input. Propagation over 100 km in nonlinear WDM regime with PTx =0 dBm. Gaussian fitting is superimposed to each histogram. 8
8
6
6
4
4
2
2
0
−0.2
0 XI [A.U.]
0.2
0
8
8
6
6
4
4
2
2
0
−0.2
0 YI [A.U.]
0.2
0
−0.2
0 XQ [A.U.]
0.2
−0.2
0 YQ [A.U.]
0.2
Fig. 3: Histogram of the four signal components at the Rx input. Propagation over 500 km in nonlinear WDM regime with PTx =0 dBm. Gaussian fitting is superimposed to each histogram.
markably Gaussian. Again we found the same variance for all Gaussian distributions and no correlation among signal components, resulting in circular scattering diagrams (Fig. 6). In Fig. 4, we show the case for PTx =3 dBm, L=1000 km, WDM non-linear propagation. The histograms for the four components are normalized so that the peaks coincide with ±1. Note that propagation was completely noiseless: the Gaussian noise seen in Fig.4 is induced by non-linearity alone. We then studied the evolution of the variance of such non-linearity induced Gaussian noise, as a function of transmitted power and system length (Fig. 5). The bottom solid line is linearity: variance is extremely small and constant (due to residual ISI). In Fig. 5top we can see that in non-linear regime, both for single channel and WDM, the variance increases proportionally to P2Tx (i.e. a 1-dB increase in power causes a 2-dB increase in variance). Also,
P4.07
Dashed: 1 Ch. Solid: WDM
5000 km, non-linear
1000 km, non-linear
linear
PTx=6 dBm
Dashed: 1 Ch. Solid: WDM
Fig. 4: Histogram of the four signal components at the DSP output. Propagation over 1000 km in nonlinear WDM regime, PTx =+3 dBm.
single-channel and WDM, though distinct, have the same trend. Note that this study was based on a full-band dual-polarization split-step simulation. Hence, all non-linear interaction were taken into account, including those involving polarization, such as cross-polarization modulation (XPolM). Note also that the shown distributions would not pass tight tests for gaussianity. However, given the target BERs of current systems, far tail distribution become irrelevant and the shown distributions are equivalent to Gaussian to any practical extent. Comments and conclusion In conclusion, for the first time to our knowledge, we have shown that, in the absence of ASE noise, PM-QSPK signal components are gaussian-distributed both before and after DSP, and signal components are statistically independent. For signals at the DSP output (decision signals), we have shown that Gaussian noise is induced by non-linear effects and its variance depends on transmitted power and distance in a seemingly simple way. These findings might help in understanding and evaluating the impact of non-linear effects on PM-QPSK channels. On the other hands, properties derived for the signals before DSP (mostly Gaussian distribution and uncorrelation) directly apply to the optical PM-QPSK signal propagating in the fiber. Such hypotheses could be a starting point for deriving new simplified models of non-linear fiber propagation for WDM PM-QPSK signals allowing easier evaluation of system performance.
3 dBm 0 dBm -3 dBm linear
Fig. 5: Analysis of signal at the DSP output: averaged variance of the signal components as a function of transmitted power (top) and distance (bottom).
Fig. 6: Scattering diagram at the DSP output for one polarization. WDM transmission over 3000 km and PT x =3 dBm. Uncompensated SMF with no ASE noise (infinite OSNR).
Acknowledgments This work was supported by CISCO Systems within a SRA contract. The simulator OptSim was supplied by RSoft Design Group Inc. References 1 V. Curri et al., IEEE PTL 20, 1473 (2008). 2 D. van den Borne et al., Proc. ECOC’09 3.4.1 (2009). 3 C. Xie, Proc. OFC 2010 OWE1 (2010). 4 S. Savory, Optics Express, 16, 804 (2008).


![Radar signals - [Book Review] - IEEE Xplore](https://m.moam.info/img/260x300/radar-signals-book-review-ieee-xplore_5c9f6330097c4756428b460f.jpg)