models the timing behavior of each application task and tracks its behavior to .... alarming event on each task for each merged window. This minimizes the .... assumed to be done by custom-designed logic inside the component, enabling other ...
Statistical Fault Detection for Parallel Applications with AutomaDeD Greg Bronevetsky, Ignacio Laguna, Saurabh Bagchi, Bronis R. de Supinski, Dong H. Ahn, and Martin Schulz
Abstract Today’s largest systems have over 100,000 cores, with million-core systems expected over the next few years. The large component count means that these systems fail frequently and often in very complex ways, making them difficult to use and maintain. While prior work on fault detection and diagnosis has focused on faults that significantly reduce system functionality, the wide variety of failure modes in modern systems makes them likely to fail in complex ways that impair system performance but are difficult to detect and diagnose. This paper presents AutomaDeD, a statistical tool that models the timing behavior of each application task and tracks its behavior to identify any abnormalities. If any are observed, AutomaDeD can immediately detect them and report to the system administrator the task where the problem began. This identification of the fault’s initial manifestation can provide administrators with valuable insight into the fault’s root causes, making it significantly easier and cheaper for them to understand and repair it. Our experimental evaluation shows that AutomaDeD detects a wide range of faults immediately after they occur 80% of the time, with a low false-positive rate. Further, it identifies weaknesses of the current approach that motivate future research.
I. Introduction The growing size of large-scale systems makes them increasingly vulnerable to a variety of faults. Today’s largest systems have over 100,000 nodes, hundreds of TBs of RAM and provide over a PetaFlop of compute performance [2], with much larger and more complex systems expected over the next few years. As their size and This work partially performed under the auspices of the U.S. Department of Energy by Lawrence Livermore National Laboratory under Contract DE-AC52-07NA27344. The work of the Purdue authors was partially supported by the National Science Foundation under grant CSR0916337.
complexity grows, so does the variety of possible failure modes and the probability that any one component will fail. Although system administrators are expert at identifying and repairing faults, the large numbers of system users, applications and components is expected to overwhelm them unless they are provided with robust tools that can detect and characterize system failures. This paper presents AutomaDeD, a statistical tool that supports system administrators by detecting faults as they happen and guiding administrators towards the time and location of their first manifestation. It statistically models the timing behavior of large-scale applications and tracks their behavior online to detect any anomalies, which are reported to administrators, identifying both the time and the application tasks when the fault first manifested itself. Although AutomaDeD brings administrators closer to identifying the fault’s root cause, the goal of this work is to simplify the fault detection and analysis efforts of administrators and is not to automatically identify the root causes of faults. This paper makes the following technical contributions. First, we describe a model to characterize the timing behavior of applications. Second, we present methods that accurately identify when and where the application first deviates from its normal behavior. AutomaDeD models the timing behavior of application tasks by dividing their execution into discrete states and transitions between them. Since most large-scale applications are parallelized using the Message Passing Interface (MPI) [1], AutomaDeD models them at this granularity. Individual states are mapped to MPI calls or regions of code interleaved between adjacent MPI calls, including call stack information to disambiguate calls made in different contexts. AutomaDeD measures the amount of time spent by the application in each state before making a transition (denoted as “transition time”), recording the observed times as a probability distribution. When AutomaDeD observes a transition event that takes an unusual amount of time for its state transition, it flags the event as abnormal and notifies the administrator of the event’s time and location, making it significantly easier to identify the fault’s root cause.
AutomaDeD is evaluated by injecting synthetic errors into six applications from the NAS Parallel Benchmark (NPB) suite [3] at random time points and in randomly chosen tasks. The errors include delays of various lengths, message drops and repetitions as well as interference due to execution of an extra CPU- or memory-intensive thread, which model many real system faults. AutomaDeD correctly identifies delays and message faults immediately after they happen 80% of the time. However, our results also identify limitations in the current approach to be addressed by additional research.
II. Approach AutomaDeD consists of both on-line and off-line mechanisms. A PN MPI-based [8] monitoring layer is inserted between the application and the MPI library and at runtime observes and times the application’s state transitions. It (i) builds a probability distribution of each transition’s timing behavior and (ii) evaluates the probability of each runtime transition event, given the observed distribution of times of that transition. Each event’s probabiity is converted into an alarm value that measures the likelihood that the event truly indicates a system fault. If the event’s alarm is above a given threshold (the event is considered “alarming”), it is reported to the administrator for detailed review. This paper evaluates the design space of AutomaDeD by focusing on an offline variant of the tool that records events to a trace file before applying several analysis variants.
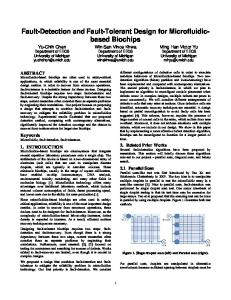
Data Samples Time Values Histogram Bucket Counts
Line Connectors Gaussian Tail
Time Values
Fig. 1. Example of histogram construction
number of buckets rises above a threshold, we merge the two buckets with the closest means. We derive a continuous probability distribution from the discrete histogram by linearly connecting adjoining bucket counts and modeling the regions beyond the smallest and largest buckets using the lower and upper halves of Gaussian distributions, which model the probability of observing new extreme values. The basic tradeoff between these two distributions is that Gaussians are cheaper (in terms of computation and memory cost to create and to query) and more constrained while histograms are more expensive but very flexible. Evaluating both options provides significant information about the basic tradeoffs of this design parameter, thus illuminating the potential of other statistical models such as mixed-Gaussian distributions and Kernel Density Methods [9].
B. Fault Detection Algorithm A. Time Distribution Algorithms We consider two representations for the probability distribution of times spent in application states: Gaussian distributions and empirical histograms. Gaussian distributions are an easy to use and efficient formalism that is supported by a rich theory. However, its constraints make it a poor representation for multi-modal or asymmetric timing behavior. The former can occur when different code within a compute region is executed at different times and the latter occurs when the time that precedes a transition is consistent except for spikes due to system or network interference. Histograms provide a more detailed fit to the observed data. The basic approach divides the observed data points into a number of equal-sized buckets. The probability of a particular bucket is the fraction of data points within it. Since timing data may have outliers orders or magnitude above the median, equal-sized buckets can aggregate most data points into a single bucket, providing poor resolution. We therefore used variable-sized buckets via an online clustering algorithm, as shown in Figure 1. We assign each new data point to its own bucket. If the resulting
1) Initializing Probability Distributions: The AutomaDeD fault detection approach begins by identifying the source of data that defines the transition probability distributions. If AutomaDeD has a set of application sample runs available, it follows the supervised approach, where it assembles the transition probability distributions from the transition events observed in those runs. If no sample runs are available, AutomaDeD builds the probability distributions from the given run itself. In the online approach for each application event e AutomaDeD first computes the distributions based on the events before e, using them to evaluate e’s probability. In the offlne approach AutomaDeD builds the distributions from all the events in the given run and then uses them to compute the probabilities of all of the run’s events. offline presents an idealized variant of online that uses all the information available from a single application run. By default the above approaches use all events to build each transition’s probability distribution. However, since this include many outlier events (e.g. some transitions take longer due to system interrupts) as well as occasional faults, the resulting probability distributions do not ac-
curately represent their transition’s normal behavior. AutomaDeD controls for this by filtering out each transition’s longest and shortest events before creating its probability distribution. The filtered versions of the above algorithms are denoted supervisedFilt(f), onlineFilt(f) and offlineFilt(f), respectively, where f is the percentage of longest/shortest times that are filtered out. 2) Computing Alarm Measures: AutomaDeD detects faults by looking for events that have a low probability given their transition’s probability distribution. The degree to which an event with probability p is indicative of a fault is measured by the alarm metric −log(p). The logarithm provides high resolution for events that are very close to 0 and the negation ensures that lower probabilities are mapped to larger alarm values. 3) Computing Alarm Thresholds: Events are reported if their alarm values are above a certain threshold. Thresholds are chosen to minimize the chance of mis-identifying normal behavior as a fault in a set of base runs (this set is independent of the sample runs used in the supervised algorithm and is required for all three algorithms). Specifically, AutomaDeD applies supervisedFilt(1) on these base runs, computing probability distributions and evaluating alarms of their events. AutomaDeD sets the detection threshold to be the maximum alarm value observed across all tasks and all runs. 4) Fault Detection: AutomaDeD detects faults by evaluating the alarm values of each observed event, using one of the above mechanisms (supervised, online or offline) to determine the transition probability distributions. Events that have alarms that exceed the given threshold are reported to the administrator. However, since the same system fault may trigger a storm of abnormal events, AutomaDeD filters the set of reported events. Time is divided into short, non-overlapping windows. Windows that contain no alarming events are discarded and the remaining windows are merged if they are adjacent. AutomaDeD reports only the first alarming event or the first alarming event on each task for each merged window. This minimizes the number of reports for each fault and captures the fault’s propagation through the application, as indicated by the order in which alarms are observed on different processes.
III. Experimental Evaluation A. Fault Injection Types We empirically evaluate the effectiveness of AutomaDeD by injecting synthetic faults into six applications in the NAS Parallel Benchmark suite: BT, CG, FT, MG, LU and SP [3]. We omitted EP because it performs almost no MPI communication and IS because it uses MPI in
only a few locations in the code, making MPI-based state demarcation inappropriate. Our fault injector, built on top of PN MPI, dynamically injects a wide array of software faults at random MPI calls during MPI application runs. It supports three main classes of faults: • Local transient stall; emulated via a finite loop of 1, 5 or 10 seconds (STALL) • MPI message loss and duplication; emulated by dropping (DROP_MESG) or repeating (REP_MESG) a single MPI message, • Extra CPU- or Memory-intensive thread; emulated by starting up a thread with a perpetual-increment loop (CPU_THR) or a loop that randomly reads from/writes to a 1GB region of memory (MEM_THR), that interfere with the remainder of the application’s execution. Our experiments ran each benchmark with input size A and 16 tasks. We executed all tasks on four-socket, quad-core nodes (the Hera cluster at LLNL), with 2.3Ghz Opteron processors and 32GB RAM per node. We injected each fault type into a random task and MPI operation type (Blocking and Non-Blocking Sends and Receives, All-toAlls, etc.), ensuring that over the entire experiment, each task and MPI operation type was injected with each fault type. For each case, we performed at least 10 random injection runs, totaling approximately 1,000 injection experiments per application. In each run we injected a single fault into a random instance of the target operation type on a random task.
B. Fault Detection Results We evaluate the accuracy of AutomaDeD in detecting injected faults and the tasks where they were injected to within 10ms of their occurrence. When AutomaDeD fails to do this, it may be for the following reasons • noDetect - no transition events were identified as faulty, • preDetect - the event identified by AutomaDeD occurred before the injected fault, or • postDetect - the event identified by AutomaDeD occurred more than 10ms after the injection We evaluate AutomaDeD with and without sample runs. Using sample runs corresponds to the case when the developer can execute an application multiple times to establish its normal behavior. We evaluate two types of sample runs. For each application A the FaultFree(A) set consists of 20 runs with no injected faults, which models an ideal set of sample runs. The Fault10(A, F) set includes FaultFree(A) as well as 2 additional runs of A in which fault F was injected. This set models the more common case where application runs are affected by infrequent system faults (in this case ∼10% of the runs are affected). Experiments that do not use sample runs are
denoted NoSample. Reported data for analyses that use filtering focuses on f=10%, which performed better than smaller values of f.
100%
CPU_THR
80% 60% 40% 20%
100% 90% 80% 70% 60% 50% 40% 30% 20% 10% 0%
0% supervised supervFilt(10)
online
Fault10
100%
onlineFilt(10)
offline
offlineFilt(10) supervised supervFilt(10)
NoSample
FaultFree
MEM_THR
80% online
onlineFilt(10)
offline
offlineFilt(10)
online
onlineFilt(10)
offline
offlineFilt(10)
60% Gauss
Histogram
40% NoSample
20% 100% 90% 80% 70% 60% 50% 40% 30% 20% 10% 0%
0% supervised supervFilt(10) Fault10
noDetect
supervised
supervFilt(10) supervised
Gauss
supervFilt(10) supervised
Histogram
supervFilt(10) supervised
Gauss
NoFault
noDetect
preDetect
Fault Detect(1ms)
preDetect
online
onlineFilt(10)
offline
offlineFilt(10) supervised supervFilt(10)
NoSample
Fault Detect(1ms)
Task Detect(1ms)
FaultFree
Delayed Detection
supervFilt(10)
Histogram
Fig. 3. Average accuracy for CPU_THR and MEM_THR
Fault10
Task Detect(1ms)
Delayed Detection
Fig. 2. Average accuracy across all applications and fault types
Figure 2 shows the detection accuracy of all configurations, averaged over all the applications and fault types. It illustrates that the use of sample runs produces significantly better results than with no such runs. Further, AutomaDeD is more accurate when provided fault-free runs (60% 10ms fault detection rate) than when some runs are faulty (< 50% detection rate). In constrast, the NoSample configuration of AutomaDeD produced generally poor results that peak at < 40% accuracy. Filtering and the choice of probability distribution have a relatively small effect on the accuracy of supervised (Fault10 and FaultFree)) and a large effect on NoSample, which performs significantly better with filtering and somewhat better with Histogram than with Gaussian. Finally, AutomaDeD’s accuracy in identifying the faulty task within 10ms of injection is only a few percent below than its accuracy for fault detection. This means that when AutomaDeD successfully detects a fault within this time frame, it is very likely to correctly identify the faulty task. Detections after 10ms typically happened multiple seconds after the injection, meaning that they did not accurately identify the fault. Figures 3, 4 and 5 provide a detailed view on AutomaDeD’s accuracy on thread injection faults (CPU_THR and MEM_THR), stalls(STALL) and message faults (DROP_MESG and REP_MESG), respectively. This data focuses on Histograms due to their superior accuracy. AutomaDeD has limited accuracy on thread injection faults, peaking at 60% accuracy with FaultFree and filtering (supervisedFilt(10)). On NoSample Au-
tomaDeD only detects faults with offlineFilt(10) and even then fails to reach 20% accuracy. AutomaDeD performs significantly better at detecting delays, showing 75% to 88% accuracy with FaultFree and filtering as the stall ranges from 1 sec to 10 sec. Further, when no sample runs are provided, AutomaDeD is 50% to 60% accurate when using offlineFilt(10). However, the online algorithms still perform poorly. For message faults (DROP_MESG and REP_MESG) AutomaDeD exhibits consistently high accuracy when sample runs are provided, reaching above 80% with FaultFree runs and 77% with Fault10 runs. However, when these runs are not provided, AutomaDeD either detects prematurely or not at all. Finally, Figure 6 presents the false positive rate of each of the above configurations. This was measured by running the AutomaDeD on each of the NoFault sample runs to see if AutomaDeD identified any events as alarming. The data shows that while filtering has higher detection accuracy, it also has a higher false positive rate: 20% when using NoFault sample runs. In contrast, using no filtering results in no false positives. This can be attributed to the fact that the detection thresholds were picked using the supervised algorithm that used 1% filtering. Since the un-filtered algorithm is trained on a more variable set of transition times, it is more conservative, producing lower alarm values for the same events. In contrast the algorithms that used 10% filtering detect more aggressively, resulting in better detection rates as well as false positives. We are currently trying to quantify the tradeoff between detection accuracy and the false positive rate to enable users to adjust AutomaDeD’s detection sensitivity to fit their need.
100%
100%
STALL-1
80%
80%
60%
60%
40%
False Positive Rate
40%
20%
20%
0% supervised supervFilt(10)
online
onlineFilt(10)
offline
offlineFilt(10) supervised supervFilt(10)
0% online
Fault10
100%
NoSample
onlineFilt(10)
offline
offlineFilt(10)
offline
offlineFilt(10)
FaultFree
NoSample
STALL-5
FaultFree
80% 60%
Fig. 6. False Positive Rate on FaultFree set of runs
40% 20% 0% supervised supervFilt(10)
online
Fault10
100%
onlineFilt(10)
offline
offlineFilt(10) supervised supervFilt(10)
NoSample
FaultFree
STALL-10
80% 60% 40% 20% 0% supervised supervFilt(10)
online
Fault10
noDetect
onlineFilt(10)
offline
offlineFilt(10) supervised supervFilt(10)
NoSample
Fault Detect(1ms)
preDetect
FaultFree
Task Detect(1ms)
Delayed Detection
Fig. 4. Average accuracy for STALL 100%
REP_MESG
80% 60% 40% 20% 0% supervised supervFilt(10)
online
Fault10
100%
onlineFilt(10)
offline
offlineFilt(10) supervised supervFilt(10)
NoSample
FaultFree
DROP_MESG
80%
Modular Redundancy [5] presents an alternative approach where each component is replicated and the output of the replicas is compared. Any disagreement is tagged as a fault. Although this method provides accurate and fully automated fault detection, it is expensive and can be inefficient for non-deterministic components. Model-based fault detection [4] works by having designers model their systems as a set of equations and dependencies. This makes it possible to derive the system’s externally-visible behaviors that indicate faults. While very effective when manual analysis is cost-effective, this methodology is not appropriate for fault analysis in general computing systems. The work most similar to our approach has been performed by the log analysis community, which analyzes system and application logs to detect and predict system failures. In particular, the NodeInfo algorithm [6] detects faults by looking for log terms that have low enthropy (appear rarely in the logs), enabling the authors to identify several previously unknown failure modes.
V. Conclusion
60% 40% 20% 0% supervised supervFilt(10)
online
Fault10
noDetect
preDetect
onlineFilt(10)
offline
offlineFilt(10) supervised supervFilt(10)
NoSample
Fault Detect(1ms)
Task Detect(1ms)
FaultFree
Delayed Detection
Fig. 5. Average accuracy for DROP_MESG and REP_MESG
IV. Prior Work The classical approach to fault detection focuses on the fail-stop [7] model where components are assumed to fail in a way that causes them to stop all interactions with the rest of the system. Fault detection in such components is assumed to be done by custom-designed logic inside the component, enabling other components to detect faults by using simple tools such as periodic heartbeat monitors [10].
As large-scale systems grow in size, they become more complex and less reliable. This makes them difficult to manage, forcing system administrators to spend significant amounts of effort to detect and identify the root causes of system failures. This paper presents AutomaDeD, a new tool that creates a statistical model of application behavior and uses this model to detect the time and task where the application’s behavior deviates from norm. Our experimental evaluation shows that AutomaDeD can be a useful tool for system administrators, reaching 80% accuracy in detection faults within 10ms for a variety of faults. However, its performance can still be poor for some faults and it can only provide good accuracy when provided with a set of sample runs of the application on which to train. In our ongoing work we are extending AutomaDeD to provide high accuracy on a wider variety of faults and to develop novel training mechanisms to make it possible for AutomaDeD to provide high accuracy with less training.
References [1] MPI Forum. http://www.mpi-forum.org. [2] Top 500 Supercomputer Sites. http://www.top500.org. http://www.top500.org. [3] BAILEY, D., BARTON , J., L ASINSKI , T., AND S IMON , H. The NAS Parallel Benchmarks. RNR-91-002, NASA Ames Research Center, Aug. 1991. [4] I SERMANN , R. Model-based Fault-detection and Diagnosis status and Applications. Annual Reviews in Control 29 (2004), 71–85. [5] LYONS , R., AND VANDERKULK , W. The Use of Triple-Modular Redundancy to Improve Computer Reliability. IBM Journal of Research and Development 6, 2 (1962), 200. [6] O LINER , A., A IKEN , A., AND S TEARLEY, J. Alert Detection in System Logs. In IEEE International Conference on Data Mining (ICDM) (Dec. 2008). [7] S CHLICHTING , R., AND S CHNEIDER , F. B. Fail-Stop Processors: An Approach to Designing Fault-Tolerant Computing Systems. ACM Transactions on Computer Systems 1, 3 (1982), 222–238. [8] S CHULZ , M., AND DE S UPINSKI , B. R. PNMPI Tools: A Whole Lot Greater Than the Sum of Their Parts. In ACM/IEEE Supercomputing Conference (SC) (2007), ACM, pp. 1–10. [9] S ILVERMAN , B. W. Density Estimation for Statistics and Data Analysis. Chapman & Hall, 1986. [10] S TELLING , P., D E M ATTEIS , C., F OSTER , I., L EE , C. K. C., AND VON L ASZEWSKI , G. A Fault Detection Service for Wide Area Distributed Computations. Cluster Computing 2, 2 (1999), 117– 128.