International Journal of Mathematics and Statistics Invention (IJMSI) E-ISSN: 2321 – 4767 P-ISSN: 2321 - 4759 www.ijmsi.org Volume 5 Issue 9 || November, 2017 || PP-18-23
Statistical Inference Based on Upper Record Values for the Transmuted Weibull Distribution Caner Tanış1, BuğraSaraçoğlu2 1
(Department of Statistics, Selçuk University, Turkey) (Department of Statistics, Selçuk University, Turkey) 2 Corresponding Author :
[email protected]
2
ABSTRACT:In this study, we have considered estimation of unknown parameters based on upper record values for Transmuted Weibull distribution with three parameter.Maximum likelihood and approximate Bayes estimators based on upper record values for unknown parameters of this distribution are obtained. Tierneykadane approximation is used to obtain approximate Bayes estimatorsunder squared loss function based on upper records. Also, biases and mean square errors of these estimators are compared with a Monte Carlo simulation study. Finally,a data analysis is presented on real data set which fit to transmuted Weibull distribution. KEYWORDS :Bayesian estimation, maximum likelihood estimation, tierney-kadane approximation, transmuted weibull distribution, upper record values. ----------------------------------------------------------------------------------------------------------------------------- ---------Date of Submission: 29-11-2017 Date of acceptance: 12-12-2017 ----------------------------------------------------------------------------------------------------------------------------- ----------
I.
INTRODUCTION
The transmuted Weibull (TW) distribution has been introduced by[1]. They have examined statistical properties of this distribution and have showed that this distribution is more flexibleaccording to weibull distribution. Probability density function (pdf) and cumulative distribution function (cdf) of thisdistribution with , and parameters are given as follows; f ( x; , , )
x
1
x x exp 1 2 e x p
x x F ( x ; , , ) 1 e x p 1 e x p
where x
0, 0, 0
(1)
(2)
and is defined on the interval 1,1 .
The first study about record values has been presented by Chandler [2]. In literature, there are many studies based on the record values. Some of these studies are listed as Rényi [3], Arnold et.al. [4], Ahsanullah and Nevzorov [5] and El-Sagheer [6]. The number of studies based on records for transmuted distributions are few [7]. Upper record time and upper record values are defined as follows: Let X 1 , X 2 , ... be a sequence of independent and identically distributed (iid) continuous random variables taken from any distribution having distribution function F . If X
j
Xi
for every i
j
,X
j
is called as
j
th
upper record
th
value.n upper record time is defined as follows. U ( n ) m in i : i U ( n 1) , X i X U ( n 1 ) (3) where U
(1) 1
and
X U (n)
is nth upper record value.
In this paper, our purpose is to compare the performances of maximum likelihood and approximate bayesian estimators of unknown parameters based on upper record values for TW distribution in terms of mean square error (MSE) criteria. This study is organized as follows. In section 2, maximum likelihood estimation (MLE) based on upper record values for TW distribution is given. In section 3, approximate bayesian estimators under square loss function are obtained by using Tierney Kadane approximation. In section 4, Monte Carlo simulation study is performed to compare these estimators in terms of bias and MSE.Moreover, the real data analysis is taken placein section 5. Finally the conclusion arepresented in section 6.
www.ijmsi.org
18 | Page
Statistical Inference Based on Upper Record Values for The Transmuted Weibull Distribution II.
MLE BASED ON UPPER RECORD VALUES FOR TW DISTRIBUTION X U ( X U (1 ) , X U ( 2 ) , ..., X U ( n ) )
Let
are upper record values taken from TW ( , , ) distribution on
condition that parameter is known. In this case, likelihood function based on the observed data is as follows.
x
L ( , | xU ) f
n 1
| ,
U n
i 1
xU ( i )
n
n
i 1
n 1
i 1
1
1
x 1 F x f
U n
: ,
U n
n exp i 1
1 exp
: ,
xU ( i )
x U (i)
1 2 e x p
n i 1
1 e x p
x U (i)
xU ( i )
(4)
From (4), log-likelihood function is given as , | xU
n lo g lo g
n
i 1
n xU ( i ) 1 lo g i 1
lo g 1 2 e x p
Taking the derivative of
x U (i)
, | xU
n 1
i 1
n
i 1
xU ( i )
xU ( i )
n 1
i 1
lo g 1 e x p
x U (i)
(5)
with respect to and parameters, following non-linear equations are
obtained.
, | xU
n
xU ( i ) lo g
n
i 1
n 1 xU ( i ) i 1
n
i 1
xU ( i ) lo g
x U (i)
xU ( i ) lo g
xU ( i )
xU ( i ) lo g
1 e x p
n
i 1
2
exp
xU ( i )
1 2 e x p
x U (i)
x U (i)
xU ( i ) lo g
exp
x U (i)
xU ( i )
0
(6)
, , | xU
n
n 1 i 1
1 n
xU ( i )
n
i 1
xU ( i )
xU ( i )
n
i 1
x xU ( i ) U (i) 2 exp x U (i) 1 2 exp
x U (i) exp
1 e x p
xU ( i )
0
(7)
These equations can be solved by using numerical analysis methods such as newton-raphson method etc. Thus, MLEs for and parameters have been obtained. www.ijmsi.org
19 | Page
Statistical Inference Based on Upper Record Values for The Transmuted Weibull Distribution III.
BAYES ESTIMATION BASED ON UPPER RECORD VALUES FOR TW DISTRIBUTION are upper record values taken from TW ( , , ) distributionon
X U ( X U (1 ) , X U ( 2 ) , ..., X U ( n ) )
Let
condition that parameter is known. IndependentGamma priors for unknown and parametersneeded for bayes estimation are given by; d 1 e e , 0 , d 1 0 , e1 0 (8) 1
1
e2
e , 0 , d 2 0 , e 2 0 (9) The joint prior and posterior distributions of a n d are given in equation (10) and (11), respectively. d 2 1
,
, | xU
d1 1
d 2 1
xU | , ,
f
f
xU
e
e1 e 2
(10)
k ( xU ( i ) ; , ) ( , )
(11)
k(x
U (i )
; , ) ( , ) d d
0 0
n
where
, k ( xU ( i ) ; , )
n
i 1
xU ( i )
1
1
n 1
i 1
n xU ( i ) n exp i 1 i 1
x 1 e x p U (i )
1 2 e x p 1 e x p
x U (i )
x U (i )
In this case, approximate bayes estimator under squared loss function forany functionof
.
ve , w , , is as
follows:
wB
,
E w
,
x U
w ,
/ xU
, / xU
e
,
d d
(12)
0 0
e
, / xU
,
d d
0 0
where ,
is defined in (5) and , is logarithm of joint prior distribution.It is difficult to solve non-linear equation in (12). Therefore, some approximate methods are used to obtainthe solution of this equation. One of these methods is Tierney Kadane’s approximation method. | xU
3.1 TierneyKadane’s Method Tierney and Kadane’s approximation has been firstly suggested by [8]. This method with the aim of obtainingapproximate bayes estimates has been studied by authors such as [9], [10] and [11]. Let parameter for TW distributionis known. In this case, Tierney and Kadane approximation for the case with two parameters can be summarized as follows. 1
l( , )
{ ( , ) ( , )}
(13)
1
l ( , ) *
n
n
lo g w ( , ) l ( ,
)
(14) where , is defined as follows. ,
lo g
,
d 1 1 lo g d 2 1 lo g
e1 e 2
(15)
In this case, approximate Bayes estimator of w ( , ) under squared error loss function for TW distribution is derived as follows: wˆ b ,
where
E w ( , ) | xU
ˆ
Hessians of
l
*
l
, ˆ *
l
*
ˆ
and ˆ l
*
, ˆ
l
*
l
det * d e t
, ˆ l
maximize
and l ˆ
l
, ˆ l
1 2
* e x p n l ˆ * , ˆ * l l
l
*
ˆ
at ˆ l
IV.
*
l
*
, ˆ
, ˆ
l
*
l
*
l ˆ
and l ˆ
and ˆ
l
l
, ˆ l
, ˆ l
l
, ˆ l
(16)
, respectively.
*
and are minus the inverse
, respectively.
SIMULATION STUDY www.ijmsi.org
20 | Page
Statistical Inference Based on Upper Record Values for The Transmuted Weibull Distribution In this section, a Monte Carlo simulation study is carried out to investigate the performances of ML and approximate bayes estimates based on upper record values taken from TW distribution on condition that parameter is known. A total of 10000 random samples have been generated from TW distribution with parameters
2 , 2 .4 , 0 .2 , 3 .2 , 3, 0 .5 , 2 .1, 2 .1, 0 .4 , 2 .7 , 2 .3, 0 .7 .
following algorithm is used to generate upper record values from any Step 1. T1 , T 2 , ..., T n are generated from U (0 ,1) distribution.
F
The
distribution.
Step 2.Data from standard exponential distribution are generatedby using Z i ln 1 T i transformation. Step 3. i t h upper record value taken from standard exponential distribution with Y i Z 1 Z 2 ... Z i transformation is generated. Step 4. i t h upper record value taken from U 0 ,1 distribution is obtained by using U i 1 e
Yi
transformation.
Step 5. Finally, upper record values taken from any distribution F are generated with
X U i F
1
U i
transformation. Mean square error (MSE) and biases of the ML and approximate bayes estimates based on upper record values using (5) and (16) equations are shown in Table 1 . Table.1 MSEs and biases of the ML and approximate bayes estimates for various parameter values and
d1
MLE
n 5 10 15 20 25 30 5 10 15 20 25 30 5 10 15 20 25 30 5 10 15 20 25 30
Parameter values
(2,2.4,-0.2)
(3.2,3,0.5)
(2.1,2.1,0.4)
(2.7,2.3,-0.7)
1, d 2 2 , e1 1, e 2 2
priors Bayes
MSE
Bias
MSE
Bias
MSE
Bias
MSE
Bias
7.220 1.118 0.545 0.329 0.238 0.182 17.732 3.009 1.509 0.916 0.663 0.501 7.863 1.271 0.599 0.385 0.276 0.219 11.453 1.832 0.900 0.536 0.403 0.307
1.347 0.493 0.307 0.223 0.169 0.140 2.125 0.822 0.523 0.382 0.290 0.233 1.141 0.536 0.336 0.245 0.191 0.150 1.682 0.629 0.395 0.285 0.225 0.191
1.400 1.180 1.025 0.865 0.777 0.649 0.629 0.610 0.564 0.494 0.452 0.385 0.861 0.808 0.704 0.624 0.549 0.467 0.587 0.485 0.424 0.362 0.329 0.282
0.499 0.410 0.348 0.305 0.259 0.196 0.241 0.238 0.231 0.206 0.172 0.121 0.341 0.336 0.297 0.259 0.224 0.151 0.307 0.245 0.207 0.181 0.155 0.123
0.351 0.229 0.173 0.136 0.116 0.097 1.576 1.008 0.749 0.581 0.484 0.403 0.334 0.226 0.170 0.139 0.118 0.105 0.714 0.460 0.344 0.264 0.223 0.186
-0.438 -0.352 -0.297 -0.259 -0.235 -0.208 -1.165 -0.893 -0.735 -0.626 -0.554 -0.492 -0.343 -0.296 -0.256 -0.226 -0.203 -0.183 -0.710 -0.507 -0.399 -0.336 -0.291 -0.252
0.652 0.595 0.544 0.490 0.465 0.443 1.154 0.999 0.847 0.719 0.644 0.590 0.369 0.361 0.336 0.318 0.300 0.301 0.509 0.421 0.361 0.312 0.287 0.263
-0.727 -0.590 -0.540 -0.509 -0.493 -1.026 -0.925 -0.819 -0.732 -0.672 -0.637 -0.171 -0.500 -0.464 -0.423 -0.390 -0.365 -0.358 -0.642 -0.542 -0.463 -0.410 -0.373 -0.353
V.
REAL DATA ANALYSIS
In this section, we provide a real data analysis in order to indicate fit to the TW ( , , ) distribution. We consider real data setbased on the breaking stress of carbon fibers studied by Nichols and Padgett, [12], Pal et. al., [13], Aryal and Tsokos, [3]. The data set consists of 100 observations and given as follows. Data Set 3.70, 2.74, 2.73, 2.50, 3.60, 3.11, 3.27, 2.87, 1.47, 3.11, 4.42, 2.41, 3.19, 3.22, 1.69, 3.28, 3.09, 1.87, 3.15, 4.90, 3.75, 2.43, 2.95, 2.97, 3.39, 2.96, 2.53, 2.67, 2.93, 3.22, 3.39, 2.81, 4.20, 3.33, 2.55, 3.31, 3.31, 2.85, 2.56, 3.56, 3.15, 2.35, 2.55, 2.59, 2.38, 2.81, 2.77, 2.17, 2.83, 1.92,1.41, 3.68, 2.97, 1.36, 0.98, 2.76, 4.91, 3.68, 1.84, 1.59, 3.19, 1.57, 0.81, 5.56, 1.73, 1.59, 2, 1.22, 1.12, 1.71, 2.17, 1.17, 5.08, 2.48, 1.18, 3.51, 2.17, 1.69, 1.25, 4.38, 1.84, 0.39, 3.68, 2.48, 0.85, 1.61, 2.79, 4.70, 2.03,1.80,1.57,1.08,2.03, 1.61, 2.12, 1.89, 2.88, 2.82, 2.05, 3.65. Firstly, we have examined whetherthis data set fit to the TW distribution. The parameters of this distribution is estimated by maximum likelihood method. The estimated parameters and their standart errors (in parentheses), www.ijmsi.org
21 | Page
Statistical Inference Based on Upper Record Values for The Transmuted Weibull Distribution Kolmogorov-Smirnov (K-S) distances between the theoric and emprical distribution functions, and p-values are given in Table 2. Table 2. ML estimates and goodness of fit measures of TW distribution for the real data set K-S p-value ˆ ˆ ˆ 2.9935 (0.2413)
3.4125 (0.3377)
0.6789 (0.3798)
0.0642
0.8038
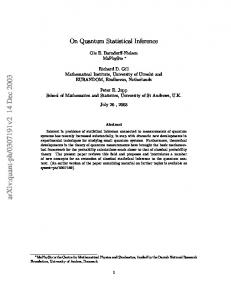
From Table 2, it is clear that the data set fits tothe TW distribution. Also, figure 1 shows plots of the empirical and theoric distribution functions. 1 Empricial CDF CDF
0.9 0.8 0.7
F(x)
0.6 0.5 0.4 0.3 0.2 0.1 0
0
1
2
3 x
4
5
6
Figure 1.Empiricalcdfand theoriccdf From the data set, the observed upper record values isobtainedas follows. x U i : 3.70, 4.42, 4,90, 4,91, 5.56.
The MLEs and standard errorsfor unknown parameters of TW , , distribution based on upper record values are given in Table 3. Table 3. MLE (standard error) for , , parameters based on upper record values ˆ
ˆ
ˆ
6.5017 (2.7191)
4.5157 (0.5464)
0.727 (0.6379)
VI.
CONCLUSION
In this paper, we have studied about estimation problem of parameters based on upper record values for TW distribution on condition thattransmuted parameteris known. MLEs of unknown parameters are obtained. Also approximate bayesian estimates under squared loss function of these parameters are derived using Tierney Kadane method. It has been carried out a Monte-Carlo simulation study to compare these estimators in terms ofmse and bias. According to simulation results, it is clear that performances of the approximate bayes estimators are better than maximum likelihood estimator in terms of mse and bias. Also, as the number of recordsincreases ,the values of these two estimators approach to each other. In the real data analysis, ML estimatebased on upper record values generatedfrom Carbon fibres data set is calculated.
REFERENCES [1]. [2]. [3]. [4]. [5]. [6]. [7].
Aryal, G. R., &Tsokos, C. P., Transmuted Weibull distribution: A generalization of theWeibull probability distribution. European Journal of Pure and Applied Mathematics, 4(2), 2011,89-102. Chandler, K. N., The distribution and frequency of record values. Journal of the Royal Statistical Society. Series B (Methodological), 1952, 220-228. Rényi, A.,Théorie des élémentssaillantsd’une suite d’observations. Ann. Fac. Sci. Univ. Clermont-Ferrand, 8, 1962, 7-13. Arnold, B.C., Balakrishnan, N. and Nagaraja, H. N. , Records, (John Wiley & Sons, New York, 1998). Ahsanullah, M., Nevzorov, V. B.,Records via ProbabilityTheory, (Atlantis Press., 2015). El-Sagheer, R. M., Bayesian Estimation Based on Record Values from Exponentiated Weibull Distribution: An Markov Chain Monte Carlo Approach, American Journal of Theoretical and Applied Statistics, 4(1), 2015, 26-32. Tanış, C. ,Saraçoğlu, B., (2017). Estimation Of Parameters Based On Record Values For The Transmuted Weibull Distribution, International Conference On Computational And Statistical Methods In Applied Sciences (Costas), Abstract book, 9-11 November, Samsun, Turkey ,2017
www.ijmsi.org
22 | Page
Statistical Inference Based on Upper Record Values for The Transmuted Weibull Distribution [8]. [9]. [10]. [11]. [12]. [13].
Tierney, L., &Kadane, J. B., Accurate approximations for posterior moments and marginal densities. Journal of the american statistical association, 81(393), 1986, 82-86. Gencer, G., &Saracoglu, B. (2016), Comparison of Approximate Bayes Estimators under di¤erent loss functions for Parameters of Odd Weibull Distribution,Journal of Selcuk University Natural and Applied Science, 5(1), 2016, 18-32. Howloader, H.A., Hossain, A. M., "Bayesian survival estimation of Pareto distribution of second kind based on failure-censored data, Computational Statistics & Data Analysis 38, 2002, 301-314. Mousa, M. A., &Jaheen, Z. F.,Statistical inference for the Burr model based on progressively censored data. Computers & Mathematics with Applications, 43(10), 2002, 1441-1449. Nichols, M. D., & Padgett, W. J., A bootstrap control chart for Weibull percentiles. Quality and reliability engineering international, 22(2), 2006, 141-151. Pal, M., Ali, M. M., & Woo, J.,Exponentiatedweibull distribution. Statistica, 66(2), 2006, 139-147.
Caner Tanış, BuğraSaraçoğlu “Statistical Inference Based on Upper Record Values for the Transmuted Weibull Distribution.” International Journal of Mathematics and Statistics Invention (IJMSI) , vol. 05, no. 09, 2017, pp. 18-23.
www.ijmsi.org
23 | Page