(PCA) [5], to list but a few. Notably, a recent set of articles proposed the sub- space method to detect anomalies by PCA for network-wide anomalies [6,7].
Statistical Sketch based Anomaly Detection and Validation using an Anomaly Database Guillaume Dewaele1 , Pierre Borgnat1 , Patrice Abry1 , Julien Aussibal2 , Laurent Gallon2 , P. Owezarski3 , D. Veitch4 1
Physics Lab. (UMR CNRS), ENS Lyon, France, LIUPPA, IUT GTR, Mont de Marsan, France, 3 LAAS-CNRS, Toulouse, France, CUBIN, Dept. of E&E Eng University of Melbourne, Australia. 2
4
Abstract. An anomaly detection procedure based on statistical profiles of sketches of internet traffic is proposed. To validate its statistical performance, measurement campaigns were conducted to collect regular traffic as well as traffic with anomalies, on the Renater network. Anomalies were produced using real-world DDoS tools (tfn2k, trin00). The attacks target different services (ICMP, SYN, UDP, etc.) and aim at occupying the bandwidth. They consists of volume anomalies, however kept at low intensity levels with no noticeable impact on the global traffic. This leads to the production of a documented, controlled and reproducible anomaly database. The traffic traces are analyzed by means of random projections in a small-dimension space (sketches). Each sketch is aggregated over a collection of different time-scales and modeled using non-Gaussian statistics. Anomalies are detected by quantifying the departures of the modeling parameters from those estimated under normal situations. Such deviations are quantified by means of Mean Quadratic Distance or of Kullback-Leibler divergences. The labeled database enables us to study the statistical performance (false negative vs. false positive) of the proposed detection procedures. They are shown to present satisfactory performance, down to alert times of the order of 1 minute. Key Words: Anomaly detection, Anomaly database, Performance Evaluation, Sketch, non Gaussian statistics, Kullback divergence.
1
Motivations, Contributions and Related Work
Being now the major universal communication infrastructure, Internet experiences a great variability of traffic features, and is especially subject to attacks in growing numbers and diversity. Therefore, the defense against malicious anomalies through their early detection and mitigation is a major issue in Internet researches. Numerous works already addressed the question of anomaly detection from traffic measurements, with two main groups of methods: signaturebased detection (by pattern matching, data mining,...); profile-based detection of anomalies from their impact on the statistical properties of the traffic. Our contribution belongs to this second group. Profile-based detection of anomalies from traffic measurement were shown to be possible by monitoring specific statistical traffic features [1]: spectral density or covariance [2], wavelet coefficients fluctuations, [3, 4], temporal features from Principal Component Analysis
2
(PCA) [5], to list but a few. Notably, a recent set of articles proposed the subspace method to detect anomalies by PCA for network-wide anomalies [6, 7]. Our contribution also belongs to the group of profile-based detection explicitly exploiting multiresolution analysis and non Gaussianity. Methodology: what are anomalies ? Whereas, for signature-based procedures, an anomaly is clearly defined by the signature that is found in real traces, for profile-based methods, the situation is far less clear. In most published work, an anomaly is declared to occur either when a meaningful statistical deviation from normal is observed or if a network expert says so (usually using his/her experience, analyzing signatures or well established intrusion detection system (IDS) outputs). In the latter case, the risk is to design an ad hoc procedure able to detect only this particular anomaly in this specific context. In the former case, most procedures consist of 3-steps: i) characterize normal (and notably evaluate its natural high variability), ii) characterize anomalous, iii) detect anomalies as significant departures from normal. For instance, the subspace method defines an anomaly as an emergence of a large residual signal in PCA. A posteriori inspections are required to validate the relevance of the alarm and nothing can be said about missed detections. For both cases, the major drawback lies in the fact that performance can not be assessed in a comparable and reproducible manner and within a controlled framework. Most of the known methods, and their performance, were rigorously compared in [8]. However the anomalies are defined here, as well as in the original article, a posteriori from the detection procedures and not from the traces. Hence statistical performance may be compared but not clearly assessed. This present work proposes to mix both perspectives. We have chosen to conduct measurement campaigns to collect both regular traffic as well as traffic with anomalies. This has been performed on the operational Renater network. While regular traffic consists of the uncontrolled actual traffic existing on this network, anomalies were performed by ourselves, in a controlled and reproducible manner, using real-world DDoS tools (tfn2k, trin00) piloting a botnet. The constitution of this traffic database containing controlled, reproducible and documented anomalies, which consists of the first major contribution of our work, circumvented the difficulty of a posteriori blind validation of anomalies and enables us to unambiguously assess the statistical performance of detection procedure proposed below in a framework allowing for comparisons. Detection and statistical variability of the traces. To specifically address the well-observed naturally high variability of traffic, the use of non Gaussian statistics (possibly heavy tails) have been proposed, this is notably the case with multifractal models [9]. Other work proposed to describe the marginals with common positive laws such as log-normal, Weibull or gamma distributions. Due to the point process nature of the underlying traffic, Poisson or exponential distributions are expected at small aggregation levels, while for highly aggregated data, Gaussian distributions are used in many cases as relevant approximations. However none of them can satisfactorily model traffic marginals both at small and large time-scales. We have recently proposed to go one step further [10, 11]
3
showing that a versatile and relevant traffic analysis can be achieved via the performing of a multiresolution-Gamma modeling: the empirical marginals of traffic aggregated over a range of different time-scales are modeled with a collection of Gamma distributions. Anomalies are detected as departures (quantified by relevant information-theory distances) of the parameters measured when anomalies occur from those estimated under normal situations. Reduction of dimensionality. Another issue in anomaly detection is to face the high dimensionality of the data. Inspired from researches on data streaming (see for instance [12]), and following ideas by [13], we propose to represent the trace by sketches, an efficient tool to reduce the dimensionality of the data. For network-wide measurements, various ways to reduce this high dimensionality were investigated: PCA [6], non-linear manifold learning [14] and more recently sketches [15]. Sketches are summaries of the real trace, reduced to a few dimensions. They are obtained by means of some hash functions that mixes the data, followed by a projection in a low-dimension subspace. This can be seen as a random (nevertheless known) sorting and aggregation of the packets, or as a projection on a random subspace. Variants of this fruitful method have been used developed, for instance, for change-detection [13], for summarizing what is new [16], for identifying heavy hitters [17],... Hence, any anomaly detection method has to cope with both the high inner variability of network traffic, and its high-dimensionnality. Therefore, the originality of the second contribution of the present work consists of proposing a new anomaly detection method combining our previous multiresolution-Gamma modeling with a sketch based analysis. We show that this enables us to detect attacks or anomalies even with very low intensities (equivalently at very low signal to noise ratios). Also, the joint use of several hash functions, chosen in an quasi-random manner, opens the track for the identification of the flow(s) responsible for the anomaly and hence for reaction, mitigation and defense.
2
Anomaly Database
We conducted experiments and measurements aiming at producing a documented, controlled and reproducible anomaly database. This requires collecting traces showing legitimate traffic and traces containing DDoS attack packets. One objective of profile-based detection is to detect anomalies that do rely on an illegitimate increase of traffic, or some part of the traffic (SYN packets, ICMP packets, UDP packets) though this increase remains low. This is especially true due the distributed nature of the nowadays attacks: close to the target, traffic changes become huge and the detection is easy, but too late because the targeted resources are already wasted. Therefore, our goal is to detect the onset of the DDoS close to the generating sources, where the traffic of only a few bots is aggregated, hidden under normal activity. Our attacks consist of volume anomalies, however, they are kept in purpose at very low intensity levels with no noticeable impact on the global traffic (and hence cannot be subsumed to global mean or variance changes). This situation can be compared to the case of a router collecting the packets of a couple of bots. None of ours attacks saturated the access link. We collected traffic both at the target computer (or router) and
4 Tool
Flooding attack TRINOO UDP UDP
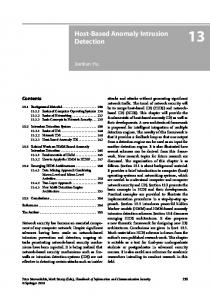
#bots #Attack packets/s 2 74 4 148 4 148 TFN2K TCP SYN 2 520 ICMP 4 92 4 179 Mixed 4 760 Smurf 4 95
#Total packets/s 1098 3640 2190 4258 1099 1820 2781 2501
Attack intensity 7% 4% 7% 12% 8% 10% 27% 4%
Attack throughput 200kb/s 388kb/s 388kb/s 166kb/s 288kb/s 388kb/s 250kb/s 250kb/s
Table 1. Characteristics of the anomalies performed. The attacks are made during 10 minutes and we collect the traffic for one hour around that period.
at the routers connecting the attacking bots to Renater. DDoS attacks are performed using Trin00 and Tfn2k, two well-known real world tools used to attack computer networks. Trin00 daemons allow flooding by sending to the target valid, non sollicitated, UDP packets. Tfn2k is a much more versatile tool that allows attacks covering a wide range of methods used for DDoS: UDP flooding, TCP/SYN flooding, ICMP/Echo flooding, attacks combining those three methods, SMURF (sending Echo packets to a broadcast adress, replacing the IP of the sender with the one of the victim) and Targa3 (malformatted packets). Both of those tools use a similar architecture: daemon programs (usually referred to as bots or zombies) are installed and launched by the attacker on several computers among the internet, using worms or security holes. Once those bots are up and running, the attacker can use a master program that sends its orders through the network, commanding them to attack simultaneously a (set of) IP address(es). Bots use stealth methods such as changing their names to common services to avoid being discovered. Order packets between master and bots are even more difficult to detect among regular traffic, because they consists of anonymous UDP packets, carrying information encrypted in the payload. Bots obtain their orders by trying to decrypt all received packets. For those reasons, it is difficult to identify computers infected with sleeping zombies before the attack begins, and there is a real interest in identifying them as quickly as possible when the DDoS begins. Since some of our routers were rejecting malformatted packets (incorrect CRC or invalid URG pointers, for examples, detecting them by a signature-based method), some corrections in the Tfn2k daemons source coded were needed for the attack packets to reach the target without been discarded by the routers. To perform DDoS attacks, we installed Trin00 and Tfn2k bots on several computers, linked to the Renater operational network (the French high speed network used for research and education), hosted in four different sites: IUT Mont de Marsan, LIP6 Paris, ENS Lyon and ESSI Nice. The target consists of a single computer located in LAAS, Toulouse, France. All attacks have been conducted during afternoon hours, and are mixed with real, legitimate, LAAS internet traffic. These campaigns of experiments provide us with a labeled database of real traffic traces containing low intensity bandwidth controlled and documented
5 k=1
j=1 0.8
k=6
1.5
k=17
3
4
2
3
0.6
1
0.2 0
0
2
4
6
8
10
12
14
16
18
j=3 0.4
log(α∆)
0.4
0.5
2 1
0
1 0
−0.5
0
0.3
−1
−1
0.2
−1
0.1 0
−1.5 0
2
4
6
8
10
12
14
16
18
0
5
10
−2
0
5
10
−2
0
5
10
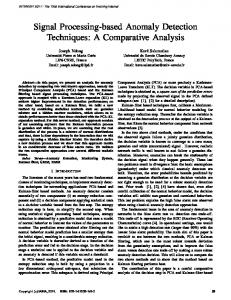
Fig. 1. Gamma model for a sketch with anomaly. Left: Empirical PDF and model at 2 scales. Right: αj,k vs. log2 ∆, estimated on several 1 minute windows for 3 chosen entries. The anomaly is in k = 6, and circles corresponds to the anomalous part.
anomalies. The characteristics and descriptions of the obtained anomalies are summarized in Table 1. This database enables us to assess the performance of the anomaly detection method proposed below. It could also be used to evaluate the performance of other methods.
3 3.1
Multiresolution-Gamma Sketch-based Detection Multiresolution-Gamma Modeling and Sketch Analysis
Sketches. The method is based on a non-Gaussian modeling of the aggregated time-series of sketches of the traffic. Here, we use H different hash functions hn , n ∈ {1, ..., H} with K the (identical) size of each hash table. To reduce the probabilities of collisions, we follow [13] and use 4-universal hash functions. We construct them using the fast-tabulation method of [18]. Typically, we use 2 ≤ H ≤ 10 different hash functions (conceived from known initial random seeds), with 5 ≤ K ≤ 50. Each arriving packet (label i) is assigned in the the k-th entry of sketch, according to each hash function hn applied to the destination IP (IP dst) of the 5-tuple of the IP header. The relation is ki = hn (IP dsti ) ∈ {1, ..., K}. Sketched data then consists of the doublets (ti , ki )hn (where ti denotes the time stamp of the i-th packet). Being interested in bandwidth anomalies against one computer or one sub-network, we use now only the destination IP as an input of the hash table. For anomalies of other natures (port-scans, worms, alpha peaks,...), the method can straightforwardly be extended by hashing the remainder of the 5tuple. Then, we aggregate with respect to time each entry k of the sketch (the n,k packets (ti , ki )hn ) to obtain the time-series X∆ (t), t ∈ Z, consisting of the number of packets observed within bins of size ∆ for the k-th entry (1 ≤ k ≤ K) of the j-th hash function (1 ≤ j ≤ H). Equivalent analyses could be based on bytes aggregated traffic. Fig. 2 representd the total aggregated traffic for one trace, and the time-series of some of the entries of one sketch. For entry 6, the anomaly is apparent, validating the intuition that sketching will increase the SNR for the following detection. Multiresolution-Gamma Modeling. It is well known that aggregated traffic is not in general Gaussian, and that its marginal probability density function (PDF) f∆ (x) is likely to vary both with the aggregation level ∆ and the degree of traffic multiplexing. For example, for backbone links, taking f∆ (x) as Gaussian is a reasonable approximation for ∆ > 1s, whereas it is a very poor one at
6
∆ < 1ms. Based on χ2 goodness of fit tests (details omitted for brevity) applied to data collected over windows T = 1 to T = 10 minutes long, we found that for ∆ ≥ 1ms, f∆ (x) can be well approximated by members from the Gamma family, whose density is given by f∆ (x) = xα−1 e−x/β /(Γ (α)β α ). These findings are in agreement with results in [10, 11] where the same analysis was performed on a much larger number of traces obtained from standard Internet traffic repositories. A Gamma random variable has mean µ = αβ and variance σ 2 = αβ 2 . It is fully characterized via its scale parameter β > 0, and the aptly named shape parameter α > 0. With α close to 0 the density is strongly skewed and exponential-like, but tends to Gaussian in the limit α → ∞. The quantity 1/α thereby gives a measure of distance between the Γα,β and N (αβ, αβ 2 ) laws. For each time-scale ∆, parameters α∆ , β∆ are estimated by standard tools. A major feature is that the model still holds for a large range of aggregation levels ∆ ranging from short time-scales (with near-Poisson PDFs) to large time-scales (with quasi-Gaussian PDFs) and we thus monitor the functions of the time-scales: α∆ and β∆ . The Multiresolution-Gamma Modeling catches not only the marginal (or one-time) properties at all time-scales ∆, but also the correlations in the time-series. Indeed, the PDF of the series aggregated at ∆0 feels the correlations of that aggregated at ∆ < ∆0 . Multiresolution-Gamma modeling and sketches. An original contribution of the present work is that this Multiresolution-Gamma modeling holds for agn,k gregated series of sketches X∆ (t), whether containing anomalies or not. For instance, Fig. 1, left, shows the adequacy of the model for one entry containing the anomaly. The central observation consists of the fact that the evolution of n,k α∆ is altered with respect to ∆ in some entry(ies) of each sketch when attacks occur. This is illustrated on Fig. 1 for one of our experiments (Tfn2k, UDP Flood attack, intensity 7%). For the entry k = 6 is where the traffic of the anomaly is sorted in for the hash function used. The statistical parameters αn,k of the anomalies are shown, estimated over 1 minute windows. For the entry in which the anomaly stands, and the instants when the anomaly occurs, one clearly sees n,k a drastic change of α∆ vs. j = log2 (∆) not only in value but also in shape. This is modification of a statistical signature betrays the botnet attack. Tracking this change is the core of the detection procedure described below. 3.2 Anomaly Detection Principles. The time series under analysis are split into adjacent non overlapping time windows of length T . Independently for each time window and each aggregation level, one computes a distance between a statistical characteristic measured on the current time window indexed by l and that on a reference window. In a second step, one thresholds this distance to detect unexpectedly large deviations, and hence anomalous traffic behaviors. The design of such a detection procedure is subject to three major a priori choices: choice of the reference for normal traffic, choice of the distance and choice of the threshold value. Distances. There exists a very large variety of distances that could be used (cf. e.g., [19] for an exhaustive review). We explore here two of them chosen because they better suit the purposes and intuitions developed here and as they are also
7
known to yield the most robust results. The first distance used is the Mean Quadratic Distances (MQD) for α∆ and β∆ : J J �2 1X 1 X�ˆ 2 Dα (l) = (ˆ α2j (l) − α β2j (l) − βˆ2j (ref ) ˆ 2j (ref )) , Dβ (l) = (1) J j=1 J j=1 Let us note that the distance is multiresolution in its construction: it uses jointly different time-scales ∆ ∝ 2j . Another possibility is to directly use a non parametric distance between the reference distributions and the current ones. For instance, Kullback divergence (KD) between two (possibly multi-dimensional) probability density functions denoted by f1 (x) and f2 (x), is defined as [19] Z KD(f1 , f2 ) = (f1 − f2 )(ln f1 − ln f2 )dx. (2) From this definition, we compute for various aggregation levels, Kullback divergences between the marginal distribution of X∆ estimated within the l−th time (1d) window, f∆ (t), and that obtained from the reference window f∆,Ref : K∆ (l) = (1d) KD(f∆,l , f∆,Ref ). The K∆ at various levels may then combined together to produce multiresolution distances. Note that one could use a multiresolution distance from the KD, by computing Kullback divergences for various pairs of aggregation levels (∆, ∆0 6= ∆) between the joint two-dimensional distributions f∆,∆0 ,l and f∆,∆0 ,Ref obtained from the l−th and reference time windows [11]. The results are comparable to the other distances and were left out for the sake of the simplicity of the discussion.
4
Detection Performance and Perspectives
n,k Distances as a response to attacks. For each series X∆ (t) the reference consists of all the minutes of traffic collected in the absence of the DDoS attack, before and after the anomaly, and therefore assumed to be regular traffic. Note that we are not certain that there is no anomaly caused by others during this time. We adopt thus a pessimistic scenario by assuming there are not because we may perturb the reference and we will count as false alarm anomaly detected outside our attack window when there possibly could be real anomalies! Figure 2 shows, for one experiment the aggregated traces (at 1s) of total traffic and of entries of one sketch, and the corresponding distances. thanks to the use of a high aggregation level, the anomaly can be clearly seen in the proper entry (here k = 6). However, it cannot be simply detected by this clear increase of the mean. Indeed, other sketches (k = 17 for instance in our example) are likely to exhibit equivalent clear increases of their means with no relation to the occurrence of an anomaly. To correctly distinguish the anomaly from a mere increase of traffic, correlations are to be taken into account, hence the interest of the Multiresolution-Gamma modeling. It is clear from this example that the anomaly is detected quickly by applying a proper threshold to the computed distances. Here, we used ∆ = 22 , 23 , . . . , 29 ms for the MQD. The statistical performance of the detection procedure are studied in two ways. First, we determine the natural variabilities of the distances in the absence of anomaly. Comparisons with distances measured in presence of anomalies for a
8
Dα(l)
total
8000 6000
2000
k=1
1000
k=6
50
2000
50
600
50
1000
50
600
0
50
4
2000
0
50
50
0
0
0 0
5
2
200
0
10
400
500
50
0
0 0
0
5
2
0 2000
50
10
400
0
0
0 0
4
200
50
5
0 0
0 10
2
0 0
500
0
50
4
200
0
0
400
1000
k=17
0 600
500 0
0
0
0 0
5
2
200
2000
KL(l) j=3 10
4
400
4000 0
KL(l) j=1
600
0
50
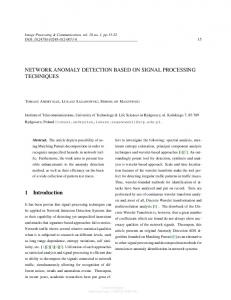
time (s) Fig. 2. Trace of a TFN2k, UDP Flood attack, of intensity 7%; K = 40. Left to right: aggregated traffic over 1s; DQM distance Dα along time, K 1d distance for scale ∆ = 10ms and ∆ = 40ms. Top to bottom: total traffic, then traffic in 3 chosen sketch’s entries (anomaly in k = 6). Asterisks and grey area corresponds to the anomaly. Note that despite the increase of traffic in sketch 17, our procedure based on correlation changes says correctly that there is no anomaly.
variety of attacks (with changing intensity and mechanism) enables us to derive the p-values for the detection procedures, i.e., the probability that the computed distances bypasses a given threshold simply because of the occurrence of natural fluctuations. Figure 3 (a) illustrates such p-values. For a single sketch, this probability is experimentally always found below 4%, and is often much more lower than 1%. Second, we report on Fig. 3 (b-c) the probabilities of detection, via standard Receptor Operational Curves (ROC) consisting of the probability of detection vs. the probability of false alarm. Performance are given for a single 1 minute window-frame. Obtained results are satisfactory. From the derivation of the pvalue, we are able to select a threshold so that the probability of false alarm is set a priori to a chosen level. The KD distance seem to be in general more sensitive than the simpler MQD; the trade-off is here that the MQD is faster to calculate than the KD, and also about the properties for mitigation. To improve robustness, one can use jointly several time-windows, thus handling the classical trade-off: lower false alarm rate vs shorter alert time. The probabilities of detection obtained from the use of 1, 2, or 4 consecutive (1-minute) time windows are shown on Fig. 3 (d). Those probabilities of detection were established experimentally from the database, for a a priori 1% false alarm rate. Improvement in performance is clear, at the price of longer alert times however.
9 Detection by Dα −1
1.1
Prob. Det.(%)
10
p−value
−2
10
Dα KL j=1 KL j=3
−3
10
−4
10
−5
10
0
5
10
15
20
25
0.8
0.6 0.5 0
5
10
15
20
25
1 minute detection Dα: Perf. vs. Intensity
1 minute detection: comparing distances
1
1
0.9
0.8
0.8
0.7
0.6
0.5
0.4
0.3
30
(d)
Intensity (%)
0.9
0.7
0.6
0.5
0.4
0.3
0.2
0.1
0 −4 10
1 min 2min 3min 4min
0.7
0.4
30
0.2
(b)
0.9
Intensity (%)
Exp. Prob. Detection
Exp. Prob. Detection
(a)
1
0.1
−3
10
−2
10
−1
10
Fixed Prob. False Alarm
0
10
0 −4 10
−3
10
−2
10
−1
10
Fixed Prob. False Alarm
0
10
(c)
Fig. 3. Statistical Performance for 1 minute observation. Attacks are: Smurf (4%,o), UDP (7%,*), TCP(12%,triangle), Mixed (27%,diamond). (a) p-value vs. Intensity of the attack. (b) ROC curves of Dα for various intensities. (c) ROC curves for Dα (-), KD j = 1 (–), KD j = 3 (-.), for Smurf (4%,o) and Mixed (27%,diamond). Vertical lines indicate empirical p-values for this experiment/distance. (d) Prob. of detection vs. Intensity for alert time of 1 to 4 min, for prob. of false alarm less than 1%.
Conclusions and Perspectives. This work shows that, using a controlled anomaly database, one can test the statistical performance of anomaly detection method. We have proposed sketch-based, multiresolution-Gamma statistical detection procedures and illustrated their probabilities of detection with respect to the intensity of the anomalies. Because sketches sort the traffic, a straightforward development lies in the identification of the malicious packets. Indeed, due to the use of k-universal hash functions, probability of collisions diminish exponentially with the number of sketches and the inversion of the hashes is made possible by the use of a collection of sketches. This is a very promising research direction with respect to attacker identification currently being developed and implemented. Another feature is that the fast-tabulation method of [18] appears to be scalable for more loaded networks. Therefore, the full procedure, combining hash, multiresolution modeling (implemented by the wavelet pyramidal algorithm) and distances computed over sliding windows, can potentially be implemented on-line. Also, automatic choices of the reference time-window (based on non-stationary signal processing methods) and of the threshold are considered. These different futher developments are under current investigations. We showed in [11] that the combining of the Gamma-modeling with a longmemory farima model enabled us to identify attacks from legitimate flash crowds anomalies. We are currently enquiring on potential extensions when using sketches. Such extensions may also help us to detect new types of anomalies: indeed, any departures from our calibrated regular traffics, flash crowds and DDoS attacks
10
are likely to correspond to a new type of anomaly. It is our opinion that the proposed detection framework for anomaly detection, with one-point measurement only, is flexible enough to allow for the statistical detection and mitigation (or classification) of anomalies.
References 1. Brutlag, J.: Aberrant behavior detection in time series for network monitoring. In: USENIX System Administration Conference, New Orleans (2000) 2. Hussain, A., Heidemann, J., Papadopoulos, C.: A framework for classifying denial of service attacks. In: SIGCOMM, Karlsruhe, Germany (2003) 3. Barford, P., Kline, J., Plonka, D., Ron, A.: A signal analysis of network traffic anomalies. In: ACM/SIGCOMM IMW, Marseille, France (2002) 4. Li, L., Lee, G.: DDoS attack detection and wavelets. In: International Conference on computer communications and networks. (2003) 5. Shyu, M.L., Chen, S.C., Sarinnapakorn, K., Chang, L.: A novel anomaly detection scheme based on principal component classifier. In: Proc. of IEEE Foundations and New Directions of Data Mining Workshop, in ICDM’03. (2003) 6. Lakhina, A., Crovella, M., Diot, C.: Diagnosing network-wide traffic anomalies. In: SIGCOMM. (2004) 7. Lakhina, A., Crovella, M., Diot, C.: Mining anomalies using traffic features distributions. In: ACM SIGCOMM. (2005) 8. Zhang, Y., Ge, Z., Greenberg, A., Roughan, M.: Network anomography. In: ACM IMC. (2005) 9. Park, K., Willinger, W.: Self-similar network traffic: An overview. In Park, K., Willinger, W., eds.: Self-Similar Network Traffic and Performance Evaluation. Wiley (Interscience Division) (2000) 1–38 10. Scherrer, A., Larrieu, N., Borgnat, P., Owezarski, P., Abry, P.: Non gaussian and long memory statistical modeling of internet traffic. In: 4th Workshop IPS-MoMe, Salzburg Research (2006) 176–185 11. Scherrer, A., Larrieu, N., Owezarski, P., Borgnat, P., Abry, P.: Non gaussian and long memory statistical characterisations for internet traffic with anomalies. IEEE Trans. on Depend. and Secure Comp. (2006) accepted. 12. Muthukrishnan, S.: Data streams: Algorithms and applications. In: ACM SIAM SODA. (2003) 13. Krishnamurty, B., Sen, S., Zhang, Y., Chen, Y.: Sketch-based change detection: Methods, evaluation, and applications. In: ACM IMC. (2003) 14. Patwari, N., Hero, A.: Manifold learning visualization of network traffic data. In: SIGCOMM 2005 Workshop on Mining Network Data. (2005) 15. Li, X., Bian, F., Crovella, M., Diot, C., Govindan, R., Iannaccone, G., Lakhina, A.: Detection and identification of network anomalies using sketch subspaces. In: ACM IMC. (2006) 16. Cormode, G., Muthukrishnan, S.: What’s hot and what’s not: Tracking most frequent items dynamically. ACM Transaction on Database Systems 30(1) (2005) 249–278 17. Cheung-Mon-Chan, P., Cl´erot, F.: Finding hierarchical heavy hitters with the count min sketch. In: 4th Workshop IPS-MoMe, Salzburg Research (2006) 9–18 18. Thorup, M., Zhang, Y.: Tabulation based 4-universal hashing with applications to second moment estimation. In: Proc. ACM-SIAM SODA. (2004) 19. Basseville, M.: Distance measures for signal processing and pattern recognition. Signal Processing 18 (1989) 349–369