Statistical Visual Feature Indexes in Video Retrieval Xiangming Mu
Gary Marchionini
School of Information and Library Science,
School of Information and Library Science,
University of North Carolina at Chapel Hill 1-919-962-8274
University of North Carolina at Chapel Hill 1-919-966-3611
[email protected]
[email protected]
ABSTRACT Four statistical visual feature indexes are proposed: SLM (Shot Length Mean), the average length of each shot in a video; SLD (Shot Length Deviation), the standard deviation of shot lengths for a video; ONM (Object Number Mean), the average number of objects per frame of the video; and OND (Object Number Deviation), the standard deviation of the number of objects per frame across the video. Each of these indexes provides a unique perspective on video content. A novel video retrieval interface has been developed as a platform to examine our assumption that the new indexes facilitate some video retrieval tasks. Initial feedback is promising and formal experiments are planned.
Categories and Subject Descriptors H.3.3 [Information Search and Retrieval]
General Terms: Algorithms
partially represent whether a video is “simple and clean” or “busy and complex.” The four new video indexes are: Shot Length Mean (SLM); Shot Length Deviation (SLD); Object Number Mean (ONM); and Object Number Deviation (OND). SLM, the average length of each shot in a video, is utilized to describe the frequency of shot changes. A large SLM number means the average duration of each shot is long, suggesting low action (e.g., lectures, documentaries). SLD, the standard deviation of the shot length for a video, is utilized to measure the spread of shot length. A small SLD means the shot length changes little across the video. Thus, the cadence of the video is fairly static throughout. ONM is the average number of objects per frame in the video. A large ONM can be interpreted as complex scenes (e.g., outdoor shots). OND is the standard deviation of the number of objects across the video and suggests the cadence of action over the entire segment (e.g., the difference between a soccer and a baseball video). 35 Shots Numbers
Keywords: Video Retrieval, index, statistical features 1. Introduction
Copyright is held by the author/owners(s) SIGIR’03, July28-August 1, 2003, Toronto, Canada ACM 1-58813-646-3/03/0007
20 15 10 5 0
1
2
3
4
5
6
7
8
9
Time(Minutes) 1
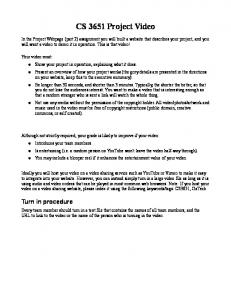
Figure 1: Number of shots per 100 frames for Coney Island , The higher the number, the greater “action”. A and B correspond to a fast moving merry-go-round and roller coaster rides, respectively.
800
2. Statistical Visual Feature Indexes It is fundamentally difficult to catalog videos in terms of subjective descriptions such as “simple, clean, fast, or leisurely”. Based on our experience and interviews with video users, four quantitative indexes are proposed. The following assumptions are made: the frequency of the shot changes indicates whether a video is “fast” or “slow”; the number of objects in each frame might
B
A
25
0
Object Numbers
Visual metadata like key frames are utilized to support nonsemantic queries in content-based video retrieval. However, a big challenge is to form the visual query effectively when users do not have a clear picture about their needs, e.g., “I am looking for a video that goes fast” (rapid shot changes), or “old style, leisurely video” (slow shot changes), or “a video that looks simple and clean” (few objects in frames). In this paper, we introduce two new types of visual metadata: frame correlation coefficients (CC) and frame object numbers (ON). Presumably, such gross characterizations are indicative of video genre (e.g., sports action, talking head lecture) and can be used in conjunction with other traditional metadata to help improve user retrieval. To this end, based on CC and ON, four novel video indexes that describe the video’s statistical visual features are proposed.
30
A
700 600 500 400
B
300
D
C
200 100 0
0
1
2
3
4
5
6
7
8
9
Time(Minutes)
Figure2: Number of objects per frame (average per 100 frames) across the Coney Island1. A and C correspond to scenes of crowds and A, B, D correspond to complex backgrounds, respectively.
1
Downloaded from Open Video digital library (www.open-video.org)
Given various signal and image processing algorithms for video shot detection [1, 2], a simple approach, which is based on the grayscale correlation coefficient between two contiguous video frames, is adopted to calculate the SLM and SLD. The advantage of this algorithm is attributed to its sensitivity to the abrupt shot change, which is exactly what we want for the SLM. A shot is detected when the correlation coefficients between two contiguous frames is less than a threshold value. In this study we choose 0.5 as the threshold. Figure 1 illustrates the number of shots per 100 frames for Coney Island: the higher the number, the greater the “action”. For example, part A and part B correspond to scenes in the video in which the camera or the subjects are in rapid motion. In part A, the camera follows a fast moving merrygo-around; the background blurs as the camera follows the movement of the ride. Part B includes “point of view” shots and depicts the rise and fall of a roller coaster ride. The SLM is 1.61 seconds and SLD is 3.52 seconds. The minimum slot length is 0.03 seconds and the maximum is 26.8 seconds. We can see that this is a fairly “fast” video and the “speed” is not smoothly distributed across the video. A simple algorithm is selected to calculate object numbers for each frame of a video. The boundary detection algorithm is based on the component connection of the binary threshold image which is generated from the original frame using Otsu’s method [3]. Figure 2 illustrates the average number of objects per frame (every 100 frame average) across the video. The peak point A and C correspond to crowd scenes and A, B, D correspond to shots with complex backgrounds, respectively. The ONM is 142 and OND is 93. The maximum ON is 726 and the minimum value is 30.
3. User Interface to Leverage these Indexes
default value of the bar, which is in the middle on the slider, corresponds to the respective index values across all the collections in the video database. For each index, the relative distance from the current slider value is used to calculate a ranking score: the smaller the distance, the higher the score. We give each index equal weight. As a result, the top twelve matched videos are displayed on the left top of the screen as poster frames. Beneath the poster frames there is a panel visually displaying shot and object numbers (as figure1, 2) for a specific video selected from the storyboard by a single click. For instance, in figure 3 The Coney Island is selected. This provides extra visual information at the frame level for advanced users. The actual values of the SLM and ONM, as well as the video title, are displayed beside the panel for quick reference.
4. Discussion and Future Work The new system was informally evaluated inside the Open-Video project and the initial feedback was promising. Some users were particularly excited about the visual representations of the video features such as the CC and ON. As one user said: “Without watching the video, it seems I have already got it and know when the video begins to go fast…. It is very helpful if I am looking for some action scenes”. Although our basic design showed some face validity in our informal trials, this work is still very much a proof of concept. For example, our working definition of “shot” (used in measurement of SLD and SLM) is slightly different from the generic definition of video “shots”. While traditionally “shot” refers to continuous perspective or camera position, here the term describes not only camera movement but also a measurement of movement within the shot itself. Rapid camera or object movements are detected and are defined as “shot” changes in our work, because such rapid movements represent another perspective on “fast.” More research is needed to improve the practical applications of the program; a revision of the object number calculation algorithm to eliminate the systematic errors caused by the system’s determination of the ONM based on object complexity, not object conception, will be a first step. Formal experiments and user studies are planned to fully evaluate the validity, reliability and usability of the system and the user interface. Other indexes such as a color index, audio track index, and shape index, have not been implemented in the existing interface, but are under consideration.
5. ACKNOWLEDGMENTS The work was supported by NSF Grant IIS #0099638 .Thanks to Amy Pattee for the help in the paper revision
6. REFERENCES [1] Idris, F. and Panchanathan, S., “Review of image and video Figure 3: Screenshot of the video retrieval system user interface
A new video retrieval interface based on the four statistical visual feature indexes has been developed for our Open-Video digital library (www.open-video.org), in which more than eighteen
hundred digitized video segments with lengths from several seconds to nearly an hour are available. Figure 3 is a sample screenshot. Four slider bars are provided on the top right, allowing users to control the selection of the desired values of SLM, SLD, ONM, and OND. A dynamic query is automatically formed in accordance to the combination of these values. The
indexing techniques”, Journal of Visual Communication and Image Representation, 8: 146-166, 1997
[2] Zhang, H.J., Low, C. Y., Smoliar, S. W., and Wu, J. H., “Video Parsing, Retrieval and Browsing: An Integrated and Content-Based Solution”, ACM Multimedia 95,1995, San Francisco, California.
[3] Otsu, N., "A Threshold Selection Method from Gray-Level Histograms," IEEE Transactions on Systems, Man, and Cybernetics, vol. 9, no. 1, pp. 62-66, 1979.


![Presentation: WebM Open Video Project Update - Streaming Media [PDF]](https://m.moam.info/img/260x300/presentation-webm-open-video-project-update-stream_64b856bc098a9eaf458b45ea.jpg)

