1963), there has been a widely-held vision of unencumbered tablet computers that ... (Matsakis 1999) to music notation (Blostein and Haken. 1999). Even less ...
Statistical Visual Language Models for Ink Parsing Michael Shilman, Hanna Pasula, Stuart Russell, Richard Newton Department of Computer Science University of California at Berkeley Berkeley, CA 94720 {michaels, pasula, russell, newton}@eecs.berkeley.edu
Abstract
1
In this paper we motivate a new technique for automatic recognition of hand-sketched digital ink. By viewing sketched drawings as utterances in a visual language, sketch recognition can be posed as an ambiguous parsing problem. On this premise we have developed an algorithm for ink parsing that uses a statistical model to disambiguate. Under this formulation, writing a new recognizer for a visual language is as simple as writing a declarative grammar for the language, generating a model from the grammar, and training the model on drawing examples. We evaluate the speed and accuracy of this approach for the sample domain of the SILK visual language and report positive initial results.
Introduction Since Ivan Sutherland pioneered pen-based computing with his SketchPad system over three decades ago (Sutherland 1963), there has been a widely-held vision of unencumbered tablet computers that present the feel of interactive, smart paper. Over years, we have seen numerous prototype systems that allow users express themselves directly in an appropriate syntax for different application domains, ranging from as flow-charts (Gross 1994) to mathematics (Matsakis 1999) to music notation (Blostein and Haken 1999). Even less structured domains like user interface and web page design can have their own domain-specific visual notation (Lin et al. 2000). Researchers have shown that such sketch-based applications can combine many of the benefits of paper-based sketching with current electronic tools to enable important new creative and collaborative usage scenarios (Landay and Myers 1995). Unfortunately, while we are on the verge of having suitable mass-market hardware devices to support the pen computing vision, we lack the software technology to adequately implement many of the most useful software applications that will run on these devices. This is not to say that researchers haven’t built a variety of toolkits to support Copyright © 2000, American Association for Artificial Intelligence (www.aaai.org). All rights reserved.
sketch-based application prototyping. Existing toolkits support digital ink capture and storage, facilities for interpreting and beautifying sketched ink (Hong and Landay 00), and even sophisticated reusable schemes for user correction of incorrect interpretations (Mankoff, Hudson, and Abowd 2000). However, we believe that the problem of robust sketch recognition has been largely ignored and is crucial to the ultimate success of sketchbased user interfaces in the real world. The goal of this research is to move beyond prototyping and push recognition accuracies to a point where these systems are useful and predictable to end users. Our work is based on the intuition that considering multiple ambiguous interpretations in a well-characterized syntactic context will result in far more accurate interpretations. We formalize this intuition in a visual language parsing framework, and describe an initial solution based on a new statistical disambiguation technique. In our implementation of this approach, a user specifies a visual language syntax in a declarative grammar, automatically generates a parser from the specification, and trains the parser on a collection of drawing examples. For a representative visual language we compare a standard ambiguous parsing algorithm to our statisticallyaugmented version and begin to quantify the performance and accuracy benefits that come with a formal statistical model. In addition to basic improvements in recognition accuracy, the approach provides a simple way to trade-off accuracy for speed.
Application
Dialog box
Web page
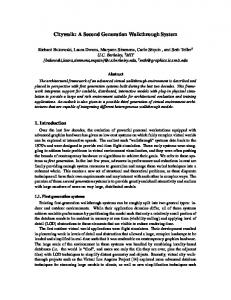
Figure 1. Hand-sketched SILK diagrams.
To demonstrate our technique, we have implemented a recognizer for the SILK sketched visual language (Landay and Myers 1995). SILK is a tool that allows users to sketch, annotate, and evaluate graphical user interfaces in digital ink, combining digital interactivity with the ease and flexibility of paper. We use SILK examples throughout the paper to illustrate points of our approach.
ambiguity in typeset diagrams, categorizing them as lexical or structural (Futrelle 1999). Lexical ambiguities are ambiguities at the level of the terminal symbol. For instance, in the context of a drawing, an arrow can be a vector (with position, orientation, and magnitude), a transition (as in a finite-state diagram), or a designator (pointing to an object).
Previous Work We suggest that current approaches to sketch recognition all suffer from fundamental limitations in the accuracy they can achieve due to their naïve treatment of the inherent ambiguity in sketched drawings. Popular recognition algorithms such as Rubine’s (Rubine 1991) recognize shapes from individual strokes and are crippled by their lack of contextual information. Recognition systems that consider multiple strokes often employ some variant of a parsing algorithm, in which a series of pattern matching rules are fired hierarchically based on recognition of single strokes (Helm, Marriot, and Odersky 1991, Gross 1996, Landay 1996). In fact, most existing ink parsing approaches are adapted from algorithms originally designed to operate on unambiguous tokens, such as text typed in at the keyboard or symbols dragged from a palette. However, sketched ink is inherently ambiguous: a user-drawn square might easily be misinterpreted as a circle if it is drawn with rounded corners, or a circle might be misinterpreted as a sloppily-drawn square. Without intelligent treatment of this and other forms of drawing ambiguity, accurate sketch recognition is not possible. To deal with the inherent ambiguity in sketched drawings, a recognizer must use context. Visual languages (Marriot and Mayer 1997) provide such a context. In this view, a drawing is a message communicated in sketched ink, and the recognizer is a decoder for that message. Formal language theory provides a well-understood and accepted language for describing such messages (Aho and Ullman 1972). In fact, the sketch recognition systems described in (Helm, Marriot, and Odersky 1991, Gross 1996, Landay 1996) were all based on variants of visual language grammars. However, although these prior efforts provide a context for resolving ambiguity, their use of grammars was primarily as a concise way to specify valid visual structures, and did not focus on ambiguity. In contrast, there are plenty of other fields that have dealt with ambiguity in various levels of formality. For instance, ambiguity is a staple of linguists and formal language theorists. As a simple example, in the sentence “He saw the teacher with the glasses,” the phrase “with the glasses” could modify either the noun “teacher” or the verb “to see.” Similarly, visual languages have their own set of common ambiguities. In his work on diagram parsing for scientific document analysis, Futrelle enumerates numerous forms of
(c)
(b) (d) (a)
Figure 2. A sketched diagram containing several examples of ambiguity. Structural ambiguities occur at non-terminal symbols and involve spatial relationships between objects: • Attachment ambiguity is typified by multiple interpretations of what a text element is labeling (Figure 2a) • Gap ambiguities occur when gaps in the diagram imply omitted values for which the reader will choose the correct filler (Figure 2b). • Role ambiguities occur when the structure of part of the picture is clear, but its role is not. For instance, in Figure 2c, the legend could easily be mistaken for more data. • Segmentation ambiguities occur when single terminal symbols are used to represent multiple syntactic entities. For instance in Figure 2d, the tick marks at the origin could simply be continuations of the axis line, rather than distinct marks on their own. • Occlusion ambiguities occur when visual occlusion gives rise to multiple interpretations of the scene. Sketched visual languages add at least two new forms of ambiguity that must be considered when parsing: • Label ambiguity, in which the labeling of basic shapes is ambiguous, as in the square-circle case mentioned earlier. • Attribute ambiguity, in which there is uncertainty about any attributes of the shapes. For example, the point that defines the tip of an arrow-head is not given explicitly by the user, and must be derived by the lowlevel recognizer.
An explicit treatment of ambiguity in visual languages enables the application of existing disambiguation techniques. For instance, many of the documented disambiguation techniques for string languages generalize to attribute grammars (Maddox 1997), which are a flexible way to carry context in a parsing operation. Statistical models are another common disambiguation technique for string languages. With this approach, ambiguity is represented as probability distributions over variables that affect parsing results. These models are particularly useful for domains with continuous components, such as speech and handwriting recognition. For example, Hidden Markov Models (Rabiner and Juang 1996) and N-grams have been used successfully in both domains.
Our Approach In the previous section, we established ambiguity as a key problem in sketch recognition and outlined the ways ambiguity has been handled in the past. Our work combines a visual language formalism reminiscent of (Helm, Marriott, and Odersky 1991) with a novel statistical model for disambiguation. In this section, we describe our approach in detail. We start with an overview of the system, including our visual language specification language and examples. Next, we describe our statistical model and relate this to the visual language. Finally, we describe the parsing algorithm which performs inference on the statistical model.
Overview In our system, the process of constructing a new recognizer for a visual language consists of writing a declarative grammar for the language, generating a model from the grammar, and training the model on example drawings. The resulting recognizer is a software component that accepts raw ink strokes as input, and returns parse trees as its output (Figure 3). The recognizer can operate on a set of strokes (in batch), or incrementally on individual strokes as they are added, although the details of these two modes are outside the scope of this paper. Visual Language Grammar
Labeled Statistical Statistical Data Grammar Grammar
As in (Helm, Marriott, and Odersky 1991), our visual language specification is a declarative context-free grammar. Each rule in the grammar consists of a left-hand side, which is a label, and a right hand side which is a set of pairs representing entities on the page and a set of spatial constraints amongst these entities. For example, the “scrollbar” rule from the SILK language is represented in the following way: vscroll ::= border:vrect handle:square upArrow:upTri downArrow:downTri { // top and equal width dist(upArrow.NORTH,border.NORTH). range(0,20); widthRatio(upArrow,border).range(.4,1.1); // bottom side and equal width dist(downArrow.SOUTH,border.SOUTH). range(0,20); widthRatio(downArrow,border). range(.4,1.1); // center and equal width deltaX(handle.CENTER,border.CENTER). range(-20,20); deltaY(handle.CENTER,border.CENTER). range(-30,30); widthRatio(handle,border).range(.4,1.1); }
In this example, the constraints between variables are represented as hand-coded thresholds. These thresholds are analogous to those used in existing systems, such as (Landay 1996). They are used initially to help generate ground truth data for training the model, but the primary purpose of constraints is to indicate which spatial relationships are significant for the statistical model, which will override these initial values. The full set of relations that are expressible in the grammar is: • Distance, DeltaX, DeltaY – Distance measures between sites on an entity • Angle – Angles between sites on an entity • WidthRatio, HeightRatio – Size ratios between entities • Overlap – Degree of overlap between entities While these relations are not expressive enough to capture all visual languages, we believe that it is sufficient to demonstrate our approach on meaningful examples.
Parser Parser Generator Generator
Statistical Model Compile-Time Run-Time
Statistical Statistical Parser Parser Strokes
Parse Tree
Figure 3. High-level system schematic.
No previous work has applied a statistical language model approach to contextual disambiguation of sketched drawings. Yet such an approach seems to be a natural fit for the ambiguity characteristics of sketched drawings (i.e. noise on continuous variables). Thus, given a visual language grammar, the primary contribution of this work is to synthesize a statistical model for disambiguation.
Statistical parsing algorithms work by calculating the maximum likelihood parse of its inputs. That is, given a grammar annotated with probability distributions and an observed page of ink, the parser determines the highestconfidence invocation of rules to generate that ink. For string parsing, the Viterbi algorithm is a standard method of calculating this parse (Rabiner and Juang 1996). However, to our knowledge there are no documented analogs for statistical visual language parsing. Inspired by statistical string parsing techniques, our model is based on Bayesian statistics. In other words, the model is generative, meaning roughly that it encodes p(ink | label) and p(label) and uses this to derive p(label | ink) for observed ink. The application of this concept is seen clearly in the naïve Bayesian classifier, which is a common technique for statistical classification, and a precursor for our own model (Jordan and Bishop 2000). The classifier determines a label from a series of observed features. In the case of basic shape recognition, the label is a value such as “square” or “circle”, and the features are scalar values measured from the ink such as aspect ratio, number of corners, total curvature, etc. The model encodes each p(label) and p(featurei | label), which are distributions learned from a training set. Visually, the relationship between the label and each of the features can be represented in the following way, using the “graphical model” notation of (Jordan and Bishop 2000): feature 1 label
…
feature 2
feature n
Figure 4. Graphical model for a naïve Bayesian classifier. In this representation, filled nodes are observed variables, empty nodes are unobserved, and edges represent dependence relationships. The figure shows that the features are only related to one another through the label, and are not directly dependent on one another. In general, this may not be the case, but practically this assumption does not cost too much in final accuracy. Given this assumption, p(label | features) can be calculated through a simple application of Bayes rule:
p(l ∧ { f i }) = p(l | { f i }) = p ({ f i })
To get from the first step to the second, the structure of the graphical model is used to separate the numerator into a product of simpler conditionals, and we normalize over all possible class labels to derive the denominator. Our extension of this concept to visual language parsing encodes features for basic shape recognition, borrowed from (Rubine 1991), as well as the spatial relations from the grammar. In our model, the spatial relations given by the grammar are converted from hand-coded ranges into learned Gaussian probability distributions: 1
0
constraints
1
0
distributions
Figure 5. Variables such as distance typically represented in parsers as thresholded ranges can also be viewed as statistical distributions. For example, a statistical representation of the scrollbar rule from above would be: vscroll ::= border:vrect handle:square upArrow:upTri dnArrow:downTri { // top and equal width dist(upArrow.NORTH,border.NORTH).gaussian(11.3,5.0); widthRatio(upArrow,border).gaussian(.6,.4); // bottom side and equal width dist(dnArrow.SOU,border.SOU).gaussian(18.7,10.1); widthRatio(downArrow,border).gaussian(.8,1.1); // center and equal width deltaX(handle.CENTER,border.CENTER).gaussian(5.3,21.5); deltaY(handle.CENTER,border.CENTER).gaussian(5.5,30.1); widthRatio(handle,border).gaussian(.7,.9); }
Using the graphical model notation above, our model is represented as: Basic Labels
Composite Label
N Basic Features M
p (l )∏ p ( f i | l ) { fi }
∑ p(l )∏ p( f i | l ) l
{ fi }
In this derivation, l is the class label and fi is the i’th feature. The values p(l) and p(fi | l) are obtained by some form of parameter estimation, such as training or guess. The first step of the derivation is a direct application of Bayes rule.
Composite Features P
Figure 6. Graphical model for our composite statistical representation of a visual language.
To simplify the diagram, we have added “plates” as syntactic sugar for multiplicity. In other words, the sub-tree containing the basic labels and features is equivalent to the Naïve Bayesian Classifier. Basic features are those of (Rubine 1991). Basic labels are shapes, such as square, circle, etc. Composite features are our spatial relations encoded in the grammar, such as distance, overlap, etc. Composite labels are the right-hand sides in the grammar, such as vscroll. This model can be extended hierarchically upward to capture the full visual language. To perform inference on the model, an analogous derivation to that of the naïve Bayesian classifier yields:
p( L | {li } ∧ { f j }) =
p ( L ∧ {li } ∧ { f j }) p({li } ∧ { f j })
p( L)∏ p (li | L)∏ p ( f j | L) =
{l i }
{ f j}
∑ p( L)∏ p(li | L)∏ p( f j | L) L
{l i }
{ f j}
where L is the composite label, li is the i’th basic label, and Fj is the j’th composite feature.
Parsing Algorithm As introduced in the previous section, the purpose of the statistical model is to relate observed pen strokes to probabilities on parse tree nodes. However, to evaluate the model on a particular page of ink, we need some an approximation technique to tractably search through the different possibilities. We accomplish this through a simple parsing algorithm. Our parsing algorithm is implemented in a somewhat naïve way. Rather than focusing on reducing the two-dimensional parsing algorithm to a standard LR parsing algorithm or making use of spatial locality to prune the search, we focused on a simple incremental approach. Each time a symbol is added to the scene, only parses that are relevant to that new symbol are added to the parse tree (Figure 7).
Figure 7. An incremental parse only computes the necessary new nodes in the tree.
This algorithm is implemented by the following piece of pseudocode. NodeList parse(Node n) { NodeList out = new NodeList(); foreach Rule r with n’s label in right hand side { foreach NodeSet s containing n whose labels match r’s right hand side { Node n2 = r.match(s); if(n2 != null && n2.getConfidence() > THRESHOLD_CONFIDENCE) { out.concat(parse(n2)); } } } return out; }
In this code, the only “black box” is the rule’s match method. The match method takes as its argument a set of parse tree nodes, and returns a new parse tree node that has been added to the tree if the given set matches the rule’s criteria. Otherwise it returns null to denote that no match has been made. Typically match methods are synthesized from the model, although in our implementation it is also possible to hand-code them for more fine-grained control of what constitutes a match. Each node also has a confidence attached, computed using the statistical model as described in the previous section. This confidence is compared to a parameter which prunes low-confidence nodes. The experimental part of this project, described below, measures the effects of varying this parameter on the speed and accuracy of the parsing algorithm.
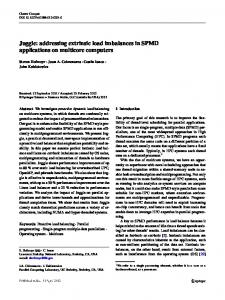
Initial Evaluation Our evaluation was conducted on a grammar for a larger set of SILK widgets. The grammar included rules for some common widgets, including buttons, scrollbars, check boxes, radio buttons, menus, and panels, as well as logical layouts in which to combine them. A small set of slightly over 600 user files was collected from a handful of users and manually labeled. We used 80% of the files to train the statistical model and the rest of the files to test our approach. The speed and accuracy of the system was evaluated relative to a thresholded parsing algorithm, reminiscent of numerous existing approaches such as (Helm, Marriott, and Odersky 1991). As described in the previous section, our algorithm can be tuned with a pruning parameter. We found that for a wide range of parameter values it outperforms existing work in both recognition accuracy and execution speed. These results are summarized below:
100
used this approach to build a parser for the SILK visual language. According to initial experimental results, the approach appears to be both faster and more accurate than previous grammar-based recognition techniques when applied to this domain.
Top3
90
Top1
Stroke-Level Accuracy
80 Top3' 70
Top1'
60
We plan to expand the evaluation of work through the use of more sophisticated metrics and with more data over a broader range of visual languages. Most statistical methods require a significant amount of training data to start performing really well, and our training set was sparse.
50 40 30 20 10
In addition, this work raises the following open questions:
0 0
200
400
600
800
1000
1200
1400
1/Speed
This figure depicts the accuracy of our recognizer versus 1/speed. The accuracy is measured as percentage correct stroke labeling (Top1) and also whether the correct labeling was in the top three choices, for ease of correction (Top3). 1/Speed is measured as number of nodes visited. We measured it this way rather than in user time to normalize out implementation details. The curves represent different thresholds, and the stars represent the unassisted Rubine’s recognizer with a thresholded parser. Because the stars occur below the curves, we conclude that for many values of the threshold parameter our statistical approach is a substantial improvement over its thresholded equivalent. Subjectively, we found that nearly all of the errors committed by this algorithm ultimately resulted from nonsensical classification results returned by the basic shape classification from Rubine’s feature set. These typically occurred in situations where the user sketched very quickly and the basic shape was significantly distorted. In these cases, the algorithm either pruned those choices early on, or couldn’t compensate for this error with context due to some ambiguity in the spatially-defined choices. As for real execution speed, the algorithm runs in real-time for the small drawings (< 100 strokes) that we tested it with. In our limited experience with unconstrained freeform notes containing both writing and drawings, the number of strokes is anywhere from 400 average to 5000 maximum. It is unclear whether the current algorithm would scale to larger files such as this, though we are aware of other approximation algorithms from the Machine Learning community, such as MCMC (Neal 1993), which might be preferable alternatives for our simple parsing algorithm.
Conclusions and Future Work In this paper, we pose sketch understanding as a visual language parsing problem. We formalize the ambiguity of sketched visual languages in a new way and motivate the use of statistical disambiguation techniques to resolve it. We then present a practical methodology for building statistical models of context-free visual languages, as well as a parsing algorithm that can trade off speed and accuracy. We have
• Are there better statistical models for visual language disambiguation? • Can stroke sequence help disambiguate further? Is it appropriate to encode this in the model? • Are there better ways to evaluate the model than the simple parsing algorithm presented here?
Acknowledgments This work was supported in part by the MARCO/DARPA Gigascale Silicon Research Center and Synopsys. We also thank Joern Janneck, John Reekie, Heloise Hse, and Andy Begel for valuable discussions and feedback.
References M. Gross 1996. The Electronic Cocktail Napkin – A computational environment for working with design diagrams. Design Studies, 17(1):53--69. J. Landay and B. Myers 1995. Interactive Sketching for the Early Stages of User Interface Design. Proceedings of CHI '95, Denver, CO, pp. 43-50. A. Aho and J. Ullman 1972. The Theory of Parsing, Translation and Compiling, Vol. I: Parsing. Prentice-Hall, Englewood Cliffs, N.J. R. Futrelle 1999. Ambiguity in Visual Language Theory and its Role in Diagram Parsing. IEEE Symposium on Visual Languages 1999, Tokyo, JP. pp. 172-175. D. Rubine 1991. Specifying gestures by example. SIGGRAPH 91, Las Vegas, NV. July 1991, p.329-37. M. Jordan and C. Bishop 2002. Graphical Models for Statistical Learning. Forthcoming. R. Helm, K. Marriott, and M. Odersky 1991. Building visual language parsers. CHI '91. New Orleans, LA, April 1991. pp.105-112. J. Lin, M. Newman, J. Hong, and J. Landay 2000, DENIM: Finding a Tighter Fit Between Tools and Practice for Web Site Design. In CHI Letters: Human Factors in Computing Systems, CHI 2000. 2(1): pp. 510-517.
J. Hong and J. Landay 2000. SATIN: A Toolkit for Informal Ink-based Applications. Proceedings of User Interfaces and Software Technology: UIST 2000, San Diego, CA., November 2000. I. Sutherland 1963, SketchPad: A Man-Machine Graphical Communication System, in AFIPS Spring Joint Computer Conference. 23. pp. 329-346. M.D. Gross 1994. Stretch-A-Sketch: a dynamic diagrammer. Proceedings. IEEE Symposium on Visual Languages. Los Alamitos, CA, USA: IEEE Comput. Soc. Press. D. Blostein and L. Haken 1999. Using Diagram Generation Software to Improve Diagram Recognition: A Case Study of Music Notation. IEEE Transactions on Pattern Analysis and Machine Intelligence, Vol. 21, No. 11 J. Mankoff, S. Hudson, and G. Abowd 2000. Providing Integrated Toolkit-Level Support for Ambiguity in Recognition-Based Interfaces. In Proceedings of CHI 2000. April, 2000. N. Matsakis 1999. Recognition of Handwritten Mathematical Expressions. Master’s Report, Massachusetts Institute of Technology. J. Landay 1996. Interactive Sketching for the Early Stages of User Interface Design. Ph.D. dissertation, Report #CMUCS-96-201, Computer Science Department, Carnegie Mellon University, Pittsburgh, PA. K. Marriott and B. Mayer 1997. On the classification of visual languages by grammar hierarchies. Journal of Visual Languages and Computing, vol.8, (no.4), Academic Press, Aug. 1997. p.375-402. W. Maddox 1997. Incremental Static Semantic Analysis. Ph.D. dissertation TR-UCB-CSD-97-948. Computer Science Division (EECS), University of California, Berkeley. L. R. Rabiner and B. H. Juang 1986. An Introduction to Hidden Markov Models. IEEE ASSP Magazine, pp. 4-16. R. Neal 1993. Probabilistic Inference using Markov Chain Monte Carlo Methods. Dept. of Computer Science, University of Toronto. Technical Report CRG-TR-93-1.