Jul 22, 2015 - the spike in the series, neuron n encodes the signal u(t) by: ...... Anand, Bussat, Jean-Marie, Alvarez-Icaza, Rodrigo, Arthur, John V., Merolla, Paul, & Boa- ... Buracas, G.T., Zador, A.M., DeWeese, M.R., & Albright, T.D. 1998.
arXiv:1507.06222v1 [cs.NE] 22 Jul 2015
1
STICK: Spike Time Interval Computational Kernel, A Framework for General Purpose Computation using Neurons, Precise Timing, Delays, and Synchrony Xavier Lagorce, Ryad Benosman Vision and Natural Computation Group, Institut National de la Sant´e et de la Recherche M´edicale, Paris F-75012, France, Sorbonne Universit´es, Institut de la Vision, Universit´e Paris 06, Paris F-75012, France, and also with Centre National de la Recherche Scientifique, Paris F-75012, France.
Keywords: precise timing, computation, non-linear differential equations
Abstract There has been significant research over the past two decades in developing new platforms for spiking neural computation. Current neural computers are primarily developed to mimick biology. They use neural networks which can be trained to perform specific tasks to mainly solve pattern recognition problems. These machines can do more than simulate biology, they allow us
to re-think our current paradigm of computation. The ultimate goal is to develop brain inspired general purpose computation architectures that can breach the current bottleneck introduced by the Von Neumann architecture. This work proposes a new framework for such a machine. We show that the use of neuron like units with precise timing representation, synaptic diversity, and temporal delays allows us to set a complete, scalable compact computation framework. The presented framework provides both linear and non linear operations, allowing us to represent and solve any function. We show usability in solving real use cases from simple differential equations to sets of non-linear differential equations leading to chaotic attractors.
1
Introduction
More than 50 years after the first Von Neumann single processor, it is becoming more and more evident that this sequential power greedy architecture scales poorly to multiprocessors. Despite the increase of the size of on-chip cache to stay away from RAM and to put the data closer to the processor, major processor manufacturers have run out of solutions to increase performances. The current solutions to use multicore devices and hyperthreading tries to overcome the problem by allowing programs to run in parallel. This parallelism is however limited as hyper-threaded CPUs even if they include extra registers still have only one essential element of most basic CPU features (Sutter, 2005). The quest for a more power efficient alternative has seen a major breakthrough these last years, specially in asynchronous brain like dataflow architectures. Recent endeavours, such as the SyNAPSE DARPA program, led to the development of silicon neuromorphic neural chip technology that allows to build a new kind of computer with similar function, and architecture to the brain. The advantage of these systems is their power efficiency and the scaling of performance with the number of neurons and synapses used. There are currently several available platforms,
2
to cite the most sucessful: IBM TrueNorth (Merolla et al. , 2014), Neurogrid (Benjamin et al. , 2014), SpiNNaker (Furber et al. , 2014), FACETS (Schemmel et al. , 2008). These machines seem to be primarly intended to simulate biology, their main application being currently in the field of machine learning and more specifically running deep learning architectures such as deep neural networks, convolutional deep neural networks, deep belief networks and recurrent neural networks. These techniques have shown to be efficient in several fields such as machine vision, speech recognition and natural language processing. Other options exists such as the Neural Engineering Framework (NEF), that has shown to be able to simulate brain functionalities and provides networks that can accomplish visual, cognitive, and motor tasks (Eliasmith et al. , 2012). NEF intrinsically uses a spike rate-encoded information paradigm and a representation of functions using weighted spiking basis funtions; it thus requires a very large number of neurons to compute simple functions. Other methods synthetize spiking neural networks for computation using Winner-Take-All (WTA) networks (Indiveri, 2001), or more vision dedicated spiking structures such as convolutional neural networks (Zamarreo-Ramos et al. , 2013). Linear Solutions of Higher Dimensional Interlayers networks (Tapson & van Schaik, 2012) are another class of approaches that are currently used to derive what is called Extreme Learning Machine (ELM) (Huang & Chen, 2008). Recently the Synaptic Kernel Inverse Method (SKIM) framework (Tapson et al. , 2013) has been introduced, it uses multiple synapses to create the required higher dimensionality for learning time sequences. These methods use random nonlinear projections into higher dimensional spaces (Rahimi & Recht, 2009; Saxe et al. , 2011). They create randomly initialized static weights to connect the input layer to the hidden layer, and then use nonlinear neurons in the hidden layer (which in the case of NEF are usually leaky integrateand-fire neurons, with a high degree of variability in their population). The linear output layer allows for easy solution of the hidden-to-output layer weights; in NEF this is computed in a single step by pseudoinversion, using singular value decomposition. 3
Our method goes beyond the classical point of view that neurons transmit information exclusively via modulations of their mean firing rates (Shadlen & Newsome, 1998; Mazurek & Shadlen, 2002; Litvak et al. , 2003). There seems to be growing evidence that neurons can generate spike-timing patterns with millisecond temporal precision in (Sejnowski, 1995; Mainen & Sejnowski, 1995; Lindsey et al. , 1997; Prut et al. , 1998; Villa et al. , 1999; Chang et al. , 2000; Tetko & Villa, 2001). Converging evidence suggests also that neurons in early stages of sensory processing in primary cortical areas (including vision and other modalities) use the millisecond precise time of neural responses to carry information (Berry et al. , 1997; Reinagel & Reid, 2000; Buracas et al. , 1998; Mazer et al. , 2002; Blanche et al. , 2008). Our approach will also make use of precisely timed transmission delays. The propagation delay between any individual pair of neurons is known to be precise and reproducible with a submillisecond precision (Swadlow, 1985, 1994). Axonal conduction delays in the mammalian neocortex (Swadlow, 1985, 1988, 1992) are known to range from 0.1 ms to 44 ms. Finally we will also use the property of biological neurons that states the same presynaptic axon can give rise to synapses with different properties, depending on the type of the postsynaptic target neuron (Thomson et al. , 1993; Reyes et al. , 1998; Markram et al. , 1998). In this paper we are interested in deriving a new paradigm for computation using neuron like units and precise timing. The goal is to design micro neural circuits operating in the precise timing domain to perform mathematic operations. We show that when using computation units that have common properties with biological neurons such as precise timing, transmission delays, and synaptic diversity, it becomes possible to derive a Turing complete framework that can compute every known mathematical function using a non Von Neumann architecture. The presented framework allows to derive all mathematical operators whether they are linear or non linear. It also allows relational operations that are essential to develop algorithms. The precise 4
timing framework has a compact representation and it uses a low number of neurons to solve complex equations. Examples will be shown on first and second order differential equations. The developed methodology is in adequation with scalable neuromorphic architectures that make no distinction between memory and computation. Every synapse of each computational unit of the model simultaneously stores information and uses this information for computation. This contrasts with conventional computers that separate memory and processing thus causing the von Neumann bottleneck where most of the computation time is spent in moving information between storage and the central processing unit rather than operating on it (Backus, 1978). The developed approach is easily scalable and is designed to naturally operate using an event-driven massive parallel communication similar to biological neural networks.
The next section describes the neural model used in this work and the encoding scheme chosen to represent values in the exact timing of spikes. It also describes neural networks implementing elementary operations that can be assembled to implement arbitrary calculus. We then present results of applications of such networks, followed by a discussion on the methods proposed in this work and a conclusion.
2 2.1
Methods Neural model
These neuron-like computational units use the following neural model: τm . dV = ge + gate.gf dt
dge dt
τf .
dgf dt
=
0
=
−gf
(1)
V is the membrane potential of the neuron. We consider here that there is no leakage of 5
the membrane potential (or that the time constant of this leakage is much slower than all the other time constants considered in this work, in which case it can be neglected). ge represents a constant input current which can only be changed by synaptic events. gf represents input synapses with exponential dynamics. These synapses are gated by the gate signal which is triggered by synaptic events. For the experiments presented in this work, we use τm = 100s and τf = 20ms. We thus distinguish 4 type of synapses, where w is the weight of the synapse: • V − synapses directly modify the membrane potential value: V ← V + w, • ge − synapses directly modify the constant input current: ge ← ge + w, • gf − synapses directly modify exponential input current: gf ← gf + w, • gate − synapses : w = 1 activate the exponential synapses by setting gate ← 1; w = −1 deactivate the exponential synapses by setting gate ← 0. All synaptic connections are also defined by a propagation delay between the source and target neurons. A neuron spikes when its membrane potential reaches a threshold, i.e.:
V ≥ Vt
(2)
it then emits a spike and is reset by putting back its state variables to:
V
← Vreset
(3)
ge ← 0
(4)
← 0
(5)
gate ← 0
(6)
gf
6
without loss of generality, we will consider Vt = 10mV and Vreset = 0 to simplify the following equations. In the following subsections, we use the following notations. Tsyn is the propagation delay between two neurons for standard synapses. Tneu is the time needed by a neuron to emit a spike when triggered by an input synaptic event; it can model, for instance, timesteps of a neural simulator. In the experiments presented in this work, we use Tsyn = 1ms and Tneu = 10us. We define we as the minimum excitatory weight for V − synapses required to trigger a neuron in its reset state, and wi the inhibitory weight of counteracting effect: we = V t
(7)
wi = −we
(8)
Standard weights for ge − synapses will be defined in the next subsection.
2.2
Signal representation
The main idea of the method proposed in this work is to represent values as the precise time interval in between two spikes. If the series en (i) is the list of times at which neuron n emitted spikes, with i the index of the spike in the series, neuron n encodes the signal u(t) by: u(en (i)) = f −1 (en (i + 1) − en (i)), ∀i = 2.p, p ∈ N,
(9)
with i an even number and f −1 the inverse of the encoding function f of our choice. The encoding function f : R → R can be chosen depending on the considered signals in a particular system and adapted to the required precision. f computes the interspike time ∆t associated with a particular value. In the following work, we chose to represent values using the following linear encoding function: ∆t = f (x) = Tmin + x.Tcod , 7
(10)
with x ∈ [0, 1] and Tcod the elementary time step. This representation allows us to encode any value between a minimum and a maximum interspike (of Tmin and Tmax = (Tmin + Tcod )). We chose to use a minimum interspike to encode zero for several reasons. If the two spikes encoding a value originate from one unique neuron or are received by a single neuron, this minimum interspike gives time to recover from the first spike before spiking again. Tmin allows networks to react to the first input spike and propagate a state change before the second encoding spike is received. In the experiments presented in this work, we use Tmin = 10ms and Tcod = 100ms. We could also choose a logarithmic function to allow encoding a large range of values with dynamic precision (precision would be smaller for large values).
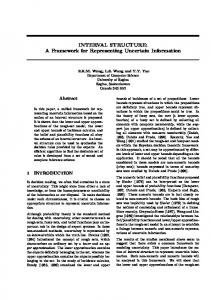
To represent signed values, we use two different pathways for the two different signs. Positive values will be encoded by causing a neuron to spike and negative values by eliciting another neuron to spike. We arbitrary chose to represent zero as a positive value. To ease the understanding and the routing of several networks, each implementing simple operations, we add some interface neurons to these networks. For instance, the input of the networks are materialized by special input neurons. Their output by some output, output + or output - neurons. Other special neurons used for interaction between networks are also marked. In all the following figures describing networks, neurons in blue will be input neurons to the networks whereas neurons in red will be output neurons of the circuit. The simple network presented in Fig. 1 encodes a constant value. It shows the design principles which will be used in the rest of this section. In the network shown in Fig. 1, the recall neuron is an input. When a spike is received by recall, the constant value encoded in the network is output to the output neuron. In this example, the output is generated by two different synaptic connections from recall to output. They generate two output spikes with the interspike
8
Figure 1: A network generating a constant value when required. When the recall neuron is activated, the output neuron will generate a pair of spikes coding for value x. corresponding to the encoded value.
We define standard weights for ge − synapses. Let wacc be the weight value for ge synapses to cause a neuron to spike from its reset state after time Tmax = Tmin +Tcod . According to Eq. 1, we have: Vt =
wacc .Tmax τm
(11)
τm Tmax
(12)
such that: wacc = Vt .
We also define weight w ¯acc as the ge value necessary to have a neuron spiking from its reset state after time Tcod . The same equation gives us: w ¯acc = Vt .
τm Tcod
(13)
We can now describe different neural networks implementing elementary operations such as : memories, synchronizer, linear combination or non-linearities such as multiplications, directly operating on inter spike intervals.
2.3
Storing data: memory
9
Figure 2: Inverting Memory: this network stores a value encoded in a pair of input spikes x (to the input neuron) by integrating current on the ge dynamics of neuron acc during the input interspike. The value, stored in the membrane potential of the acc neuron is read out when the recall neuron is triggered. Releasing a pair of spikes with neuron output corresponding to 1 − x. Blue, red and black neurons are, respectively, input, output and internal neurons. Inverting Memory
Fig. 2 presents an Inverting Memory network. This network is constituted
of two input neurons (in blue): input and recall, one output neuron (in red): output and 3 internal neurons (in black): first, last and acc. Details and proof of the inner working of the network can be found in Appendix A.1. The chronogram of spikes during operation of this network is presented in Fig. 3. When a pair of spikes arrives at the input neuron, they are sorted by the first and last neurons. Their synaptic connections are such that first will only spike in response to the first encoding spike of the pair (at time t1in ) and last will only spike in response to the second encoding spike of the pair (at time t2in ), thus seperating the two input spikes. first and last are then respectively starting and stopping the integration of the membrane potential of neuron acc at times t1st and t1end such that the value of acc’s membrane potential
10
Figure 3: Inverting Memory: chronogram of network operation for an input at times t1in and t2in and a recall at time t1recall . (Input spikes are drawn in blue, output spikes in red. Green plots show the membrane potential of interesting neurons.) after the second input spike is, with ∆Tin = t2in − t1in the input interspike: Vsto =
wacc .(∆Tin − Tmin ) τm
(14)
When the recall neuron is triggered, the integration starts again until reaching Vt such that we get an output interspike ∆Tout = t2out − t1out following: Vt =
wacc wacc .(∆Tin − Tmin ) + .∆Tout τm τm
(15)
Considering the definition of wacc , we have Vt .τm /wacc = Tmax , such that ∆Tout = Tmax − (∆Tin − Tmin )
(16)
We thus obtain an output spike corresponding to the maximum temporal representation of a 11
value (Tmax ) minus the actual coding time (∆Tin − Tmin ) of the input value. Chaining two of these Inverting Memory networks, can store and recall a value without modification. We can also notice that the value is stored in the inter spike timing needed to represent the value and can be recalled as soon as the value has been completely fed into the Inverting Memory network.
Figure 4: Memory: this network stores a value stored in the inter spike timing of two input spikes (to the input neuron) similarly to the Inverting Memory network. Two accumulators, acc and acc2 are used to output on the output neuron the same value as previously received on the input neuron. Blue, red and black neurons are, respectively, input, output and internal neurons.
Memory
Fig. 4 presents a Memory network. Detailed explanations and a chronogram of the
network’s operations can be found in Appendix A.2. This network is based on the Inverting Memory network introduced in the previous paragraph, 2 accumulator neurons acc and acc2 are added to invert the stored value twice. If we follow the same reasoning as in the previous paragraph, acc spikes Tmax after the first encoding spike is received and acc2 starts integrating when the second encoding spike is received. Because acc stops acc2’s integration process, the value stored in acc2’s membrane potential after acc spikes is, with ∆Tin the input interspike (we present here a simplifyed result to ease the notations, the full result is available in 12
Appendix A.2): Vsto =
wacc .(Tmax − ∆Tin ) τm
(17)
Note that the time at which acc2 ends its integration happens after the input value has been completely fed into the Memory network. This is the reason why we added the ready neuron which is triggered when the input value has been stored in the Memory network and is ready to be read out. We then have the output interspike ∆Tout following:
Vt =
wacc wacc .(Tmax − ∆Tin ) + .∆Tout τm τm
(18)
such that ∆Tout = ∆Tin
(19)
Figure 5: Signed Memory: this network is using a Memory network to store a signed value and its sign. Depending on the sign of the input (i.e. if it is received on the input + or input - neuron), the wrong output neuron (output + if the input is negative) is inhibited so that the output of the internal Memory network is directed to the output corresponding to the input sign. Blue, red and black neurons are, respectively, input, output and internal neurons.
13
Signed Memory
Fig. 5 presents a Signed Memory network. This network uses a Memory net-
work to store a value and a small state machine, implemented by neurons ready + and ready -, to store the sign of the input. Detailed equations and the chronogram of the network’s operations can be found in Appendix A.3. The internal Memory network is linked in parallel to the positive and negative pathways of the Signed Memory. When an input is fed into one of these two pathways, only the corresponding ready neuron receives some excitation. When the recall neuron is triggered, only the ready neuron corresponding to the sign of the input spikes (because of the excitation contributed by the stored input). The ready neuron will then inhibit the wrong output such that only the output neuron corresponding to the correct sign will fire.
Synchronizer Fig. 6 presents a Synchronizer network. This network receives N different inputs and synchronizes their first encoding spikes on the output end. Detailed equations and the chronogram of the network’s operations can be found in Appendix A.4. It is implemented using N Memory networks. The sync neuron keeps track of the number of received inputs. When all the N inputs have been received, this neuron spikes, starting the readout process of the different memories at the same time, thus synchronizing all the outputs. Furthermore, the same principle can be used with Signed Memory networks to obtain a Signed Synchronizer network.
2.4
Relational operations
Minimum Fig. 7 presents a Minimum network. This network implements the minimum operation on 2 inputs. It outputs the smallest of its 2 inputs as well as an indicator of which input was the smallest one. If the two inputs, input1 and input2, are synchronized and because our encoding function is increasing with its input value, the minimum of the 2 inputs is the one for which the second encoding spikes arrives first. This is what the smaller1 and smaller2 neurons
14
Figure 6: Synchronizer: this network is synchronizing a set of input values so that the first spikes encoding every value on its output side happen at the exact same time. It can be used to resynchronize values before networks requiring this condition. It uses a set of Memory networks to store the different input values and a sync neuron which recalls all these stored values as soon as the last one of them has been stored. Blue, red and black neurons are, respectively, input, output and internal neurons. are extracting. This information is also used to inhibit the excitatory contribution of the largest input to the output neuron in order to output only the smallest of the input values. Detailed proof and the chronogram of operations can be found in Appendix B.1.
Maximum Fig. 8 implements the maximum operation on 2 inputs. This networks follows the same principle as in the Minimum network, it differs by inverting the detection relation: when the first input is the smallest, it triggers larger2 because the second input must then be the largest. The drive of the output neuron is simpler in this case as the inputs are synchronized.
15
Figure 7: Minimum: this network outputs the smallest of its two inputs, which have to be synchronized, and an indicator signal on neuron smaller1 or smaller2 corresponding to which input has been considered as the smallest one. Because we chose an encoding function f which output increases with its input, the smallest input corresponds to the one for which the second encoding spike arrives first. This is what the output neuron is extracting. Blue, red and black neurons are, respectively, input, output and internal neurons. This network only contains V − synapses The maximum value corresponds to the one for which the second encoding spike is the latest. Detailed proof and the chronogram of operations can be found in Appendix B.2.
2.5
Linear operations
Subtractor Fig. 9 presents a Subtractor network. It is here presented in its simplest form. It will be expanded in a second stage. This network computes the difference between input1 and input2 and directs the output depending on its sign either to the output + or output - neuron. If the two inputs are synchronized, the difference between the two is directly given by the interspike between the two second encoding spikes. This is the information sync1 and sync2
16
Figure 8: Maximum: this network outputs the largest of its two inputs, which have to be synchronized, and an indicator signal on neuron larger1 or larger2 corresponding to which input has been considered as the largest one. Because we chose an encoding function f which output increases with its input, the largest input corresponds to the one for which the second encoding spike arrives last. This is what the output neuron is extracting. Blue, red and black neurons are, respectively, input, output and internal neurons. neurons are extracting. It also implements the same idea as in the Minimum network (see Fig. 7) to compute the sign of the output. When the output sign is known, sync1 or sync2 inhibits the pathway to the wrong output neuron such that the output spikes are directed to the correct one. The detailed proof and the chronogram of operations can be found in Appendix C.1. A more robust version of the Subtractor network is presented in Fig. 10. The networks adds the zero neuron and its connections (in magenta in the figure). In the previous ’simple’ implementation shown in Fig. 9, when both inputs are equals, the two parallel pathways of the network are triggered at the same time and the lateral inhibition has no time to select a winning pathway. In that case, the output is emitted both on output + and output - which can be problematic for the following networks expecting only one of the two pathways to be activated. 17
Figure 9: Subtractor (simple): this network substracts its two inputs, which have to be synchronized. The resulting value is directed to two different neurons, output + or output -, depending on its sign. Because the two inputs are synchronized, the difference is directly given by the interspike between the second spikes of both inputs. The sign is determined using the same idea as in the Minimum network (see Fig. 7). Blue, red and black neurons are, respectively, input, output and internal neurons. This network only contains V − synapses To solve this problem, we add the zero neuron with a set of fast synaptic connections. They allow to detect the case of equality between the two inputs. In this case, the output - pathway is quickly inhibited to produce spikes coding for the zero output only on the output + neuron.
Linear Combination
Fig. 11 presents a Linear Combination network. It computes the linear
combination of N signed inputs with arbitrary coefficients α0 , ...αN −1 : s=
N −1 X i=0
18
αi .xi ,
(20)
Figure 10: Subtractor (full): this nework implements the same operation as the one presented in Fig. 9. The simple version requires that the input are not equal so that the inhibition resulting from the sign determination has time to propagate. The added zero neuron and its connections (in magenta) detects this particular case and drives the network to output a zero on neuron output + if the two inputs are equal. Blue, red and black neurons are, respectively, input, output and internal neurons. This network only contains V − synapses where xi , i ∈ 0, ..., N − 1 are the different inputs of the network. It uses the same principle as in the Memory network to store values in an accumulator. To implement the coefficients of the sum, we multiply the synaptic weight of the accumulation current by the coefficient corresponding to the input. To handle the signs of the inputs and coefficients, we use 2 accumulators. The first one is storing intermediate results which are positives (i.e. when the sign of the input is the same as the one of its associated coefficient) while the second stores negative values (i.e. when the sign of the input is different from the one of its associated coefficient). When all the inputs have been fed into the network, the sync network is triggered, causing the readout process 19
Figure 11: Linear Combination: this network computes the linear combination of a set of inputs with given coefficients α0 , ..., αN −1 : s =
PN −1 i=0
αi .xi . The network is accumulating
positive and negative sub-operations (i.e. αi .xi ) in 2 distinct accumulators. Synaptic connections in the network are shown for α0 ≥ 0 and αN < 0. The two resulting values are then read out by the sync neuron when all inputs are known, synchronized and substracted from one another to obtain the full, signed, result s. An indicator neuron start is provided to notify when the result is ready. Blue, red and black neurons are, respectively, input, output and internal neurons. of these accumulators. Their content are inverted as for the Memory network and then synced before entering a Subtractor network. This last network computes the difference between the positive and negative contributions of the different inputs and produces a signed output. A start neuron is then triggered to spike to indicate that the computation has ended. This signal can be used to trigger further networks. All details and proofs can be found in Appendix C.2.
20
2.6
Non-linear operations
Figure 12: Log: this network computes the natural logarithm of its input by using the gf dynamics of neuron acc. The input value is first stored in the membrane potential of the acc neuron. When the second encoding spike arrives, a gf − synapse is used to obtain a delay function of the log of the current value of acc’s membrane potential. Blue, red and black neurons are, respectively, input, output and internal neurons.
Natural Logarithm
Fig. 12 presents a Log network capable of computing the natural log-
arithm of its input value by exploiting the dynamics of a gf − synapse. Detailed proof and the chronogram of operations can be found in Appendix D.1. When an input value is fed into the input neuron, this value is first stored in the membrane potential of acc by integrating with weight w ¯acc between the spike of first and last. Because the spike from first is delayed by an additional Tmin compared to the one from last, the value stored in acc’s membrane potential is, with ∆Tin = Tmin + ∆Tcod the input interspike: V =
w ¯acc ∆Tcod w ¯acc (∆Tin − Tmin ) = .∆Tcod = Vt . τm τm Tcod
(21)
When this integration process is stopped by last’s spike, a synaptic event is also triggered on a gf − synapse of acc with weight gmult (another synaptic event also enables the gf dynamics by activating the gate state). acc’s membrane potential thus follows the evolution given by solving 21
the differential system Eq. (1): V = Vt .
τf ∆Tcod + gmult (1 − e−t/τf ) Tcod τm
(22)
If we chose gmult such that: gmult = Vt .
τm τf
(23)
We obtain V = Vt .
∆Tcod + Vt .(1 − e−t/τf ) Tcod
(24)
Considering neuron acc will then spike at time ts where V = Vt , we get: Vt = Vt . ∆Tcod Tcod
∆Tcod + Vt .(1 − e−ts /τf ) Tcod
= e−ts /τf
(25) (26)
� ts = −τf . log
∆Tcod Tcod
� (27)
which is a positive value because ∆Tcod ≤ Tcod by definition. Adding the delays of the synaptic connections to the output neuron, we get an output interspike ∆Tout : � ∆Tout = Tmin + τf . log
Tcod ∆Tcod
� (28)
We thus obtain a network capable of generating an output proportional to the natural logarithm of its input.
Exponential Fig. 13 presents the Exp network that computes the exponential of its input value by exploiting the dynamics of a gf − synapse. The detailed proof and the chronogram of operations can be found in Appendix D.2. When an input value is fed into the input neuron, a synaptic event is triggered on a gf − synapse of the acc neuron with weight gmult as defined in Eq. 23 by neuron first. acc’s membrane potential thus follows the evolution given by solving the differential system Eq. 1 until last spikes: V = gmult
τf (1 − e−t/τf ) = Vt .(1 − e−t/τf ) τm 22
(29)
Figure 13: Exp: this network computes the exponential of its input by using the gf dynamics of neuron acc. A value function of the exponential of the input value is first stored in neuron acc’s membrane potential by gating a gf − synapse to acc on the second encoding spike of the input. acc’s membrane potential is then read out to obtain the result. Blue, red and black neurons are, respectively, input, output and internal neurons. This synaptic activity is then gated when neuron last is triggered and blocks acc’s membrane potential value to : V = Vt .(1 − e−∆Tcod /τf ),
(30)
with ∆Tin = Tmin + ∆Tcod the input interspike (Because of the additional delay of Tmin in first’s pathway in comparison to the one of last). The spiking of last also triggers a readout of acc’s membrane potential by initiating a ge synaptic event with weight w ¯acc such that acc spikes after time ts following: w ¯acc .ts τm ts = Vt .(1 − e−∆Tcod /τf ) + Vt . Tcod
Vt = Vt .(1 − e−∆Tcod /τf ) +
(31)
Vt
(32)
ts = Tcod .e−∆Tcod /τf
23
(33)
Adding the delays of the synaptic connections to the output neuron, we get an output interspike ∆Tout : ∆Tout = Tmin + Tcod .e−∆Tcod /τf
(34)
We thus obtain a network capable of generating an output proportional to the exponential of its input.
Going back to the Log network from the previous paragraph, its output was : log ∆Tcod
=
log ∆Tout
� − Tmin = τf . log
Tcod ∆Tcod
� (35)
If this output is fed into an Exp network, we obtain the output: log
exp ∆Tout = Tmin + Tcod .e−∆Tcod /τf
(36)
= Tmin + Tcod .elog(∆Tcod /Tcod )
(37)
= Tmin + ∆Tcod
(38)
The Exp network is thus capable of inverting the Log network. One can take advantage of that to implement several common non-linearities by applying simple operations in between the Log and Exp networks. For instance, summing two logarithms will allow multiplication, subtracting them will implement division, multiplying a logarithm by a constant will compute a power function, ...
Multiplier Fig. 14 presents a network we name Multiplier. The detailed proof and the chronogram of the network’s operations can be found in Appendix A.3. This network is based on the principles used in the Log and Exp networks. The product s of the 2 inputs x1 and x2 is obtained using the well known following equation:
s = x1 .x2 = exp(log x1 + log x2 ).
24
(39)
Figure 14: Multiplier: this network multiplies its two inputs. It computes the logs of its inputs through neurons acc log1 and acc log2, sum them up and gets the exp of this value through neurons acc exp to obtain the product : s = x1 .x2 = exp(log x1 + log x2 ). Blue, red and black neurons are, respectively, input, output and internal neurons. Neurons acc log1 and acc log2’s membrane potentials are first loaded with the two inputs (input1 and input2). When the 2 inputs have been received, an exponential circuit is triggered through acc exp. To obtain the product of the input, this circuit has to be stopped after a time corresponding to the sum of the natural logarithm of the 2 inputs. Because the absolute value of the natural logarithm can be larger than 1 for small inputs (i.e. it is larger than the maximum value representable by our encoding scheme), we cannot use a Linear Combination network to sum the logs. To overcome this problem, we sum these values by triggering the logarithm computation of the 2 inputs successively: the sync neuron, which is detecting the end of the second input, it activates at the same time the exponential circuit and the logarithm of the first input.
25
When the first input’s logarithm is output, it triggers the logarithm of the second input which, when computed, stops the exponential circuit. At that point in time, the acc exp neuron contains in its membrane the product of the 2 inputs. It is then read out to compute the actual output of the network.
Figure 15: Signed Multiplier: this network computes the result and the sign of the multiplication of its two inputs. A Multiplier network is used to compute the absolute value of the result. This value is then directed to the correct output (output + or output -) by a small truth-table implemented in neurons sign1, sign2, sign3 and sign4 which are determining the sign of the output from the signs of the two inputs. Blue, red and black neurons are, respectively, input, output and internal neurons.
26
Signed Multiplier Fig. 15 presents a Signed Multiplier network. It computes the product of two inputs independently of their sign. In parallel, a set of neurons: sign1, sign2, sign3 and sign4 are used as a truth table to determine the sign of the output from the sign of the inputs. When the output sign is known, the wrong output pathways (either output + or output -) is inhibited to direct the output of the Multiplier network to the right output neuron. The different sign neurons implement a truth table with the excitatory connections they receive from the input neurons. Input connections and weights are designed such that only one sign neurons spikes when an input is fed into the circuit. This “winning” neuron can then be associated to an output sign. Lateral inhibition between the sign neurons is present to suppress residual activations by the input of non-winning sign neurons (this allows all the sign neurons to go back to their reset state once the output sign is computed).
2.7
Differential equations
Integrator Fig. 16 presents a Integrator network that allows to reconstruct a signal from its derivative fed into its input. It is using a multiplier and an accumulation network with a Linear Combination network. The output of this accumulator network is looped into its first input with a unit gain. The input, composed of input + and input -, is fed into this accumulator with a gain dt corresponding to the chosen integration timestep. Each time an output is produced on output + and output -, the indicator neuron new input is triggered to notify that the integrator is ready to receive its next input. This system is thus driven by its input: every time an input is provided, the corresponding output is computed. Two auxiliary input neurons are also provided. The init neuron loads the integrator with its initial value. This allows the internal state of the integrator (through the Linear Combination network) to be set to an initialization value. The start neuron feeds a zero into the input of the integrator, thus computing its first output.
27
Figure 16: Integrator: this network integrates an input over time. The init and start neurons are used to initialize the inner state of the integrator. The network is then driven by its input. Everytime an input is received, it is integrated and added to the latest value of the output. When a new value is output, the new input neuron spikes, requesting for a new input. Blue, red and black neurons are, respectively, input, output and internal neurons. System design All the networks presented in this section can be assembled to achieve more complex computational tasks. Multiplier and Linear Combination networks can be associated to compute arbitrary functions on some state variables. Integrator networks can then be used to solve systems of differential equations. Examples of such network will be demonstrated in the next section.
3
Results
We implement in this section different computational tasks. We start by implementing linear differential equations with a first order and a second order system. In a second stage, we implement 28
a more complex set of non-linear differential equations from Edward Lorenz.
3.1
Linear differential equations
Figure 17: Neural network implementing a first order differential equation. It is composed of a Constant network providing the input, a Linear Combination network computing the derivative of X and an Integrator network computing X from dX/dt.
First order system We first implement a first order differential system. This system solves the following equation: τ.
dX + X(t) = X∞ dt
(40)
We implement this network as shown in Fig. 17 using 3 of the networks described in the previous section: • a Constant network is providing the input X∞ to the system, • a Linear Combination network is computing dX/dt, • an Integrator network is computing X from its derivative.
29
0.8
0.8
0.6
0.6
0.4
0.4
0.2
0.2
0.0
0.0
0.2 0
5
10
15
20
(a) Different values of τ
0.2 0
5
10
15
20
(b) Different values of X∞
Figure 18: Neural implementation of a first order filter. Blue curves show the input values to the filter, red curves show the output values of the filter for different parameters. (Horizontal axis is time, every circle correspond to an actual output encoded by spikes of the network.) The init and start neurons enable to initialize and start the integration process. init has to be triggered before the integration process can take place to load the initial value of the Integrator network. start has to be triggered to output the first value from the Integrator network. When an output is provided by the Integrator network, the Constant network is activated using the new input neuron of the Integrator. Hence feeding two values into the Linear Combination computing the new derivative of the output. This derivative is then integrated by the Integrator to obtain a new output. With the implementations presented in the previous section, this network requires 118 neurons. Results of its simulation with different set of parameters for τ and X∞ and for dt = 0.5 are presented Fig. 18.
Second order system
To add complexity, we now implement a second order differential sys-
tem. This system solves the following equation: 1 d2 X ξ dX . 2 + . + X(t) = X∞ 2 ω0 dt ω0 dt
30
(41)
Figure 19: Neural network implementing a second order differential equation. It is composed of a Constant network providing the input, a Linear Combination network computing the second derivative of X and two Integrator networks computing dX/dt and X from d2 X/dt2 . (Signs of the different signals have been omitted to increase readability.) 0.8
0.8
0.7
0.7
0.6
0.6
0.5
0.5
0.4
0.4
0.3
0.3
0.2
0.2
0.1
0.1
0.0 0
10
20
30
40
50
60
70
0.0 0
(a) Different values of ω0
5
10
15
20
25
30
35
(b) Different values of ξ
Figure 20: Neural implementation of a second order filter. Blue curves show the input values to the filter, red curves show the output values of the filter for different parameters. (Horizontal axis is time, every circle correspond to an actual output encoded by spikes of the network.) We implement this network as shown in Fig. 19 using 4 of the networks described in the previous section: • a Constant network is providing the input X∞ to the system,
31
• a Linear Combination network is computing
d2 X , dt2
• a first Integrator network is computing dX/dt from the second derivative of X, • a second Integrator network is computing X from its first derivative. With the implementations presented in the previous section, this network requires 187 neurons. Results of its simulation with different set of parameters for ξ and ω0 and for dt = 0.2 are presented Fig. 20.
3.2
Lorenz attractor
Figure 21: Neural network implementing Edward Lorenz’s non-linear differential equation system. (Signs of the different signals have been omitted to increase readability.)
We now implement the set of non-linear differential equation proposed by Lorenz (1963): dX dt dY dt dZ dt
= σ(Y (t) − X(t))
(42)
= ρX(t) − Y (t) − X(t).Z(t)
(43)
= X(t).Y (t) − βZ(t)
(44)
32
0.5
0.4
0.3
0.2
0.1
0.0
0.20
0.15
0.10
0.05
0.00
0.05
0.10
0.15
0.20
0.3
0.2
0.1
0.0
0.1
0.2
0.3
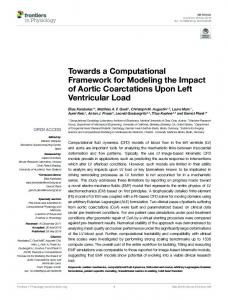
Figure 22: Neural implementation of a set of non-linear differential equations. These equations converge to the Lorenz attractor. The plot shows the evolution of the system in the phase space, every axis being one of the state variables X, Y , Z. Fixed points of the system are shown in blue, the origin point is shown in green. Every circle corresponds to an actual output encoded by spikes of the network. using σ = 10, β = 8/3 and ρ = 28 to ensure chaotic behavior of the system. We also use a variable substitution to obtain state variables X, Y and Z evolving in [0, 1] so that they can be represented by our framework. The initial state of the system is set to X = −0.15, Y = −0.20 and Z = 0.20. We use an integral step of dt = 0.01. We implement this network as shown Fig. 21 by using 9 of the networks described in the previous section: • 2 Signed Multiplier networks compute the non-linarities contained in Y and Z’s derivatives, • 3 Linear Combination networks compute the derivatives of X, Y and Z,
33
• a Signed Synchronizer network allows to wait for the three derivatives to be computed before evolving the system’s state, • 3 Integrator networks compute the new state from the derivatives of X, Y and Z. With the implementations presented in the previous section, this network requires 549 neurons. Results of its simulation are presented Fig. 22. We can observe that the system is behaving as expected, following the strange attractor described by Lorenz.
4
Discussion
In this work, we choose a linear encoding function to map values into inter spikes. In this case, it results in a direct trade-off between the time needed to represent a value and the time precision of the system. A finer time precision leads to a larger number of possible different values in a given maximum representation time. In the paper we chose to set time scales that are compatible with neuroscience evidence. However, current hardware allows much faster time scales up to nanoseconds. In that case not only can we obtain higher precision but also faster computation times.
The number of neurons used in the current implementation of the examples given in this paper can be reduced in size. They have been designed to ease comprehension and to be easy to plug into each other. In almost all the networks, the first and second encoding spikes for the output are generated by different neurons of the network. All the networks have a pair of first and last neurons which task is to separate the two incoming spikes. By directly routing these two spikes independently, the whole implementation would be much more efficient and would require much less neurons. Less neurons would also imply less spikes and therefore less energy requirements and less latency in signal propagation. 34
For feedforward architectures, the different layers of computation could also be pipelined. This means that if a task is composed of a series of operations which can be considered as layers, the full operation would require data to go through all the layers, with all layers being active only a fraction of the time. But at every point in time, one layer could also be computing its operation on a different input, such that all of the layers are always active. In the end, one can get one output per pipeline period, even if the whole computation takes several pipeline period to be completed (as many pipeline period as there are steps in the computation, the pipeline period being the longest time needed by one stage to output its result). This means better throughput for feedforward computation, but imposes a minimum delay on feedback (because the result to be fed back is not available before a certain number of pipeline periods).
The developed framework can be used to compute any algorithm, it is intersting to notice that it is naturally compatible with all type of time oriented AER (Address Event Representation (Boahen, 2000)) data and all kind of AER sensors (Delbruck et al. , 2010). The use of interspike makes the framework particularly adapted to process luminance time encoded events data from the neuromorphic camera ATIS (”Asynchronous Time-based Image Sensor”) (Posch et al. , 2011, 2008). Thus every event-based machine vision algorithm developed so far could be systematically implemented on neural boards.
A question outside the scope of this paper relates to the architecture of the platform that should implement this computation paradigm. Several solutions could be possible. A pure analog chip could be used. Analog design is known to be a difficult endeavour, moreover we would need to robustify the framework to overcome mismatch. Several options are possible, the most straightforward is to use regularization techniques such as the one introduced in (Benosman 35
et al. , 2014) or simply using calibration techniques to provide a precisely timed output from analog chip similar to what has been introduced in (Sheik et al. , 2012, 2011). A mixed-signal integrated circuit mixing both analog circuits and digital circuits could also be considered. Exponential decays could be generated using analog circuits while the remaining operations could use digital circuits. Finally the last solution could be a pure digital architecture preserving the principles introduced in the paper such as inter spike encoding, local computations that allow to overcome the Von Neumann bottelneck. In this case, we could use local binary computation units to perform conventional computation rather than using membrane potentials, synapses, delay,. . . . Everything being local to the units, the architecture would still be efficient. This by far is the less elegant solution, but it could be a rapid and an intermediate step toward a full true neuromorphic implementation.
Conclusion This work introduced a new clockless framework to build a multipurpose neuromorphic computer. Instead of representing values as a set of bits in a register or a part of some central memory, values are coded in the precise timing between events happening in the system. This dataflow framework we called STICK (Spike Time Interval Computational Kernel) offers a new method to design computing platforms where memory and computation are intertwined. By removing the numerous accesses to a central memory, inherent to standard computers, we free ourselves from the Von Neumann bottleneck. The systems scales naturally, the more neurons are available the more computation can be performed. Building a large machine consisting of several small elementary computational units allows to build natively massively parallel machines which rely on neuromorphic engineering principles to reduce their power consumption: energy is needed to produce events which only happens when information is produced.
36
Moreover, the STICK framework offers a way to design large neural networks that accomplish complex tasks by design of their architecture instead of only exploiting the randomness of a given connectivity topology. It also defines all the weights necessary to obtain a functional solution without the need for a costly (in terms of energy, time or computational power) learning process. A hardware fabric consisting of a large number of the proposed computational units with dynamic connection could then be used and adapted to successively solve different tasks.
Acknowledgments This work was performed in the frame of the LABEX LIFESENSES [ANR-10-LABX-65] and was supported by French state funds managed by the ANR within the Investissements d’Avenir programme [ANR-11-IDEX-0004-02]. XL has been supported by the European Union Seventh Framework Programme (FP7/2007-2013) under grant agreement n◦ 604102 (HBP).
Appendix This appendix presents the detailed proofs of all the networks described in Section 2
A A.1
Storing data: analog memories Inverting Memory
The Inverting Memory network (see Fig. 2) receives 2 spikes on the input neuron at times t1in and t2in such that ∆Tin = t2in − t1in encodes its input value. When input spikes at t1in , synaptic connections are activated towards neurons first and last. Because of the synaptic delays and weights, last’s membrane potential is set to Vt /2 and first spikes at time t1first = t1in + Tsyn + Tneu , Tneu being the time needed by first to produce a spike. When first spikes, an inhibitory
37
Figure 23: Inverting Memory: chronogram of the network for an input at times t1in and t2in and a recall at time t1recall . (Input spikes are drawn in blue, output spikes in red. Green plots show the membrane potential of interesting neurons, recall of Fig. 3) connection to itself sets its potential to −Vt while a second connection triggers the integration of neuron acc after a delay Tsyn + Tmin with weight wacc . We then have: t1st = t1first + Tsyn + Tmin = t1in + 2.Tsyn + Tneu + Tmin .
(45) (46)
When input spikes for the second time at time t2in , first’s membrane potential gets back to its reset value while last reaches its threshold. This produces a spike from neuron last at time t1last = t2in + Tsyn + Tneu . The connection to acc with delay Tsyn and weight −wacc stops acc’s
38
integration at time: t1end = t1last + Tsyn
(47)
= t2in + 2.Tsyn + Tneu .
(48)
During this integration window we had, for neuron acc, ge = wacc such that, the membrane potential of acc at time t1end is: Vsto = = =
wacc 1 .(tend − t1st ) τm wacc 2 .(tin − (t1in + Tmin )) τm wacc .(∆Tin − Tmin ) τm
(49) (50) (51)
When the recall neuron receives an input at time t1recall , acc’s integration starts again at time t2st = t1recall + Tsyn . At the same time, its second connection triggers a spike of the output neuron at time: t1out = t1recall + (2.Tsyn + Tneu ) + Tneu
(52)
= t1recall + 2.Tsyn + 2.Tneu
(53)
The integration stops again when acc reaches its threshold at time t2end , giving the following equation: Vt =
wacc 2 .(tend − t2st ) + Vsto τm
t2end = (t1recall + Tsyn ) − (∆Tin − Tmin ) + Vt .
(54) τm , wacc
(55)
By definition of wacc , we have Vt .τm /wacc = Tmax , so : t2end = t1recall + Tsyn + Tmax − (∆Tin − Tmin ),
(56)
Because acc1 then needs the time Tneu to produce a spike, we get: t1acc = t2end + Tneu 39
(57)
We thus get the second spike of output at time: t2out = t1acc1 + Tsyn + Tneu
(58)
t2out = t1recall + 2.Tsyn + 2.Tneu + Tmax − (∆Tin − Tmin )
(59)
such that: ∆Tout = t2out − t1out = Tmax − (∆Tin − Tmin ).
A.2
(60) (61)
Memory
The Memory network (see Fig. 4) receives 2 spikes on the input neuron at times t1in and t2in such that ∆Tin = t2in − t1in encodes its input value. With the reasoning used in the previous subsection, we get: t1first = t1in + Tsyn + Tneu
(62)
t1last = t2in + Tsyn + Tneu .
(63)
When first spikes, it triggers integration in acc’s membrane potential. Because of the synaptic delay, we get: t1st = t1first + Tsyn = t1in + 2.Tsyn + Tneu
(64)
Neuron acc continues to integrate its wacc input until reaching its threshold. This gives us the following equation: Vt =
wacc 1 .(tend − t1st ) τm
40
(65)
Figure 24: Memory: chronogram of the network for an input at times t1in and t2in and a recall at time t1recall . (Input spikes are drawn in blue, output spikes in red. Green plots show the membrane potential of interesting neuron.) by definition of wacc , we thus get: t1end = t1st + Tmax = t1in + Tmax + 2.Tsyn + Tneu t1acc = t1end + Tneu = t1in + Tmax + 2.Tsyn + 2.Tneu t1end2 = t1acc + Tsyn = t1in + Tmax + 3.Tsyn + 2.Tneu 41
(66) (67) (68) (69) (70) (71)
At the same time, integration starts in acc2’s membrane potential after last spikes, which corresponds to: t1st2 = t1last + Tsyn = t2in + 2.Tsyn + Tneu
(72)
The membrane potential of acc2 after the end of the first integration phase is thus: Vsto = = =
wacc 1 .(tend2 − t1st2 ) τm wacc .(Tmax + t1in − t2in + Tsyn + Tneu ) τm wacc .(Tmax − ∆Tin + Tsyn + Tneu ) τm
(73) (74) (75)
When the recall neuron is triggered, it starts acc2’s integration again at time: t2st2 = t1recall + Tsyn
(76)
Which then produces the first output spike at time: t1out = t1recall + Tsyn + Tneu .
(77)
This second integration phase of acc2 finishes when its threshold is reached: Vt =
wacc 2 .(tend2 − t2st2 ) + Vsto τm
Tmax = tend2 − t1recall − Tsyn + Tmax − ∆Tin + Tsyn + Tneu t2end = t1recall + ∆Tin − Tneu
(78) (79) (80)
We thus get a spike from acc2 at time: t1acc2 = t2end2 + Tneu = t1recall + ∆Tin
(81)
leading to the second output spike at time: t2out = tacc2 + Tsyn + Tneu = t1recall + ∆Tin + Tsyn + Tneu
(82)
∆Tout = t2out − t1out
(83)
such that:
= ∆Tin 42
(84)
A.3
Signed Memory
Figure 25: Signed Memory: chronogram of the network for an input at times t1in and t2in and a recall at time t1recall . (Input spikes are drawn in blue, output spikes in red. Green plots show the membrane potential of interesting neurons). (a) Depicts the case of a positive input whereas (b) depicts the case of a negative input. The Signed Memory network (see Fig. 5) receives 2 spikes on the input neuron at times t1in and t2in such that ∆Tin = t2in − t1in encodes its input value and the receiving neuron encodes the sign of the input (input + for positive inputs, input - for negative inputs). Let’s consider, without loss of generality, the case where the input is positive (Fig. 25(a)). For each of the 2 input spikes, the ready + neuron receives a synaptic contribution of 0.25we . When the input has been completely fed into the network, ready +’s membrane potential is thus resting at a value of Vt /2 while ready -’s is still resting at its reset potential. At the same time, the input spikes 43
are fed into the central Memory network (see previous subsection) independently of its sign. When the value is stored in the Memory network, it outputs a spike on its Rdy output, which is propagated to the ready neuron. When the recall neuron is triggered, its connections contribute to ready + and ready -’s membrane potentials with a weight of 0.5we . This leads to a spike of the ready + neuron at time t1sign while ready -’s membrane potential moves to Vt /2. The lateral inhibition between the 2 ready neurons then sets ready - back to its reset potential. When ready + spikes, it triggers the recall of the Memory network and at the same time inhibits the output neuron corresponding to a negative value, output -, setting its potential to −2.Vt . When the Memory network outputs its stored value, spikes are transmitted to both output. Because of their respective potential at this moment, only the positive output output + spikes, while output -’s membrane potential is set back to its reset potential by the 2 output spikes of the Memory network. Fig. 25(b) shows the same principle applied to a negative input. One can notice that the ready + and ready - neurons are implementing a small state machine routing the spikes produced by the central Memory network to different output neurons depending on the input neurons.
A.4
Synchronizer
The Synchronizer network (see Fig. 6) for N inputs uses N Memory networks. Fig. 26 presents the chronogram of this network for N = 2. Every time an internal memory has finished storing an input, its Rdy output activates the sync neuron with a weight we /N. Thus, after i inputs have i been presented, sync’s membrane potential Vsync is:
i Vsync =
i .Vt . N
(85)
The sync neuron thus spikes after the N th and last memory is ready. It then recalls the values stored in all Memory networks at the same time, effectively synchronizing the first encoding
44
Figure 26: Synchronizer: chronogram of the network for inputs at times t1in0 , t2in0 and t1in1 , t2in1 . (Input spikes are drawn in blue, output spikes in red. Green plots show the membrane potential of interesting neuron.) spikes of all its outputs.
B B.1
Relational operations Minimum
The Minimum network (see Fig. 7) receives 2 different inputs (a pair of spikes) from each input neurons input1 (t1in1 and t2in1 ) and input2 (t1in2 and t2in2 ) such that ∆Tin1 = t2in1 − t1in1 and ∆Tin2 = t2in2 − t1in2 encode its 2 inputs. Let us consider, without loss of generality, the case where the first input (input1) is smaller than the second one as shown in Fig. 27. Assuming the
45
Figure 27: Minimum: chronogram of the network for inputs at times t1in1 , t2in1 and t1in2 , t2in2 . (Input spikes are drawn in blue, output spikes in red. Green plots show the membrane potential of interesting neuron.) inputs to be synchronized, we have: t1in1 = t1in2 ,
(86)
When input1 and input2 are triggered by the first encoding spike of each input, smaller1 and smaller2’s membrane potentials are set to Vt /2 and the output neuron spikes after a delay due to the connection from input1 and input2 such that: tout1 = t1in1 + 2.Tsyn + 2.Tneu .
(87)
When the smallest input (in this case input1) receives its second encoding spike at time t2in1 , the smaller1 neuron reaches its threshold and emits a spike at time: t1smaller1 = t2in1 + Tsyn + Tneu .
(88)
The spike from smaller1 inhibits the other input (here input2) such that it will not be triggered by its second encoding spike (as can be seen in the chronogram). It also inhibits the smaller2 46
neuron such that its membrane potential goes back to its reset potential. The second encoding spike from input1 and the spike from smaller1 are, in addition, enough contribution to trigger a second spike in the output neuron at time: � t2out = min t2in1 + 2.Tsyn + Tneu , tsmaller1 + Tsyn + Tneu
(89)
� = min t2in1 + 2.Tsyn + Tneu , t2in1 + 2.Tsyn + Tneu + Tneu
(90)
= t2in1 + 2.Tsyn + 2.Tneu .
(91)
We thus get an output pair of spikes spaced in time such that: ∆Tout = t2out − t1out = t2in1 − t1in1 = ∆Tin1 .
(92)
The output is thus corresponding to the smallest of the 2 inputs of the network while the indicator provides which of the two inputs is the smallest (smaller1). The same reasonning can be applied to the case where the second input (input2) is the smallest.
B.2
Maximum
The Maximum network (see Fig. 8) receives 2 different inputs (a pair of spikes) from each input neurons input1 (t1in1 and t2in1 ) and input2 (t1in2 and t2in2 ) such that ∆Tin1 = t2in1 − t1in1 and ∆Tin2 = t2in2 − t1in2 encode its 2 inputs. Let’s consider, without loss of generality, the case where the second input (input2) is larger than the first one as depicted Fig. 28. The 2 inputs being synchronized as a prerequisite of the network, we have: t1in1 = t1in2 ,
(93)
When input1 and input2 are triggered by the first encoding spike of each input, larger1 and larger2’s membrane potentials are set to Vt /2 and the output neuron spikes after a delay due to the connection from input1 and input2 such that: tout1 = t1in2 + Tsyn + Tneu . 47
(94)
Figure 28: Maximum: chronogram of the network for inputs at times t1in1 , t2in1 and t1in2 , t2in2 . (Input spikes are drawn in blue, output spikes in red. Green plots show the membrane potential of interesting neuron.) When the smallest input (in this case input1) receives its second encoding spike at time t2in1 , we know that the other input has to be the larger one. Hence, the larger2 neuron reaches its threshold and emits a spike at time: t1larger2 = t2in1 + Tsyn + Tneu .
(95)
The spike from larger2 inhibits the larger1 neuron such that its membrane potential goes down to −Vt /2, while the connection input1 to output raises output’s membrane potential to Vt /2. When the second encoding spike from input2 is received, the connection from input2 to larger1 moves back larger1’s membrane potential to its reset potential while its connection to output triggers a spike at time: t2out = t2in2 + Tsyn + Tneu .
48
(96)
We thus get an output pair of spikes spaced in time such that: ∆Tout = t2out − t1out = t2in2 − t1in2 = ∆Tin2 .
(97)
The output is thus corresponding to the largest of the 2 inputs of the network.while the indicator provides which of the two inputs is the largest (larger1). The same reasonning can be applied to the case where the first input (input1) is the largest.
C C.1
Linear operations Subtractor
Figure 29: Subtractor: chronogram of the network for inputs at times t1in1 , t2in1 and t1in2 , t2in2 . (Input spikes are drawn in blue, output spikes in red. Green plots show the membrane potential of interesting neuron.)
49
The Subtractor network (see Fig. 9) receives 2 different inputs (a pair of spikes) from each input neurons input1 (t1in1 and t2in1 ) and input2 (t1in2 and t2in2 ) such that ∆Tin1 = t2in1 − t1in1 and ∆Tin2 = t2in2 − t1in2 encode its 2 inputs. Let us consider, without loss of generality, the case where the first input (input1) is larger than the second one as depicted Fig. 29. Assuming the inputs to be synchronized, we have: t1in1 = t1in2 .
(98)
When input1 and input2 are triggered by the first encoding spikes of each input, they activate the sync1 and sync2 neurons such that their membrane potentials are now set to Vt /2. When the second encoding spike of the smallest input (here, input2) is received, the activation from input2 to sync2 is sufficient to trigger a spike at time: t1sync2 = t2in2 + Tsyn + Tneu .
(99)
This spike inhibits the inb1 neuron after a time Tsyn , moving its membrane potential to −Vt and, because the sign of the output is now known, it triggers and output spikes on output + at time: 1 2 t1out = Tsync2 + 3.Tsyn + 2.Tneu + Tneu = Tin2 + 4.Tsyn + 4.Tneu .
(100)
It also contributes to output -’s membrane potential with an activation of we at time t1sync2 + Tmin +3.Tsyn +2.Tneu . But before this contribution reaches output -, the inb2 neuron is triggered and produces a spike at time: t1inb2 = tsync + Tsyn + Tneu
(101)
which inhibits output - with weight 2wi at time t1inb2 + Tsyn = t1sync2 + Tsyn + Tneu . This inhibition thus happens before the direct excitation from sync2, which then leads to output - not emitting a spike and its membrane potential to be set to −Vt after receiving these 2 spikes. When the second encoding spike of the largest input is received, the spike from input1
50
triggers a spike from sync1 at time: t1sync1 = t2in1 + Tsyn + Tneu .
(102)
This spike leads to the inhibition of inb2 to a membrane potential of −Vt and an excitation of inb1 back to its reset potential. It also activates output + back to its reset potential and triggers an output spike at time: t2out = tsync1 + Tmin + 3.Tsyn + 2.Tneu + Tneu = t2in1 + Tmin + 4.Tsyn + 4.Tneu
(103)
We thus get a positive output as expected and an output value: ∆Tout = t2out − t1out
(104)
= Tmin + t2in1 − t2in2
(105)
= Tmin + (t2in1 − t1in1 ) − (t2in2 − t1in2 )
(106)
= Tmin + (∆Tin1 − ∆Tin2 )
(107)
= Tmin + (∆Tin1 − Tmin ) − (∆Tin2 − Tmin ).
(108)
Knowing that for each value x, we encode it as a time interval f (x) = Tmin + x.Tcod , we have: ∆Tout = Tmin + xin1 .Tcod − xin2 .Tcod = Tmin + (xin1 − xin2 ).Tcod
(109) (110)
which corresponds to the encoding of the result input1 − input2.
C.2
Linear Combination
The first part of the Linear Combination presented Fig. 11 can be decomposed in a series of simpler circuits to what has been presented before for the inverting memory. For each of the N inputs, one branch is managing positive inputs while the other one is managing negative inputs (only one of these 2 can be activated in any computation). The architecture of each 51
of these branches can be seen as an inverting memory (see Fig. 2) storing a value either in acc1+ or acc1-. The targeted accumulator is chosen depending on the sign of the input and the sign of its associated coefficient αi to represent the sign of the input’s contribution to the result. acc1+ is accumulating all positive contributions (positive inputs with positive coefficients and negative inputs with negative inputs) and acc1- is accumulating all negative contributions (negative inputs with positive coefficients and positive inputs with negative coefficients). With the same reasoning leading to Eq. (51) we can get the contribution of an input i to its associated i is the input interspike associated to the considered input: accumulator, if ∆Tin
i Vsto = |αi |.
wacc i .(∆Tin − Tmin ), τm
(111)
The integration in the accumulators being linear, we obtain the membrane potential stored in the 2 accumulators after all inputs have been fed into the network: acc1+ Vsto =
X
i Vsto
(112)
i∈I +
=
X
|αi |.
i∈I + acc1− Vsto =
X
wacc i .(∆Tin − Tmin ) τm
i Vsto
(113) (114)
i∈I −
=
X
|αi |.
i∈I −
wacc i .(∆Tin − Tmin ) τm
(115)
where I + is the set of inputs contributing positively to the output and I − is the set of inputs contributing negatively to the output. When the N inputs have been fed into the network, the sync neuron finally receives enough excitation to produce a spike at time t1sync . This spike triggers the readout process of acc1+ and acc1- and, at the same time, starts integrating in neurons acc2+ and acc2-. This process is similar to the one used in the Memory network (see Appendix A.2). If we consider the positive accumulator, we obtain spikes from acc1+ and acc2+ at time t1acc1+ and t1acc2+ respectively with the following conditions, where t1st = t1sync + Tsyn is the time at
52
which the integration begins: Vt =
wacc τm .(tacc1+
acc1+ − t1st ) + Vsto
wacc τm .(tacc2+
Vt =
−
(116)
t1st )
By definition of wacc , we thus get: tacc2+ = t1st + Tmax
(117)
and X
Tmax = tacc1+ − t1st +
i |αi |.(∆Tin − Tmin )
(118)
i∈I +
tacc1+ = t1st + Tmax −
X
i |αi |.(∆Tin − Tmin )
(119)
i∈I + + Neuron inter+ is thus producing 2 spikes with an interspike ∆Tinter such that:
+ ∆Tinter = tacc2+ + Tmin + Tsyn + Tneu − (tacc1+ + Tsyn + Tneu )
X
=
i |αi |.(∆Tin − Tmin ) + Tmin
(120) (121)
i∈I +
The same reasoning on acc1- and acc2- leads to a pair of spikes on neuron inter- with an inter− spike ∆Tinter : − ∆Tinter =
X
i |αi |.(∆Tin − Tmin ) + Tmin
(122)
i∈I −
This two values are then synchronized by a Synchronizer network described previously and subtracted from one another such that the output is, according to Eq. (107): + − ∆Tout = ∆Tinter − ∆Tinter + Tmin
=
X
i |αi |.(∆Tin − Tmin ) −
=
X
i |αi |.(∆Tin − Tmin ) + Tmin
(124)
i∈I −
i∈I + N −1 X
(123)
i �i .αi .(∆Tin − Tmin ) + Tmin
(125)
i=0
where �i is +1 if input i is positive and −1 otherwise. This is the expected result of the linear combination. 53
D
Non-linear operations
D.1
Natural Logarithm
Figure 30: Log: chronogram of the network for an input at times t1in and t2in . (Input spikes are drawn in blue, output spikes in red. Green plots show the membrane potential of interesting neurons). The Log network (see Fig. 12) receives 2 spikes on the input neuron at times t1in and t2in such that ∆Tin = t2in − t1in encodes its input value. The same reasoning leads us to obtain the spike times of the first and last neurons at: t1first = t1in + Tsyn + Tneu
(126)
t1last = t2in + Tsyn + Tneu
(127)
The acc neuron is thus integrating from time: t1st = t1first + Tsyn + Tmin = t1in + 2.Tsyn + Tmin + Tneu 54
(128) (129)
to time: t1end = t1last + Tsyn = t2in + 2.Tsyn + Tneu
(130) (131)
The membrane potential of neuron acc at the end of this integration phase is thus: w ¯acc 1 (t − t1st ) τm end w ¯acc 2 (t − t1in − Tmin ) τm in w ¯acc (∆Tin − Tmin ) τm
Vsto = = =
(132) (133) (134)
If we name ∆Tcod = ∆Tin − Tmin and considering the definition of w ¯acc , we have: Vsto = Vt .
∆Tcod . Tcod
(135)
The other synaptic connections from last to acc also activate the gf dynamics of the acc neuron at time t1end . When the gf − synapse gets activated, acc’s membrane potential follows the following evolution obtained by solving the differential system Eq. (1): V = Vsto + gmult
τf 1 (1 − e−(t−tend )/τf ) τm
(136)
for t ≥ t1end . According to Eq. (23), we chose gmult = Vt . ττmf so that: V = Vt .
∆Tcod 1 + Vt .(1 − e−(t−tend )/τf ) Tcod
(137)
The acc neuron will then spike at time t1acc when the condition V = Vt is met. This gives us: Vt = Vt . ∆Tcod Tcod t1acc
∆Tcod 1 1 + Vt .(1 − e−(tacc −tend )/τf ) Tcod 1
1
= e−(tacc −tend )/τf � � ∆Tcod = −τf . log + t1end Tcod
(138) (139) (140)
The first output spike is generated by the connection from last to output, thus: t1out = t1last + Tneu + 2.Tsyn 55
(141)
While the second output spike is generated by the connection from acc to output, thus: t2out = t1acc + Tneu + Tsyn + Tmin � � ∆Tcod = −τf . log + t1end + Tneu + Tsyn + Tmin Tcod � � ∆Tcod = −τf . log + t1last + Tneu + 2.Tsyn + Tmin Tcod
(142) (143) (144)
This gives us the output ∆Tout : ∆Tout = t2out − t1out � � ∆Tcod + Tmin = −τf . log Tcod � � Tcod = Tmin + τf . log ∆Tcod
D.2
(145) (146) (147)
Exponential
Figure 31: Exp: chronogram of the network for an input at times t1in and t2in . (Input spikes are drawn in blue, output spikes in red. Green plots show the membrane potential of interesting neurons).
56
The Exp network (see Fig. 13) receives 2 spikes on the input neuron at times t1in and t2in such that ∆Tin = t2in − t1in encodes its input value. The same reasoning leads us to obtain the spike times of the first and last neurons at: t1first = t1in + Tsyn + Tneu
(148)
t1last = t2in + Tsyn + Tneu
(149)
The first neuron then triggers the gf dynamics of neuron acc at time: t1st = t1first + Tsyn + Tmin = t1in + Tneu + 2.Tsyn + Tmin
(150)
Solving the differential system Eq. (1), acc’s membrane potential is following the evolution: V
= gmult
τf 1 (1 − e−(t−tst )/τf ) τm 1
= Vt .(1 − e−(t−tst )/τf )
(151) (152)
This evolution is stopped at t1end by the connection from last to acc through its action on the gate signal: t1end = t1last + Tsyn = t2in + Tneu + 2.Tsyn
(153)
At the end of this phase, acc’s membrane potential is thus equal to: 1
1
Vsto = Vt .(1 − e−(tend −tst )/τf ) 2
1
(154)
= Vt .(1 − e−(tin −tin −Tmin )/τf )
(155)
= Vt .(1 − e−(∆Tin −Tmin )/τf )
(156)
= Vt .(1 − e−∆Tcod /τf )
(157)
with ∆Tcod = ∆Tin − Tmin . At the same time, last is starting a second integration process of a ge − synapse. acc’s membrane potential is then following the evolution: V = Vsto +
w ¯acc .(t − t1end ) τm 57
(158)
This behavior leads to a spike at time t1acc when the condition V = Vt is met: w ¯acc 1 .(tacc − t1end ) τm Vt = Vt .(1 − e−∆Tcod /τf ) + .(t1 − t1end ) Tcod acc
Vt = Vsto +
(159)
Vt
(160)
t1acc = t1end + Tcod .e−∆Tcod /τf .
(161)
The first output spike is produced by the connection from last to output, thus: t1out = t1last + Tneu + 2.Tsyn
(162)
The second output spike is produced by the connection from acc1 to output, thus: t2out = t1acc + Tneu + Tsyn + Tmin
(163)
= Tcod .e−∆Tcod /τf + t1end + Tneu + Tsyn + Tmin
(164)
= Tcod .e−∆Tcod /τf + t1last + Tneu + 2.Tsyn + Tmin
(165)
This gives us the output ∆Tout : ∆Tout = t2out − t1out
(166)
= Tcod .e−∆Tcod /τf + Tmin
D.3
(167)
Multiplier
The Multiplier network (see Fig. 14) receives 2 different inputs (a pair of spikes) from each input neurons input1 (t1in1 and t2in1 ) and input2 (t1in2 and t2in2 ) such that ∆Tin1 = t2in1 − t1in1 and ∆Tin2 = t2in2 −t1in2 encode its 2 inputs. The first layers of the network, composed of the neurons input, first, last and acc log for each inputs are similar to the Logarithm network. Considering the results from Appendix D.1, when the 2 inputs have been fed into the network, we get 2 potentials stored in acc log1 and acc log2 (respectively Vsto1 and Vsto2 ): V = V . ∆Tcod1 sto1
t
Tcod
Vsto2 = Vt . ∆Tcod2 Tcod 58
(168)
Figure 32: Multiplier: chronogram of the network for inputs at times t1in1 , t2in1 and t1in2 , t2in2 . (Input spikes are drawn in blue, output spikes in red. Green plots show the membrane potential of interesting neurons). When the 2 inputs have been fed into the network, spikes from last1 and last2 activate the sync neuron which spikes at time t1sync . This triggers the readout of the log of input1 in the acc log1
59
neuron at time: t1st1 = t1sync1 + Tsyn .
(169)
Results from Appendix D.1 tell us that this neuron will thus spike at time: t1log1
� = −τf . log
∆Tcod1 Tcod
�
+ t1st .
(170)
A spike from the acc log1 neuron will then trigger the readout of the log value of input2 in the acc log2 neuron at time: t1st2 = t1log1 + Tsyn .
(171)
acc log2 will then produce a spike at time: t1log2
� = −τf . log
∆Tcod2 Tcod
�
+ t2st .
(172)
Which will trigger the first output spike at time: t1out = t1log2 + 2.Tsyn .
(173)
At the same time, the sync neuron also started the gf dynamics of neuron acc exp at time: t1st3 = t1sync + 3.Tsyn .
(174)
This process is stopped by the spike from neuron acc log2 at time: t1end3 = t1log2 + Tsyn
(175)
Results from Appendix D.2 tell us that the potential stored in acc exp at that time is thus: 1
1
Vsto3 = Vt .(1 − e−(tend3 −tst3 )/τf )
(176)
and that the integration process started by the second connection from acc log2 to acc exp (acting on ge ) will result in a spike at time: 1
1
t1exp = t1end3 + Tcod .e−(tend3 −tst3 )/τf . 60
(177)
This will result in the second output spike at time: t2out = t1exp + Tsyn + Tmin .
(178)
The output of the network is thus the interspike ∆Tout such that: ∆Tout = t2out − t1out
(179)
= Tmin + t1exp − t1log2 − Tsyn 1
1
1
1
= Tmin + Tcod .e−(tend3 −tst3 )/τf + t1end3 − Tsyn = Tmin + Tcod .e−(tend3 −tst3 )/τf
(180) (181) (182)
From previous equations, we get: t1end3 − t1st3 = tlog2 − t1sync − 2.Tsyn � � ∆Tcod2 = −τf . log + t2st − t1sync − 2.Tsyn Tcod � � ∆Tcod2 = −τf . log + t1log1 − t1sync − Tsyn Tcod � � � � ∆Tcod2 ∆Tcod1 = −τf . log − τf . log Tcod Tcod � � ∆Tcod1 .∆Tcod2 = −τf . log . Tcod
(183) (184) (185) (186) (187)
Which then gives us: ∆Tout = Tmin + ∆Tcod1 .∆Tcod2
(188)
which corresponds to the encoded value of the produce of the value encoded by the 2 inputs.
References Backus, John. 1978. Can programming be liberated from the von Neumann style?: a functional style and its algebra of programs. Communications of the ACM, 21(8), 613–641.
61
Benjamin, Ben Varkey, Gao, Peiran, McQuinn, Emmett, Choudhary, Swadesh, Chandrasekaran, Anand, Bussat, Jean-Marie, Alvarez-Icaza, Rodrigo, Arthur, John V., Merolla, Paul, & Boahen, Kwabena. 2014. Neurogrid: A Mixed-Analog-Digital Multichip System for Large-Scale Neural Simulations. Proceedings of the IEEE, 699–716. Benosman, Ryad, Clercq, Charles, Lagorce, Xavier, Ieng, Sio-Hoi, & Bartolozzi, Chiara. 2014. Event-Based Visual Flow. IEEE Trans. Neural Netw. Learning Syst., 25(2), 407–417. Berry, M.J., Warland, D. K., & Meister., M. 1997. The structure and precision of retinal spike trains. Proceedings of the National Academy of Sciences of the United States of America, 94, 5411–5416. Blanche, T.J., Koepsell, K., Swindale, N., & Olshausen, B. A. 2008. Predicting response variability in the primary visual cortex. Boahen, K.A. 2000. Point-to-point connectivity between neuromorphic chips using address events. Circuits and Systems II: Analog and Digital Signal Processing, IEEE Transactions on, 47(5), 416–434. Buracas, G.T., Zador, A.M., DeWeese, M.R., & Albright, T.D. 1998. Efficient discrimination of temporal patterns by motion-sensitive neurons in primate visual cortex. Pages 959–69 of: Neuron, vol. 20. Chang, E. Y., Morris, K. F., Shannon, R., & Lindsey, B. G. 2000. Repeated sequences of interspike intervals in baroresponsive respiratory related neuronal assemblies of the cat brain stem. vol. 84. Delbruck, T., Linares-Barranco, B., Culurciello, E., & Posch, C. 2010. Activity-driven, eventbased vision sensors. Pages 2426–2429 of: Circuits and Systems (ISCAS), Proceedings of 2010 IEEE International Symposium on. 62
Eliasmith, Chris, Stewart, Terrence C., Choo, Xuan, Bekolay, Trevor, DeWolf, Travis, Tang, Yichuan, & Rasmussen, Daniel. 2012. A large-scale model of the functioning brain. Science, 338, 1202–1205. Furber, Steve, Galluppi, Francesco, Temple, Steve, & Plana, Luis A. 2014. The SpiNNaker Project. Proceedings of the IEEE, 102(5), 652–665. Huang, Guang-Bin, & Chen, Lei. 2008. Enhanced Random Search Based Incremental Extreme Learning Machine. Neurocomput., 71(16-18), 3460–3468. Indiveri, G. 2001. A Current-mode Hysteretic Winner-take-all Network, with Excitatory and Inhibitory Coupling. Analog Integrated Circuits and Signal Processing, 28(3), 279–291. Lindsey, B.G., Morris, K.F., Shannon, R., & Gerstein., G.L. 1997. Repeated patterns of distributed synchrony in neuronal assemblies. vol. 78. Litvak, V., Sompolinsky, H., Segev, I., & Abeles, M. 2003. On the transmission of rate code in long feed-forward networks with excitatory-inhibitory balance. vol. 23. Lorenz, Edward N. 1963. Deterministic nonperiodic flow. Journal of the atmospheric sciences, 20(2), 130–141. Mainen, Z. F., & Sejnowski, T. J. 1995. Reliability of spike timing in neocortical neurons. vol. 268. Markram, Henry, Wang, Yun, & Tsodyks, Misha. 1998. Differential signaling via the same axon of neocortical pyramidal neurons. Proceedings of the National Academy of Sciences of the United States of America, 95(9), 5323–5328. Mazer, J.A., Vinje, W.E., McDermott, J., Schiller, P.H., & Gallant, J.L. 2002. Spatial frequency and orientation tuning dynamics in area v1. vol. 99. 63
Mazurek, M.E., & Shadlen, M.N. 2002. Limits to the temporal fidelity of cortical spike rate signals. vol. 5. Merolla, P.A., Arthur, J.V., Alvarez-Icaza, R., Cassidy, A.S., Sawada, J., Akopyan, F., Jackson, B.L., Imam, N., Guo, C., Nakamura, Y., Brezzo, B., Vo, I., Esser, S.K., Appuswamy, R., Taba, B., Amir, A., Flickner, M.D., Risk, W.P., Manohar, R., & Modha, D.S. 2014. A million spiking-neuron integrated circuit with a scalable communication network and interface. Science, August, 668–673. Posch, C., Matolin, D., & Wohlgenannt, R. 2008. An asynchronous time-based image sensor. Pages 2130–2133 of: Circuits and Systems, 2008. ISCAS 2008. IEEE International Symposium on. Posch, Christoph, Matolin, Daniel, & Wohlgenannt, Rainer. 2011. A QVGA 143 dB Dynamic Range Frame-Free PWM Image Sensor With Lossless Pixel-Level Video Compression and Time-Domain CDS. IEEE Journal of Solid-State Circuits, 46(February), 259–275. Prut, Y., Vaadia, E., Bergman, H., Haalman, I., Slovin, H, & Abeles, M. 1998. Spatiotemporal structure of cortical activity: Properties and behavioral relevance. vol. 79. Rahimi, Ali, & Recht, Benjamin. 2009. Weighted Sums of Random Kitchen Sinks: Replacing minimization with randomization in learning. Pages 1313–1320 of: Koller, D., Schuurmans, D., Bengio, Y., & Bottou, L. (eds), Advances in Neural Information Processing Systems 21. Curran Associates, Inc. Reinagel, P., & Reid, R. 2000. Temporal coding of visual information in the thalamus. Pages 5392–5400. of: J. Neuroscience, vol. 20. Reyes, A., Lujan, R., Rozov, A., Burnashev, N., Somogyi, P., & Sakmann, B. 1998. Target-cell-
64
specific facilitation and depression in neocortical circuits. Pages 279–85 of: Nat Neurosci, vol. 1. Saxe, Andrew, Koh, Pang Wei, Chen, Zhenghao, Bhand, Maneesh, Suresh, Bipin, & Ng, Andrew. 2011. On Random Weights and Unsupervised Feature Learning. Pages 1089–1096 of: Getoor, Lise, & Scheffer, Tobias (eds), Proceedings of the 28th International Conference on Machine Learning (ICML-11). ICML ’11. New York, NY, USA: ACM. Schemmel, J., Fieres, J., & Meier, K. 2008 (june). Wafer-scale integration of analog neural networks. Pages 431 –438 of: Neural Networks, 2008. IJCNN 2008. (IEEE World Congress on Computational Intelligence). IEEE International Joint Conference on. Sejnowski, Terrence J. 1995. Time for a new neural code? Nature, 376(6535), 21–22. Shadlen, M. N., & Newsome, W.T. 1998. The variable discharge of cortical neurons: Implications for connectivity, computation and information coding. vol. 18. Sheik, S., Stefanini, F., Neftci, E., Chicca, E., & Indiveri, G. 2011 (May). Systematic configuration and automatic tuning of neuromorphic systems. Pages 873–876 of: International Symposium on Circuits and Systems, (ISCAS), 2011. IEEE. Sheik, S., Chicca, E., & Indiveri, G. 2012. Exploiting Device Mismatch in Neuromorphic VLSI Systems to Implement Axonal Delays. Pages 1940–1945 of: International Joint Conference on Neural Networks, IJCNN 2012. IEEE. Sutter, H. 2005. The free lunch is over: A fundamental turn toward concurrency in software. vol. 30. Swadlow, H. A. 1985. Physiological properties of individual cerebral axons studied in vivo for as long as one year. vol. 54.
65
Swadlow, H. A. 1988. Efferent neurons and suspected interneurons in binocular visual cortex of the awake rabbit: Receptive fields and binocular properties. vol. 88. Swadlow, H. A. 1992. Monitoring the excitability of neocortical efferent neurons to direct activation by extracellular current pulses. vol. 68. Swadlow, H. A. 1994. Efferent neurons and suspected interneurons in motor cortex of the awake rabbit: Axonal properties, sensory receptive fields, and subthreshold synaptic inputs. vol. 71. Tapson, Jonathan, & van Schaik, Andr´e. 2012. Learning the Pseudoinverse Solution to Network Weights. CoRR, abs/1207.3368. Tapson, Jonathan C, Cohen, Greg Kevin, Afshar, Saeed, Stiefel, Klaus M, Buskila, Yossi, Hamilton, Tara Julia, & van Schaik, Andr. 2013. Synthesis of neural networks for spatiotemporal spike pattern recognition and processing. Frontiers in Neuroscience, 7(153). Tetko, I. V., & Villa, A. E. P. 2001. A pattern grouping algorithm for analysis of spatiotemporal patterns in neuronal spike trains. vol. 105. Thomson, A.M., Deuchars, J., & West, D.C. 1993. Single axon excitatory postsynaptic potentials in neocortical interneurons exhibit pronounced paired pulse facilitation. Pages 347–360 of: Neuroscience, vol. 54. Villa, A. E.and Tetko, V., I., Hyland, B., & Najem, A. 1999. Spatiotemporal activity patterns of rat cortical neurons predict responses in a conditioned task. vol. 96. Zamarreo-Ramos, Carlos, Linares-Barranco, Alejandro, Serrano-Gotarredona, Teresa, & Linares-Barranco, Bernab. 2013. Multicasting Mesh AER: A Scalable Assembly Approach for Reconfigurable Neuromorphic Structured AER Systems. Application to ConvNets. IEEE Trans. Biomed. Circuits and Systems, 7(1), 82–102.
66