Friedmann, 1984; Denton & McCormack, 1985; Brand. & Murphy ... chondrial extracts (McCormack, 1985b). ..... Mr. Mark Leach, Miss Gina Allgood andMrs.
217
Biochem. J. (1987) 245, 217-222 (Printed in Great Britain)
Stimulation of the respiration rate of rat liver mitochondria by sub-micromolar concentrations of extramitochondrial Ca2+ John D. JOHNSTON and Martin D. BRAND Department of Biochemistry, University of Cambridge, Tennis Court Road, Cambridge CB2 IQW, U.K.
1. The respiration rate of rat liver mitochondria was stimulated by up to 70% when the extramitochondrial Ca2+ concentration was raised from 103 to 820 nm. This occurred when pyruvate, 2-oxoglutarate, or threo-(Dr)-isocitrate was employed as substrate, but not when succinate was used. 2. Ruthenium Red prevented the stimulation of mitochondrial respiration by extramitochondrial Ca2 , showing that the effect required Ca2+ uptake into the mitochondrial matrix. 3. Starvation of rats for 48 h abolished the stimulation of mitochondrial respiration by extramitochondrial Ca2+ when pyruvate was used as substrate, but did not affect the stimulation of 2-oxoglutarate oxidation by extramitochondrial Ca2+. 4. Our findings are in accord with proposals that oxidative metabolism in liver mitochondria may be stimulated by Ca2+ activation of intramitochondrial dehydrogenases.
INTRODUCTION The action of glucagon, angiotensin II, vasopressin and a-adrenergic agonists on liver cells gives rise to an increased rate of respiration (reviewed by: KrausFriedmann, 1984; Denton & McCormack, 1985; Brand & Murphy, 1987). This increase is not a result of increased supply of ADP, since the ATP/ADP ratio of the mitochondrial matrix does not fall; rather it remains unchanged, or even increases (Siess et al., 1977; Bryla et al., 1977). These hormones also give rise to an increase in cytoplasmic Ca2+ concentration, from a basal value of 100 nm up to 600 nM (Murphy et al., 1980; Charest et al., 1983). Denton & McCormack (1985) and Hansford (1985) have proposed that an increase in cytoplasmic Ca2+ within this range results in an increase in mitochondrial-matrix Ca2+ concentration, which acts to stimulate respiration independently of the supply of ADP, thereby allowing the phosphorylation potential of the mitochondrial matrix to remain constant, or even to increase (see also Brand & Murphy, 1987). The stimulation of mitochondrial respiration by Ca2+ is proposed to act via three matrix enzymes, i.e. 2-oxoglutarate dehydrogenase, NAD-linked isocitrate dehydrogenase and pyruvate dehydrogenase phosphate phosphatase (Hansford, 1985). Ca2+ decreases both the Km value of NAD-linked isocitrate dehydrogenase for threo-(D.)-isocitrate and the Km value of 2-oxoglutarate dehydrogenase for 2-oxoglutarate (Denton & McCormack, 1980). Pyruvate dehydrogenase exists in both an active dephosphorylated form and an inactive phosphorylated form (Randle, 1986). Ca2+ stimulates pyruvate dehydrogenase phosphate phosphatase, which generates an increase in the active form of pyruvate dehydrogenase, and so increases the Vmax. of the complex (Hansford, 1985). The amount of active pyruvate dehydrogenase is decreased in starvation by the action of pyruvate dehydrogenase kinase, which itself is activated in starvation by pyruvate dehydrogenase kinase activator protein (Denyer et al., 1986). Starvation also attenuates a rise in pyruvate dehydrogenase activity in Abbreviations used: NTA, nitrilotriacetic acid;
Vol. 245
response to hormones such as glucagon and vasopressin (Randle, 1986). Stimulation by extramitochondrial Ca2+ of the actlvity of these matrix enzymes and of the respiration rate has been observed in intact coupled mitochondria isolated from heart (Denton et al., 1980), brown adipose tissue (McCormack & Denton, 1980) and white adipose tissue (Marshall et al., 1984). The sensitivity to Ca2+ of the three matrix enzymes from liver is retained in mitochondrial extracts (McCormack, 1985b). Attempts to demonstrate that micromolar [Ca2+]. can stimulate respiration of isolated liver mitochondria have, however, been unsuccessful (Hansford, 1985). McCormack (1985a,b) and Assimacopoulos-Jeannet et al. (1986) have used a Percoll-gradient procedure when isolating liver mitochondria to produce a preparation with low Ca2+ content, and demonstrated that the Ca2+-sensitive intramitochondrial enzymes could be stimulated by an increase in [Ca2+]0, but experienced difficulty in demonstrating an increase in respiration. To maintain the hypothesis that the increase in the respiration rate of liver cells after hormone treatment is caused by raised cytoplasmic and matrix Ca2+ concentration leading to activation of the Ca2+-sensitive enzymes, it is necessary to show stimulation of respiration of isolated liver mitochondria in response to appropriate [Ca2+]O. Using a simple technique which we have previously reported to produce a mitochondrial preparation with low Ca2+ content (Johnston & Brand, 1986), we ask the question: can an increase in [Ca2+]. within the physiological range stimulate mitochondrial
respiration? EXPERIMENTAL Female Wistar rats were fed on Diet 41B, obtained from Oxoid, Basingstoke, Hants., U.K. Animals were starved overnight (16 h) unless otherwise stated, and killed between 08: 30 and 09:00 h. Liver mitochondria were prepared by the method of Chappell & Hansford
[Ca2+]0, extramitochondrial free calcium concentration.
218
(1972) in 250 mM-sucrose/ 10 mM-Hepes/ 1 mM-EGTA, adjusted to pH 7.4 with KOH, at 4 'C. The following alterations were made to the protocol (Johnston & Brand, 1986): four centrifugations instead of three were performed at 12 100 g for 10 min (rmax. = 10.8 cm); the third and fourth centrifugations were carried out in 250 mM-sucrose/S mM-Hepes/1O mM-NTA, adjusted to pH 7.25 with KOH, at 4 'C; between the third and fourth centrifugations mitochondria were incubated on ice in this medium at approx. 10 mg of protein/ml for 25 min. Mitochondrial preparations contained 1.26+0.11 nmol of Ca2+/mg of protein (fed animals), 1.41 +0.11 nmol of Ca2+/mg (16 h-starved animals) and 1.31 + 0.14 nmol of Ca2+/mg (48 h-starved animals). Mitochondria prepared without the incubation procedure contained 3.75+0.31 nmol of Ca2+/mg of protein. Results are means+S.E.M. for six preparations. Using a similar technique, Joseph et al. (1983) obtained similar results. Respiratory control ratios (State 3/State 4) of mitochondria were 6.47+0.60 with 10 mmglutamate/5 mM-malate, and 4.02+0.19 with 10 mmsuccinate in the presence of 3 /SM-rotenone. Results are means+S.E.M. for three preparations. Mitochondrial protein was determined by a modified biuret method (Gornall et al., 1949), with bovine serum albumin as standard. Mitochondrial total Ca2+ content was measured with a Perkin-Elmer 380AA atomic-absorption spectrophotometer after mitochondrial Ca2+ had been extracted with 5% (w/v) trichloroacetic acid/1.5% (w/v) LaCl3 (final concns.), and the denatured protein removed by centrifugation. Mitochondrial respiration was measured with a Clark-type oxygen electrode. The basic incubation medium contained 70 mM-KCl, 80 mM-sucrose, 10 mM-NTA, 10 mM-Hepes, 5 mM-KH2PO4, 5 mMMgCl2 ([free Mg2+] = 0.34 mM), 5 mM-Na2ADP, at 37 'C, adjusted to pH 7.25 with KOH. The basic incubation medium also contained 365 nmol of 0/ml as calibrated by the method of Robinson & Cooper (1970), and 6 gM total endogenous Ca2+ determined by atomicabsorption spectrophotometry. CaCl2 was added from 10 mm stock solution to give the [free Ca2+] required. Mitochondria were incubated at 1 mg of mitochondrial protein/ml in a final volume of 3 ml. Endogenous rates of respiration ranged from 6 to 12 nmol of 0/min per mg of protein. This varied from incubation to incubation, and was not noticeably affected by [Ca2+]O. Substrate was added after 5 min incubation. Rates of 02 consumption were measured for 5 min and were linear during this time. Apparent stability constants at pH 7.25 for Ca-NTA (9.51 x 10³ M-1), Ca-EGTA (8.48 x 10⁶ M-1), Mg-NTA (1.69 x 10³ M-1) and Mg-ADP (7.93 x 10² M-1) were calculated from the absolute stability constants (Martell & Smith, 1977) as described by Fabiato & Fabiato (1979). Other complexes, e.g. Ca-ADP, did not contribute significantly to buffering. Free Ca2+ and Mg2+ concentrations were calculated reiteratively by using the algorithm of Fabiato & Fabiato (1979) on a BBC microcomputer. Incubation media contained 6 ,UM-, 16/sM-, 26 SM-, 38 /M- and 51 /sM-Ca2+, giving calculated free Ca2+ concentrations of 103 nm, 252 nm, 410 nm, 594 nm and 820 nm respectively. To generate 0.75 nm free Ca2+ 1 mm-EGTA was added to the basic incubation medium. Endogenous Ca2+ was
J. D. Johnston and M. D. Brand
always measured and taken into account when calculating free Ca2+ concentrations. Standard CaCI2, pyruvic acid, Hepes, NTA and MgCl2 were obtained from BDH, Dagenham, Essex, U.K. Na2ADP was obtained from Boehringer Mannheim, Mannheim, West Germany. Succinic acid, sucrose, KCI, KOH and KH2PO4 were obtained from Fisons, Loughborough, Leics., U.K. EGTA, threo-(Dj)-isocitrate (potassium salt), rotenone and Ruthenium Red were obtained from Sigma Chemical Co., Poole, Dorset, U.K. Ruthenium Red was purified by the method of Luft (1971). 2-Oxoglutaric acid was obtained from KochLight, Colnbrook, Bucks., U.K. Statistical significance was assessed by two-tailed Student's t test on matched pairs.
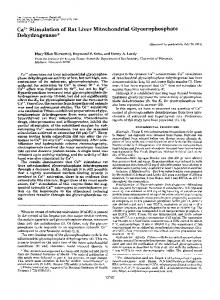
RESULTS Figs. l(a), 2(a) and 3(a) demonstrate the dependence of respiration rate on the concentration of 2-oxoglutarate, pyruvate and succinate respectively at [Ca2+]. ranging from -0.75 to 820 nm. Fig. 1(a) shows that [Ca2+]o has little effect on the mitochondrial respiration rate at 0.1 mM-2-oxoglutarate. At higher concentrations of '2-oxoglutarate, there is a distinct stimulation by [Ca2+]O, most pronounced between 0.7 mm- and 2.0 mM-2-oxoglutarate, indicating that the respiration rate is dependent not only on the concentration of 2-oxoglutarate, but also on [Ca2+]0. Above 2.0 rM-2-oxoglutarate there is a tendency for the lines to converge. The respiration rate reaches a maximum of 80 nmol of 0/min per mg of protein. Fig. 2(a) shows that at 0.1 mM-pyruvate [Ca2+]o has little effect on pyruvate oxidation. At higher concentrations of pyruvate there is again a distinct stimulation by [Ca2+]0, which becomes more pronounced as pyruvate concentration increases, indicating that pyruvate oxidation depends not only on the concentration of pyruvate but also on [Ca2+]O. The respiration rate reaches a maximum of 37.5 nmol of 0/min per mg of protein. Fig. 3(a) shows that succinate oxidation gives the largest rate of respiration, 180 nmol of 0/min per mg of protein above 1.5 mM-succinate. There is no discernible effect of varying the [Ca2+]O. Data from Figs. l(a), 2(a) and 3(a) are replotted in Figs. l(b), 2(b) and 3(b) respectively to demonstrate the effects of [Ca2+]o on the mitochondrial respiration rate. Fig. l(b) demonstrates an increase in respiration rate when [Ca2+]o is increased from 103 to 820 nm in the presence of 2-oxoglutarate. There is little or no change in the respiration rate when [Ca2+]o is altered from 0.75 to 103 nm. There is a tendency for respiration to reach a plateau or even decrease when [Ca2+]o is greater than 594 nm, but this does not always happen (see Fig. 5). Fig. 2(b) demonstrates an increase in the rate of respiration in the presence of pyruvate when [Ca2+]J is increased from 103 to 820 nm. As with oxidation of 2-oxoglutarate, there is little difference between respiration rates at 0.75 nm- and 103 nM-Ca2+. The respiration rate tends to a plateau at [Ca2+]o higher than 594 nM. Fig. 3(b) demonstrates that increasing [Ca2+]o from 0.75 to 820 nm has no effect on succinate oxidation. Succinate dehydrogenase is not known to be stimulated by Ca2+ (Hatefii 1985), suggesting that the effects of [Ca2+]. in Figs. 1 and 2 are not general, but are specific 1987
Stimulation of mitochendrial respiration by Ca2+
219 40 r
80 r
(a)
(a) 60 F 30 h
A
I
40 F .-
20 F
cl 40
E
._
20 I-
+
0
0 cm
E 0.
0.f0 cm
E
C
10 ±
E
0.5
1.0
1.5
2.0
3.5
5.0
[2-Oxaglutarate] (mM)
Co
60
C
o 80 E
1.0
0 .°
E
0
r-
0.5
0
0
40F
._E
CS
2.0 1.5 [Pyruvate] (mM)
IF
3.5
5.0
(b)
Q 0 CR
.a
~0
CD
30 F
40
F
20
10
1140.75
400 600 800 [Ca21]0 (nM) Fig. 1. Effect of jCa2+1j on respiration rate of mitochondria at different concentrations of 2-oxoglutarate Mitochondria were incubated as described in the Experimental section. Results are means+ S.E.M. [shown only in (b) for clarity] from three different preparations. In (a) respiration is plotted as a function of 2-oxoglutarate concentration, with the following [Ca2+]0 present: 0, 0.75 nM; *, 103 nM; El, 252 nM; E, 410 nM; V, 594 nM; V, 820 nm. Data from (a) are replotted in (b) to demonstrate respiration as a function of [Ca2+]J at the following 2-oxoglutarate concentrations: 0, 0.3 mM; , 0.5 mM; El, 0.7 mM; *, 1.0 mM; V, 2.0 mM; V, 3.5 mM. 0.751
200
200
400
600
800
[Ca2+] (nM)
Fig. 2. Effect of ICa2+1. on respiration rate of mitochondria at different concentrations of pyruvate Mitochondria were incubated as described in the Experimental section. Results are means + S.E.M. [shown only in (b) for clarity] from three different preparations. In (a) respiration is plotted as a function of pyruvate concentration, with the following [Ca2+]o present: 0, 0.75 nM; *, 103 nM; EO, 252 nM; *, 410 nM; V, 594 nM; V, 820 nm. Data from (a) are replotted in (b) to demonstrate respiration as a function of [Ca2+]. at the following pyruvate concentrations: 0, 0.3 mM; 0, 0.5 mM; El, 0.7 mM; *, 1.0 mM; V, 2.0 mM; V, 5.0 mm. Statistical significance was assessed as in Fig. 1.
Statistical significance assessed against respiration rate at
0.75 nm [Ca2+]0 is shown only in (b): *P < 0.05, **P < 0.01.
effects at the level of the dehydrogenases. We have also performed experiments with 0.1-5.0 mM-malate and 0.5-20 mM-D-f6-hydroxybutyrate as substrate and found no stimulation of respiration up to 812 nM-Ca2+ (results not shown). Fig. 4 shows respiration rate as a function of [Ca2+]. with 0.5 mM-threo-D8-isocitrate as substrate. Again, there Vol. 245
is little difference in respiration rates at 0.75 nM-Ca2+ and 103 nM-Ca2+, respiration increases over the range 103-594 nM-Ca2+, and reaches a plateau at higher [Ca2+]0. Fig. 4 also demonstrates that the increase in respiration associated with increasing [Ca2+]. can be prevented by including Ruthenium Red, a potent inhibitor of mitochondrial Ca2+ uptake (Nicholls & Akerman, 1982), in the incubation medium. This shows that the stimulation of respiration depends on entry of Ca2+ into the mitochondrial matrix. Similar sensitivity to
J. D. Johnston and M. D. Brand
220 190
(a)
c 80 0
160
I.-
0
cm
E
X 60
130
E 0
100
0
E
-40
._
0)
2a 70
m C
0
0
E
.B.
0
E 0 o 190
Z
.r -
0.75
5.0
2.0 1.5 [Succinate] (mM)
0.5
1.0
200
600
400
[Ca2+].
800
(nM)
Fig. 4. Effect of ICa2+1I on respiration rate of mitochondria respiring on 0.5 mM-threo-(D)-isocitrate Mitochondria were incubated as described in the Experimental section in the absence (0) or the presence (0) of 1sM-Ruthenium Red. Results are means + S.E.M. for three different preparations. Statistical significance was assessed as in Fig. 1.
(b)
.E5
X 160 C
0
.CA0)
LH
cc:
-
L.
C
130
60
100
E L T
0.
70
0, 5 0) 0
AT
'A.
0.
T
I05 200
.Ec 400
600
800
[Ca21]0 (nM) Fig. 3. Effect of ICa22+1 on respiration rate of mitochondria at different concentrations of succinate Mitochondria were incubated as described in the Experimental section with 3 /LM-rotenone. Results are means+ S.E.M. [shown only in (b) for clarity] from three different preparations. In (a) respiration is plotted as a function of succinate concentration, with the following [Ca2+]J present: 0, 0.75 nM; *, 103 nM; O, 252 nM; *, 410 nM; V, 594 nM; V, 820 nm. Data from (a) are replotted in (b) to demonstrate respiration as a function of [Ca2+1J at the following succinate concentrations: 0, 0.1 mM; 0, 0.3 mM; El, 0.5 mM; *, 1.5 mM; V, 3.0 mM. Statistical significance was assessed as in Fig. 1.
Ruthenium Red is shown with 2-oxoglutarate (Fig. 5) and pyruvate (Fig. 6). Fig. 5 demonstrates that 48 h starvation of animals before killing them has no effect on mitochondrial respiration rate with 1 mM-2-oxoglutarate as substrate. The activity of 2-oxoglutarate dehydrogenase in heart is not known to be affected by starvation (McCormack et al., 1982). The rate of respiration with pyruvate, on the other hand, depends on the extent of starvation of the animal
0
-
E40
._
0I 30
0.75
200
400
600
800
[Ca2+],
Fig. 5.
(nM) Effect of dietary status of rats on the respiration mitochondria respiring on 1 mM-2-oxoglutarate
rate of
Mitochondria obtained from fed (0), overnight-starved (@) or 48 h-starved (El) rats were incubated as described in the Experimental section. Mitochondria obtained from overnight-starved rats were also incubated as described in the Experimental section in the presence of 1 ,UMRuthenium Red (U). Results are means+S.E.M. for three different preparations. Statistical significance was assessed as in Fig. 1.
(Fig. 6). Increasing [Ca2+]. from 103 to 820 nm increased the respiration rate of mitochondria from both fed animals and animals starved overnight for 16 h. Although there is no difference in the rates of respiration 1987
Stimulation of mitochondrial respiration by Ca 2+ 30 0 0.
E
25
0.
0 0
.5 E 20 CL
0
15~I
800 400 600 [Ca2+] (nM) Fig. 6. Effect of dietary status of rats on the respiration rate of mitochondria respiring on 1 nM-pyruvate
0.75
200
Mitochondria obtained from fed (O), overnight-starved
(v) or 48 h-starved ([l) rats were incubated as described
in the Experimental section. Mitochondria obtained from overnight-starved rats were also incubated as described in the Experimental section in the presence of 1 ,UMRuthenium Red (U). Results are means+S.E.M. for three different preparations. Statistical significance was assessed as in Fig. 1.
between fed and starved animals at 0.75 nM-[Ca2+]0, mitochondria obtained from animals starved for 48 h failed to show Ca2+-sensitivity of pyruvate oxidation when [Ca2+]. was raised from 103 to 820nm. These results are consistent with a relative increase in the activity of pyruvate dehydrogenase kinase compared with pyruvate dehydrogenase phosphate phosphatase in starvation, masking any stimulation by [Ca2+]. (Randle, 1986).
DISCUSSION The aim of this work was to investigate the effect of an increase in [Ca2+]. within the physiological range on the respiration of coupled liver mitochondria. All experiments were carried out in the presence of physiological extramitochondrial concentrations of Mg2+ and Na+, which inhibit Ca2+ uptake by and promote Ca2+ egress from mitochondria respectively (Nicholls & Akerman, 1982). When [Ca2+]. was increased from 103 to 820 nm, the rate of respiration of mitochondria isolated from animals starved overnight was stimulated by up to 30% with pyruvate, 60% with 2-oxoglutarate, and 70% with threo-(Dj)-isocitrate, but there was no stimulation of the respiratory rate when succinate was the substrate. These results are consistent with an increase in [Ca2+]. causing a rise in intramitochondrial [Ca2+], which in turn activates 2-oxoglutarate dehydrogenase, NAD-linked isocitrate dehydrogenase and pyruvate dehydrogenase phosphate phosphatase. An increase in [Ca2+]. from 0.75 to 103 nm has no Vol. 245
221
effect on the rate of respiration when 2-oxoglutarate, pyruvate, threo-(D,)-isocitrate or succinate is employed as substrate. There is therefore a threshold above which [Ca2+]. must first rise before stimulation of the Ca2+-sensitive intramitochondrial enzymes (and of the respiratory rate) occurs. When [Ca2+]o was increased above 594nM, mitochondrial respiration rate tended to a plateau. This presumably represents an optimum value of [Ca2+10 above which an increase fails to stimulate the respiratory rate, rather than Ca2+-induced damage to the mitochondria, since succinate oxidation rates remained constant. Starvation of rats for 48 h before death resulted in the loss of Ca2+-sensitivity of pyruvate oxidation, yet the sensitivity of 2-oxoglutarate oxidation was maintained, implying that the distribution of Ca2+ across the mitochondrial inner membrane was unaffected by starvation. These results are consistent with an increase in the activity of pyruvate dehydrogenase kinase relative to pyruvate dehydrogenase phosphate phosphatase in starvation, thereby preventing stimulation of pyruvate dehydrogenase by increasing [Ca2+]o (Randle, 1986). Hansford (1985) reported that the respiration rate of isolated liver mitochondria was unaffected by [Ca2+]0. There may be several factors contributing to the difficulties experienced by others in demonstrating an increase in respiration rate in response to [Ca2+]O. We have used mitochondria prepared in such a way that their endogenous Ca2+ content is approx. 1 nmol/mg of protein, similar to that found in vivo (Somlyo et al., 1985). Higher Ca2+ contents may mask the effect, as suggested by Hansford (1985). We have worked at 37 °C instead of 25 °C or 30 °C, and indeed have been unable to show any effect of sub-micromolar Ca2+ concentrations at lower temperatures (J. D. Johnston & M. D. Brand, unpublished work). We have reported respiration rates between 0.1 mm and 5.0 mm substrate. Had we taken the ratio of respiration rates at 0.125 mM and 5.0 mm substrate as reported by Hansford (1985) and Marshall et al. (1984), stimulation of respiration by Ca2+ would not have been so apparent, e.g. Fig. 1(a). We have also relied on endogenous malate instead of added malate. Each of these factors may be important. Our results differ from those of Moreno-Sanchez (1985), who found that oxidation of glutamate/malate, 2-oxoglutarate and succinate and ATP synthesis were sensitive to [Ca2+]O. His results, however, were obtained with a mitochondrial preparation with a high endogenous Ca2+ content (> 20 nmol/mg of protein), making interpretation difficult. We conclude that the respiration rate of isolated liver mitochondria in the presence of pyruvate, 2-oxoglutarate or threo-(Ds)-isocitrate may be stimulated by [Ca2+]. in the physiological range. This is consistent with the proposal that hormonal stimulation of 02 consumption in liver is caused by elevated cytoplasmic and matrix [Ca2+], leading to stimulation of 2-oxoglutarate dehydrogenase, NAD-linked isocitrate dehydrogenase and pyruvate dehydrogenase (Denton & McCormack, 1985). J. D. J. is indebted to Foulkes Foundation Fellowship, London, Wolfson College, Cambridge, and EAJ, Dunfermline, for financial assistance. We thank Mr. Duane Lakin-Thomas, Mr. Mark Leach, Miss Gina Allgood and Mrs. Mary George for technical assistance.
222
REFERENCES Assimacopoulos-Jeannet, F., McCormack, J. G. & Jeanrenaud, B. (1986) J. Biol. Chem. 261, 8799-8804 Brand, M. D. & Murphy, M. P. (1987) Biol. Rev. Cambridge Philos. Soc., in the press Bryla, J., Harris, E. J. & Plumb, J. A. (1977) FEBS Lett. 80, 443-448 Chappell, J. B. & Hansford, R. G. (1972) in Subcellular Components: Preparation and Fractionation (Birnie, G. D., ed.), 2nd edn., pp. 79-81, Butterworths, London Charest, R., Blackmore, P. F., Berthon, B. & Exton, J. H. (1983) J. Biol. Chem. 258, 8769-8773 Denton, R. M. & McCormack, J. G. (1980) FEBS Lett. 119, 1-8 Denton, R. M. & McCormack, J. G. (1985) Am. J. Physiol. 249, E543-E554 Denton, R. M., McCormack, J. G. & Edgell, N. J. (1980) Biochem. J. 190, 107-117 Denyer, G. S., Kerbey, A. L. & Randle, P. J. (1986) Biochem. J. 239, 347-354 Fabiato, A. & Fabiato, F. (1979) J. Physiol. (Paris) 75, 463505 Gornall, A. G., Bardawill, C. J. & Davis, M. M. (1949) J. Biol. Chem. 177, 751-766 Hansford, R. G. (1985) Rev. Physiol. Biochem. Pharmacol. 102, 1-72 Hatefi, Y. (1985) Annu. Rev. Biochem. 54, 1015-1070
J. D. Johnston and M. D. Brand Johnston, J. D. & Brand, M. D. (1986) Biochem. Soc. Trans. 14, 1182 Joseph, S. K., Coll, K. E., Cooper, R. H., Marks, J. S. & Williamson, J. R. (1983) J. Biol. Chem. 258, 731-741 Kraus-Friedmann, N. (1984) Physiol. Rev. 64, 170-253 Luft, J. H. (1971) Anat. Rec. 171, 347-368 Marshall, S. E., McCormack, J. G. & Denton, R. M. (1984) Biochem. J. 218, 249-260 Martell, A. E. & Smith, R. M. (1977) Critical Stability Constants, vol. 1, Plenum Press, New York McCormack, J. G. (1985a) FEBS Lett. 180, 259-264 McCormack, J. G. (1985b) Biochem. J. 231, 581-595 McCormack, J. G. & Denton, R. M. (1980) Biochem. J. 190, 95-105 McCormack, J. G., Edgell, N. J. & Denton, R. M. (1982) Biochem. J. 202, 419-427 Moreno-Sanchez, R. (1985) J. Biol. Chem. 260, 12554-12560 Murphy, E., Coll, K. E., Rich, T. L. & Williamson, J. R. (1980) J. Biol. Chem. 255, 6600-6608 Nicholls, D. G. & Akerman, K. (1982) Biochim. Biophys. Acta 683, 57-88 Randle, P. J. (1986) Biochem. Soc. Trans. 14, 799-806 Robinson, J. & Cooper, J. M. (1970) Anal. Biochem. 33, 390-399 Siess, E. A., Brocks, D. G., Lattke, H. K. & Wieland, 0. H. (1977) Biochem. J. 166, 225-235 Somlyo, A. P., Bond, M. & Somlyo, A. V. (1985) Nature (London) 314, 622-625
Received 15 December 1986/3 March 1987; accepted 20 March 1987
1987