Vol- 6 • Issue-1 Sep - Mar 2015 pp.104-111
Impact Factor-2.5
available at www.csjournalss.com
Stock Prediction and Automated Trading System Vishal Parikh, Parth Shah CSE Department, Institute of Technology, Nirma University, Ahmedabad India-382481
[email protected],
[email protected]
Abstract - Stock market decision making is a very challenging and difficult task of financial data prediction. Prediction about stock market with high accuracy movement yield profit for investors of the stocks. Because of the complexity of stock market financial data, development of efficient models for prediction decision is very difficult, and it must be accurate. This study attempted to develop models for prediction of the stock market and to decide whether to buy/hold the stock using data mining and machine learning techniques. The classification techniques used in these models are naive bayes and random forest classification. Technical indicators are calculated from the stock prices based on time-line data and it is used as inputs of the proposed prediction models. 10 years of stock market data has been used for prediction. Based on the data set, these models are capable to generate buy/hold signal for stock market as a output. The main goal of this paper is to generate decision as per user’s requirement like amount to be invested, time duration for investment, minimum profit, maximum loss using machine learning and data analysis techniques.
Keywords - stock market prediction; technical analysis; automated stock market trading.
I. INTRODUCTION Stock prediction and automated trading system generates buy/hold signal for investors and traders. Based on the stocks historical data, the system finds the rule for prediction and then generate the signals. One of the advantage of our automated system is to restrict emotion of the traders about stock, hence system trades automatically if certain criteria are satisfied. Automated trading system is also known as an algorithmic trading which analyze the stock data and buy/sell stocks by itself. Based on the analysis, it generates specific rule for each stock and this rules are used for generating the buy/sell signal. This system is directly connected to brokers, who has permissions to buy or sell the stock by itself or it may be permitted by the user privileges. Automated Stock market trading system is totally based on prediction using past data. When user start using this system, system asks some data for prediction. The data required to input by the user is amount to be invested, minimum profit, maximum profit, maximum loss, and maximum time duration for investment. From these input parameters and past data set, system designs the strategy for individual stock for individual user. This system generate only buy/hold signal from the generated data. Sell signal is generating from the user’s input data such as time duration, minimum profit and maximum loss. So, by this way automated stock market trading system works to make maximum profit by minimum human intervention [1]. For development of automated trading system, stock market prediction must be required. There are two ways to predict the stock i) to predict the stock price and ii) to generate the buy or sell signal for the stock. In this paper buy/sell signal generation theory has been used for the stock prediction. There are two types of analysis for buy/sell signal generation i)Fundamental Analysis and ii)Technical Analysis. Fundamental analysis is based on company’s profile and assets in market, while technical analysis totally depends on company’s stock price in market, and volume trade on that particular price. In this paper model has been developed based on technical analysis. There are ten technical indicator used to develop the model. These indicators are used as a parameter for the prediction model. Naive Bayes classification, Random Forest classification, ANN, SVM, SVR techniques are used to generate the buy signal. We have design model based on naive bayes and random forest classification techniques to generate the buy/hold signal. The Sell signal is generated by users parameter like minimum profit, maximum profit, maximum loss and time period of investment. II. PREDICTION SYSTEMS From the study of various literature two main approaches has been found for stock market prediction namely fundamental analysis and technical analysis.
104
Vol- 6 • Issue-1 Sep - Mar 2015 pp.104-111
Impact Factor-2.5
available at www.csjournalss.com
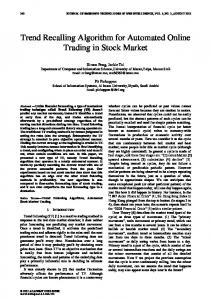
A.Fundamental Analysis Fundamental analysis analyze the financial condition or health of particular company on time instance. It also analyze company’s condition with respect to it’s competitors on same category. Basic criteria that analyze under fundamental analysis are interest rate, production, future contract, employment, government policies, GDP, management, manufacturing etc. Financial analysis evaluated based on the historical as well as current data. The main goal of fundamental analysis is to predict the future of company’s stock in the market. Fundamental analysis calculate statistics from company’s financial attributes like annual report, balance sheet, profit/loss statements, growth of the company, liquidity of investment etc. Text mining approach is used for fundamental analysis. Crawler find company’s fundamental attribute from newspaper and other financial news sources. By using text classifier, company’s news are categorized in to positive or negative news. Then based on historical data relation between news and stock price has been found. Automatic text classification is used to analyze the company’s fundamental statistics. Figure 1 from the source [2] is displaying the predictive systems consist of components such as news labeling, classifier input generation and classification.
Figure 1: Stock Market Fundamental Analysis [2] There are two ways to assign company’s news label, manually and automated. In manual label generation, financial expert read the news and categorize it. In automated system, label is automatically generated based on the available training data-set. Main goal of the classifier is to classify company’s two separate categories, either good news or bad news about selected stock’s price and company’s status in the market. B. Technical Analysis Technical Analysis is used to forecast the future financial price movement based on stock historical price movement. Technical parameters do not predict stock price, but based on historical analysis, technical parameters can predict the stock movement (up/down) on current market situation over time. Technical analysis help investor to predict the stock price movement (up/down) in particular time period. Technical analysis uses a wide variety of charts that show price over time[3]. Strength of technical analysis is as below. 1) Focus on Price and Volume : Technical indicators are calculated only based on stock price, and volume trade on particular price. Based on the historical data and price movement, technical indicators forecasts about the stock. Even though there are knee-jerks present in the stock market, but technical indicators have enough strength to give hint about the price movement. 2) Supply, Demand and Price Action : Stock prices varies based on the supply and demand of the stock at current time instance in the market. Technical indicators are derived form the stock’s high, low, close price and stock trade volume in the market. Thus technical indicators have strength to calculate supply/demand of particular stock in the market. 3) Support/Resistance : Based on the supply and demand, technical indicators are able to find it’s range. If supply of the stock is above range then it may be decrease in future and if it below range then it may increase in near future.
105
Vol- 6 • Issue-1 Sep - Mar 2015 pp.104-111
Impact Factor-2.5
available at www.csjournalss.com
III. TECHNICALINDICATORS Technical indicators are one type of parameter that is based on stock price and trading volume. It has ability to predict stock future price level or stock price direction in market using past patterns. Some basic and most useful technical indicators are as below [4][5]. A. Relative Strength Index (RSI) The formula for calculating relative strength index is:
RSI = 100
RS =
100 1 RS
Average of given periods closes UP Average of given periods closes DOWN
RSI indicator compare stock gain to losses and forecast about stock is oversold or overbought. RSI return value in range of 0 to 100. In general scenario if RSI is above 70, stock may be overbought and it indicate sell signal for particular stock and if RSI is bellow 30, stock may be oversold and it indicate buy signal. RSI threshold value for signal may change and accurate threshold can be found by analyzing stock data. B. Moving average convergence divergence (MACD) The formula for calculating MACD is:
MACDLine = 12DAY EMA 26DAY EMA SignalLine = 9DAY EMAof MACD Line Where, EMA(Exponential Moving Average) is just one type of simple moving average(SMA) but in EMA more weight has been assign for recent value. When the MACD goes below the signal line, it indicates sell signal, and when MACD goes above the signal line, it indicate sell signal. C. Stochastic Oscillator The formula for calculating stochastic Oscillator is:
% K = 100 *
(C L14) ( H 14 L14)
where, C = the most recent closing price L14 = the low of the 14 previous trading sessions H14 = the highest of the 14 previous trading sessions.
%D = 3 period moving averageof %K In general trend id %D is below 20 that indicate oversold means price is increase in near future and is %D above 80 that indicate overbought means price is decrease in near future. D. Williams %R Williams %R is calculated as below.
%R =
( H 14 C ) * (100) ( H 14 L14)
106
Vol- 6 • Issue-1 Sep - Mar 2015 pp.104-111
Impact Factor-2.5
available at www.csjournalss.com
%R return value between 0 to -100. If %R value above -20 it indicates sell signal and if %R value is below -80 it indicates buy signal for particular stock. E. Money Flow Index(MFI) The Money Flow Index (MFI) indicator is caluculated using stock price and it’s volume trade on particular price. MFI is calculated as below.
TypicalPrice =
( High Low Close) 3
RawMoneyFlow = TypicalPrice *Volume
MoneyFlowRatio =
(14 Period Positive Money Flow) (14 Period Negative Money Flow)
MoneyFlowIndex( MFI ) = 100
100 (1 MoneyFlowRatio)
MFI is used to indicate overbought and oversold signal. If MFI is less than 20 that means oversold and if MFI greater than 80 that means overbought. F. Bollinger Band Bollinger Bands is calculated as below. Middle Band = 20-days Simple Moving Average (SMA) Upper Band = 20-days SMA + (20-days SD of price * 2) Lower Band = 20-days SMA - (20-days SD of price * 2) Where, SMA is Simple Moving Average and SD is Standard Deviation of particular time period. When stock close price is above upper band then it indicates overbought signal and if stock close price below lower band then it indicates oversold signal. G. Commodity Channel Index(CCI) The Commodity Channel Index (CCI) is used to find the recent trends in stock market.
CCI =
(Typical Price 20 Period SMA of TP ) (0.015 * Mean Deviation)
where, Typical Price (TP) = (High + Low + Close)/3 In general trend if CCI above 100 it indicates uptrend and if CCI below -100 it indicates downtrend. H. Price Rate of Change(PRoC) PRoC indicator finds percentage of change in most recent price to the stock price of n period ago. Calculation of PRoC indicator is as below.
PRoC =
(Closing Price Today Closing Price n Periods Ago ) Closing Price of n Periods Ago
I. On-balance Volume(OBV) On Balance Volume (OBV) is volume based indicator that is used to find buying and selling trend of stock in stock market. Calculation of OBV is as below. If the closing price is above the prior close price then:
107
Vol- 6 • Issue-1 Sep - Mar 2015 pp.104-111
Impact Factor-2.5
available at www.csjournalss.com
Current OBV = Previous OBV + Current Volume If the closing price is below the prior close price then: Current OBV = Previous OBV - Current Volume If the closing prices equals the prior close price then: Current OBV = Previous OBV (no change) Table I describe technical Parameter Used in literature.
Research Paper [1] [6] [3] [7] [8] [9] [4] [10] [11] [12]
Technical parameter Posvol, Negvol, OBV, RSI, MACD, Momentum, %K, %D, Williams %R, Bollinger bands, MA RSI, %K, %D RSI, MACD, MA RSI, %K, %D, Bollinger bands, MA OBV, RSI, MACD, Momentum, %K, %D, Williams %R, CCI RSI, MACD, Momentum, %K, %D, Williams, MA OBV, RSI, MACD, %K, %D, Williams %R, Bollinger bands, CCI, MFI, ATR OBV,RSI, MACD, %K, %D, Williams %R,Bollinger bands,EMA RSI, MACD, %K, %D RSI, MACD, PRoC, MA Table I.TECHNICAL PARAMETERS
IV. DATAPROCESSING For stock market prediction, last 10 years data for particular stock of indian stock market has been collected from the source http://www.bseindia.com/. stock’s data like open price, close price, high price, low price and volume trade on daily basis has been taken. After getting the data all technical parameters has been calculated for whole 10 years of data and then other data preprocessing technique are applied which are describe as below [8]. A. Decision Parameter Generation The main goal of this paper is to predict buy/hold signal based on user input data. For that we actual decision has been calculated for training data set. Suppose user wants to invest X amount for 30 days time period and he/she wants to earn 10% profit on investment. For training decision calculation if price cross above 10% in next 30 days then, it indicates buy label, else hold label. Sell signal is generated by user parameters like minimum profit, maximum loss and time period. If stock reaches to any parameter boundary then sell signal is generated[7]. B. Feature selection It may happen that all the attributes are not equally important for all the stocks to generate decision using classifier. So, it is require to reduce the attributes for the best result. Weka-API has been used for development of this system. weka.attributeSelection.ClassifierSubsetEval algorithmhas been used, that finds the best use full attribute for chosen classifier and weka.attributeSelection. InfoGainAttributeEval algorithm that is used to find attribute rank according to their importance[1]. C. Outlier Detection and Removal In large data-set it may happen that some values are far away from the mean of the whole data-set, this data is known as outlier. This outlier must be removed from the data for better results. weka. filters.unsupervised.attribute. Interquartile Range has been used for detecting the outliers and weka.filters. unsupervised.instance. RemoveWithValues has been used for removing the outliers from the data-set.
108
Vol- 6 • Issue-1 Sep - Mar 2015 pp.104-111
Impact Factor-2.5
available at www.csjournalss.com
D. Discretization Discretization is used to convert continuous numerical values in to discrete value for data-set. weka.filters.unsupervised.attribute.Discretize has been used for performing descretization process on data-set.
V. PREDICTION MODEL Our main aim is to predict the stock’s trend in stock market. For prediction classification process tak place on daily data that classify data in to buy/hold category. Machine learning techniques are used for classification. Naive bayes, Random forest, Support Vector Machine(SVM), Artificial Neural Network(ANN), Support Vector Regression(SVR) techniques are use to classify the instances.Technical indicators are used as an input data and model predict buy/hold decision as output [9]. A. Naive Bayes Classification Naive bayes classification is based on Bayes theorem. In this classification method all the attributes values have independent effect on the class attribute. So, main advantage of this model is each attribute has capacity to contribute individually for decide the class attribute. Naive bayes classifier works with both numerical and nominal attributes [10]. Let D be a training set of attributes and their associated class attribute. As usual, each attribute is represented by an multidimensional attribute vector, X = ( x1 , x2 , x3 ..., xn ) , from this n attributes decision attribute has been calculated for each attribute respectively, A1 , A2 , A3 ..., An . Here x1 , x2 , x3 ... xn is a day wise stock data for n days and A1 , A2 , A3 ... An is a technical parameter (i.e. RSI, MACD etc.) which are describe in section III. Then probability of actual value of training data set of buy and hold signal has been calculated separately. After that probability of each technical indicator with actual decision with buy and hold signals has been calculated. After that it has been calculated total probability of buy and total probability of hold separately and generate decision based on these values. B. Random Forest Classification Random forest is one of the most popular classification techniques for stock market prediction. It is based on tree based learning. It is more efficient and accurate compare to other classification techniques. Random forest is ensemble learning technique that based on multidimensional decision tree for training [13]. Single decision is not able to predict accurately, so ensemble learning technique is used. It creates n no of trees for the learning purpose to increase the more accuracy and overcome on over-fitting issue. VI. EXPERIMENTAL RESULTS For validate this system experiment performed on stock based in BSE(India). Stock data has been taken from 1
st
st
January 2003 to 1 December 2014 for prediction. User parameters are taken generate decision.Suppose user want to invest X amount for 30 days and he wanted minimum 10% profit for his investment. Now model make prediction of buy/hold signal using proposed classification techniques. Accuracy,Precision and Recall is a parameter that are used to evaluate robustness the model.Description of this parameters are as below.
Precision =
Recall =
tp tp fp
tp tp fn
109
Vol- 6 • Issue-1 Sep - Mar 2015 pp.104-111
Accuracy =
Impact Factor-2.5
available at www.csjournalss.com
tp tn tp tn fp fn
where, tp = number of true positives values tn = number of true negative values fp = number of false positives values fn = number of false negative values Table II and Table III shows result of BSE-200 top gainer and top loser of 2014 respectively.
.Stock Name TVS Motor Aurobindo Ashok Leyland Bharat Forge Gujarat Pipavav Eicher Motors Apollo Tyres IRB AIA Engg. HPCL
Accuracy% 67.368 70.3689 72.3134 72.4778 83.3118 66.2031 71.0526 77.608 72.3952 73.5463
Naive Bayes Classifier Precision 0.6774 0.6681 0.7017 0.7398 0.7813 0.6727 0.7140 0.7793 0.7107 0.6956
Recall 0.6866 0.6748 0.7121 0.5554 0.6720 0.6684 0.7184 0.7224 0.6688 0.6173
Accuracy% 90.7256 92.377 91.5094 92.5285 95.0841 90.4033 90.4412 92.4917 92.9940 90.0215
Random Forest Classifier Precision 0.93078 0.9349 0.9301 0.9403 0.9491 0.9304 0.9244 0.9493 0.9353 0.9159
Recall 0.8837 0.8922 0.8853 0.8822 0.8960 0.8792 0.8843 0.8855 0.9096 0.8299
Random Forest Classifier Precision 0.9364 0.9209 0.9443 0.9401 0.9307 0.9385 0.9426 0.9438 0.9226 0.9304
Recall 0.9130 0.8776 0.9105 0.9105 0.8751 0.9205 0.8967 0.9448 0.9133 0.9344
Table II. BSE-200 Top Gainer Result Stock Name Bhushan Steel JP Associate Jindal Steel JP Power Reliance Comm Cairn India Mcleod Russel Reliance Power Sun TV GMR Infra.
Accuracy% 76.2674 67.4331 71.9828 72.315 71.888 79.2308 76.9003 78.7313 74.1615 76.9598
Naive Bayes Classifier Precision 0.6914 0.6151 0.7229 0.7480 0.7146 0.8458 0.7317 0.8385 0.7885 0.8155
Recall 0.7673 0.7322 0.6290 0.7839 0.6851 0.8359 0.7215 0.8413 0.7933 0.8155
Accuracy% 93.8537 91.1309 93.4483 91.5036 90.9232 90.8242 93.2873 92.6119 89.9379 91.5474
Table III. BSE-200 Top Loser Result
VII. CONCLUSION This research paper shows how stock market decision is predicted using technical analysis. At it also present the technique of decision prediction using machine learning and data mining techniques. This technique predict buy/hold signal for stocks and it based on user input perimeter like time duration for investment and minimum profit that user want. Various data mining technique like feature selection, outlier detection, discretization is use for data preprocessing. This paper also presents the result of BSE-200 top 10 gainer and BSE-200 top 10 loser using naive bayes and random forest classification technique. So, by this way automated trading system works by predicting the stock using machine learning and data analysis. As a future scope of this paper more classification method like SVM, Nueral Network can be use to predict the buy/hold decision. And secondly more experiment can be perform with different profile rate and different duration.
110
Vol- 6 • Issue-1 Sep - Mar 2015 pp.104-111
Impact Factor-2.5
available at www.csjournalss.com
REFERENCES 1.
2. 3. 4. 5. 6. 7. 8. 9. 10. 11. 12. 13.
S. B. V. M. Binoy B. Nair, M. Minuvarthini, “Stock market prediction using a hybrid neuro-fuzzy system,” IEEE International Conference on Advances in Recent Technologies in Communication and Computing, 2010. S. M. Azadeh Nikfarjam, Ehsan Emadzadeh, “Text mining approaches for stock market prediction,” IEEE Computer and Automation Engineering, 2010. H. K. Izumi, F.Toriumi, “Evaluationofautomatedtradingstrategiesusinganartificialmarket,” Elsevier Neurocomputing, 2009. M. S. R. Sheikh Shaugat Abdullah, “Stock market prediction model using tpws and association rules mining,” IEEE Computer and Information Technology, 2012. “Stockcharts.com.” accessed on: 2014-12-01 J.T. Simon Fong, Yain-Whar Si, “Trend following algorithms in automated derivatives market trading,” Elsevier Expert Systems with Applications, 2012. A. L. I. d. O. Lamartine Almeida Teixeira, “A method for automatic stock trading combining technical analysis and nearest neighbor classification,” Elsevier Expert Systems with Applications, 2010. P.-C. C. featuresJheng Long Wu, Liang-Chih Yu, “An intelligent stock trading system using comprehensive features,” Elsevier Applied Soft Computing, 2014. O. K. B. Yakup Kara, Melek Acar Boyacioglu, “Predicting direction of stock price index movement using artificial neural networks and support vector machines,” Elsevier Expert Systems with Applications, 2011. J. K. A. Hyun Joon Jung, “A binary stock event model for stock trends forecasting,” IEEE International Conference on Intelligent Systems Design and Applications, 2011. Y. Ye, “The information content of technical trading rules: Evidence from us stock markets,” IEEE Business Management and Electronic Information, 2011. A. K. K. Shipra Banik and M. Anwer, “Dhaka stock market timingdecisions by hybrid machine learning technique,” IEEE Computer andInformation Technology, 2012. F. M. Ash Booth, Enrico Gerding, “Predicting equity market price impact with performance weighted ensembles of random forests,” IEEE Computational Intelligence for Financial Engineering and Economics, 2014.
111