This paper discusses the application of support vector machine. (SVM) in stock price ... deal with the application of SVM in time series forecasting. They concern ..... 6. http://www.spaceandmotion.com/quantum-theory-albert-einstein-quotes.htm.
Stock Time Series Forecasting Using Support Vector Machines Employing Analyst Recommendations* Zhi-yong Zhang1,2, Chuan Shi1,2, Su-lan Zhang1,2, and Zhong-zhi Shi1 1
Institute of Computing and Technology, Chinese Academy of Sciences, Beijing 100080 2 Graduate School of the Chinese Academy of Sciences, Beijing 100039, China {zhangzy, shic, zhangsl, shizz}@ics.ict.ac.cn Abstract. This paper discusses the application of support vector machine (SVM) in stock price change trend forecasting. By reviewing prior research, thirteen technical indicators are defined as the input attributes of SVM. By training this model, we can forecast if the stock price would rise the next day. In order to make best use of market information, analyst recommendations about upgrading stocks are employed. So we put forward an improved method to evaluate if an upgrade classification of SVM is reliable. In our method, recommendation accuracy is first calculated according to historical advice. Then the more objective relative accuracy is deduced by considering the influence of total stock market index. Moreover, improved model is examined with the real data in Shanghai stock exchange market. Finally, we discuss some interesting hints to help readers understand this model more explicitly.
1 Introduction SVM offers remarkable generalization performance in many areas such as pattern recognition, text classification and regression estimation. Recently, some researchers deal with the application of SVM in time series forecasting. They concern about how to make precise value prediction by means of support vector regression. However this is difficult since stock time series are random walk and non-stationarity. Obviously, we can make profit if we can forecast the direction of change of stock price. In this paper, we attempt to achieve this by using support vector classification. As Einstein told Born, you believe in a God who plays dice, I believe in complete law and order [6]. If we could know the predictive model and all parameters, the stock price could be exactly predicted. However that is impossible in reality. News articles are adopted to make up the lack of stock market information [3]. But text-mining technique is still not mature to extract valuable and concise information. Moreover, authors are not experts, even cannot correctly using terms and expressing information. Third, analyst recommendations are more authoritative since analysts understand the stock market better. Also, the data are often structurally expressed. The rest of the paper is organized as follows: In Section 2, we discuss some key factors, input attributes of C-SVC and the methods of using analyst recommendations. The experimental results are shown in Section 3 and concluded in Section 4. *
This work is supported by the National Science Foundation of China (60435010), National Great Basic Research Priorities Programme (973 Program: Grant No.2003CB317004) and the Nature Science Foundation of Beijing (4052025).
J. Wang et al. (Eds.): ISNN 2006, LNCS 3973, pp. 452 – 457, 2006. © Springer-Verlag Berlin Heidelberg 2006
Stock Time Series Forecasting Using SVMs Employing Analyst Recommendations
453
2 Improved Trend Prediction Model 2.1 Some Key Factors About C-SVC One main factor when using SVM is how to select kernel function. Linear kernel, polynomial kernel, RBF and sigmoid kernel are usually adopted. In this work, we use general RBF kernel function with two parameters: C and γ [1]. The accuracy of SVM depends on selecting appropriate parameters in training procedure. The crossvalidation is preferable for this procedure [5]. In v-fold cross-validation, we divide the training set into v subsets of equal size. Sequentially one subset is tested using the classifier trained on the remaining v-1 subsets. Thus, each instance of the whole training set is predicted once so the cross-validation accuracy is the percentage of data that are correctly classified. This can also effectively avoid the over-fitting problem. In order to approximate the cross-validation rate, we also use grid-search, an automatic grid and pattern search approach, iterating through ranges of parameters to find the optimal parameter values [5]. Though it is time-consuming, this approach does an exhaustive parameter search. And the computational time is not much more than other advanced methods since there are only two parameters. Furthermore, the grid-search can be easily paralleled because each ( C , γ ) is independent. 2.2 Input Attributes of C-SVC By reviewing prior research, thirteen technical indicators, presented in Table1, can be used as the input attributes of C-SVC [2]. Where Ct , Lt and H t are the closing price, the low price and the high price at time t , respectively. average of closing price during the last
t days and is defined as
MAt is the moving
∑
n i =1
Ct −i +1 / t .
2.3 Employing Analyst Recommendations By training C-SVC, we can forecast if the price of a stock will rise in next day. Then how can we estimate the reliability about an upgrade prediction? It is available that an analyst familiar with a stock advises its price will upgrade. In this subsection, we attempt to distinguish which predictions are reliable in recommendations periods --the special terms in time series. There are many types of recommendations, such as stock target price and upgrading stocks advice [7]. In this paper, they are upgrading stock advice in a short or middle term. Professionally [8], we define the short terms as from next day to 45th natural day, and the middle terms from the 30th to the 120th. Obviously, analyst is familiar with the forecasted stock is very crucial. If he has accurately advised the rise of the stock price, his recommendations and the stock price can be considered as positive correlation, or else being inverse correlation. Therefore, recommendation accuracy is first evaluated according to the stock price in his former advice term. In addition, total stock market index may produce disastrous influence on stock price. For example, most of stocks will downgrade when total stock market index drops. Hence we can consider it as accurate with rise or even unchanged price vs. downgrading total market index. Thus we will calculate relative recommendation accuracy and eliminate market influence.
454
Z.-y. Zhang et al.
Table 1. The following 13 technical indicators are calculated with daily price features. By training C-SVC with these 13 input atributes, the trend of stock price will be forecasted.
Attribute
Formula
DateID
t
%K
Description The t − th day in the time series.
(Ct − LLt −n )/(HHt −n − LLt −n ) ×100
Comparing a security’s price closed relative to its price range over n days. Where LLt and HH t mean the lowest price and highest high price during the last t days.
%D Slow %D Momentum ROC Williams’ %R A/D Oscillator Disparity5 Disparity10 OSCP
∑ ∑
n −1 i=0 n −1 i=0
% K t −i / n
Moving average of %K.
% Dt −i / n
Moving average of %D.
Measuring the amount change of a security’s price over four days. Price rate-of-change. It displays the C t / C t − n × 100 difference between the current price and the price n days ago. A momentum indicator measuring (HHt −n − Ct )/(HHt −n − LLt −n ) ×100 overbought/oversold levels. momentum indicator associating ( H t − C t −1 ) /( H t − L t ) A changes in price. The distance of current price and the Ct / MA5 × 100 moving average of 5 days.
Ct − Ct − 4
Ct / MA10 × 100
10-day disparity. The difference between two moving averages of a security’s price.
( MA5 − MA10 ) / MA5 (Mt − SMt ) /(0.015Dt ) where Mt = (Ht + Lt + Ct ) / 3
Commodity channel index. It measures the variation of a security’s price from its statistical mean.
SMt = ∑i =1 Mt −i+1 / n
CCI
n
Dt = ∑i=1 Mt −i+1 − SMt / n n
100 −100/ RSI
(1+ (∑
Upt −i / n)/(∑i=0 Dwt −i / n)
n−1
i =0
n−1
)
Relative strength index. It is a price following an oscillator that ranges from 0 to 100. Where Upt and Dwt mean upward and downward price change at time t, respectively.
Stock Time Series Forecasting Using SVMs Employing Analyst Recommendations
455
Let’s explain our improved algorithm in detail with an example as follow. Assure analyst advises the price of a stock (e.g. S 6008 01 ) will rise in a short period since . Hence this period ( Rperiod ) would be from t s + 1 ( t 1 ) to t s + 4 5 ( t 4 5 ). Total stock market index is named as S t o t a l . Let
time t
s
Rperiod1 ,L, Rperiodm denote all recommendation periods preceding to Rperiod ,
jt0 is the time when analyst give the j − th recommendation. Firstly, the relative upgrade ratio in t − th trading day of Rperiod j ( RUR jt ) can be got as formula (1). IUR jt = IPjt / IPjt − 1, TUR jt = TPjt / TPjt − 1, RUR jt = IUR jt − TUR jt 0
0
Where IP jt and T P j t are the closing price of S 6 0 0 8 0 1 and S t o t a l in
(1)
t − th trading
day of Rperiod j , respectively. IP jt and T P j t are the closing price at time 0 0
jt0 .
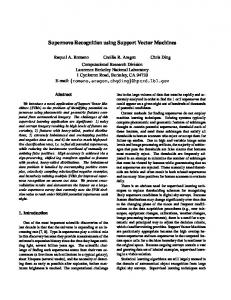
Hence IU R jt and T U R jt are the upgrade ratio of them. As depicted in Fig.1, relative upgrade ratio ( R U R jt ) is increased and decreased at time t 8 and t 1 1 respectively, since total stock market index drops and rise.
Fig. 1. Note that each value is the upgrading ratio of closing price in i-th day ( IPjt / TPjt ) to that in which analyst give the recommendation ( IP jt / T P j t ). Relative upgrade ratio R U R jt 0 0 enhances in 8-th day since total stock market index drops, and contrary in 11-th day.
Then
RACRtk , the average RURt for S 6008 01 in Rperiod1 ,L, Rperiodm , should
be evaluated according to equation (2). Note that for each recommended days before
⎛
m
RAC R t = ⎜ ∑
tk in Rperiod , all former
tk should be employed. td j
∑ RU R
+
k
∑ RUR
⎞ ⎟ ⎠
⎛ m ⎜ ∑ ( td j ) + ⎝ j =1
⎞
k⎟
(2) i =1 ⎠ ⎝ j =1 q =1 Where td j is the number of trading days in Rperiod j . Finally we can evaluate the k
reliability of upgrade forecast at
jq
tk by the follow two formulas.
⎧⎪1, ACCt = sgn( RACRt − RURt ) = ⎨ ⎪⎩0, k
k
ti
k
RACRt − RURt > 0 k
k
RACRt − RURt ≤ 0 k
k
(3)
456
Z.-y. Zhang et al.
Cont = ACCt ∧ UFCt , k
k
ACCt , UFCt ∈ {0,1}
k
k
(4)
k
sgn is a denote function, U F C t is the upgrade forecast at tk by training C-SVC, Contk is the final forecast result through logical AND rule. If Contk equate
Where
k
to 1, the upgrade forecast is reliable, otherwise being not reliable.
3 Research Data and Experimental Results 3.1 Data Set In this study, we use the daily stock price index in Shanghai stock exchange market. The period of training data is from 01/01/2003 to 01/31/2005 and the period from 02/01/2005 to 09/30/2005 is for testing data. Based on the formulas in Table1, thirteen input attributes are first calculated. Each attributes is normalized and scaled into the range of [0, 1]. The changing trend of stock price in next trading day is categorized as “0” or “1”. If the closing price in next day is 0.5% higher than the current, the class label of the current day is “1”, else “0”. In addition, more than 399 analyst recommendations about 218 stocks were employed [7]. Where about 221 recommendations belong to short term and the 178 belong to middle term. 3.2 Experimental Results The popular LIBSVM is used to perform our experiment [4]. After scaling the training data, we train it with five-fold cross-validation and grid-search. In view of the pages restriction on the paper, we only depict the training result about S 6 0 0 8 0 1 . The
best probability estimates about ( C , γ , correct rate) is ( 0.94278, 3.86375, 63.843 ) and 95 of total 158 samples in testing data set are classified. Table 2. Three stock upgrade are forecasted with C-SVC (UFC=1). By employing analyst recomemdations, only two are conformed (Con=1). Hence the uncorrect upgrade forecast in 9/21/2005 is excluded by using C-SVC and analyst recomemdations meanwhile.
Date
ACR
RUR
UFC
ACC
Con
Class Label
2005-8-22
0.031154
0.02642
0
1
0
1
1
0
0
0
…… 2005-9-21
0.044926
0.1114 ……
2005-9-26
0.045076
0.03441
0
1
0
0
2005-9-27
0.044741
0.01289
1
1
1
1
2005-9-28
0.044477
0.01911
1
1
1
1
Stock Time Series Forecasting Using SVMs Employing Analyst Recommendations
457
As listed in Table2, for S 6 0 0 8 0 1 , there are three upgrade predictions (UFC=1) in testing data but only two are conformed (Con=1). So in this case, an error upgrade forecast of C-SVC is excluded by employing improved forecast model. In order to verify our improved model roundly, more stocks are tested and most get better results.
4 Conclusions Due to random walk and non-stationarity, we attempt to analyze the forthcoming trend rather than predict regressive values. In order to make best use of market information, we put forward an improved model by employing analyst recommendations. We explain relative recommendation accuracy and logical AND rule correlative to total stock market index. Based on this forecasting model, we can distinguish if an upgrade forecast of C-SVC is reliable. Experiments are conducted to evaluate the performance of the model based on actual data during recent three years. The results indicate that recommendations really contribute to stock trend forecasting.
References 1. Haykin, S.: Neural Networks: A Comprehensive Foundation. 2nd edn, Englewood Cliffs, NJ: Prentice Hall, (1998) 2. Kim, K.J.: Financial Time Series Forecasting Using Support Vector Machines. Neurocomputing 55 (2003) 307-319 3. Fung, G.P.C., Yu, J.X., Lam, W.: Stock Prediction: Integrating Text Mining Approach using Real-Time News. In: Computational Intelligence for Financial Engineering, (2003) 395-402 4. Chang, C.C., Lin, C.J.: LIBSVM: A Library for Support Vector Machines. Technical Report, Department of Computer Science, National Taiwan University, (2001) 5. Hsu, C.W., Chang, C.C.: A Practical Guide to Support Vector Classification. Department of Computer Science and Information Engineering, National Taiwan University, (2003) 6. http://www.spaceandmotion.com/quantum-theory-albert-einstein-quotes.htm 7. http://www.skyone.com.cn/share/main.jsp?pcat=tytyzx&unicat=tyggtj&acat=tyyj 8. http://www.hzhao.com/bbs/read.php?tid=15619