Fisheries
ISSN: 0363-2415 (Print) 1548-8446 (Online) Journal homepage: http://www.tandfonline.com/loi/ufsh20
StreamThermal: A Software Package for Calculating Thermal Metrics from Stream Temperature Data Yin-Phan Tsang, Dana M. Infante, Jana Stewart, Lizhu Wang, Ralph W. Tingly III, Darren Thornbrugh, Arthur R. Cooper & Wesley M. Daniel To cite this article: Yin-Phan Tsang, Dana M. Infante, Jana Stewart, Lizhu Wang, Ralph W. Tingly III, Darren Thornbrugh, Arthur R. Cooper & Wesley M. Daniel (2016) StreamThermal: A Software Package for Calculating Thermal Metrics from Stream Temperature Data, Fisheries, 41:9, 548-554 To link to this article: http://dx.doi.org/10.1080/03632415.2016.1210517
Published online: 24 Aug 2016.
Submit your article to this journal
View related articles
View Crossmark data
Full Terms & Conditions of access and use can be found at http://www.tandfonline.com/action/journalInformation?journalCode=ufsh20 Download by: [Yin-Phan Tsang]
Date: 24 August 2016, At: 19:35
FEATURE
StreamThermal:
A Software Package for Calculating Thermal Metrics from Stream Temperature Data
548
Fisheries | Vol. 41 • No. 9 • September 2016
Yin-Phan Tsang* Department of Fisheries and Wildlife, Michigan State University, 1405 S. Harrison Rd. Suite 318, East Lansing, MI 48823. E-mail:
[email protected] Dana M. Infante Department of Fisheries and Wildlife, Michigan State University, East Lansing, MI Jana Stewart U.S. Geological Survey, Wisconsin Water Science Center, Middleton, WI Lizhu Wang International Joint Commission, Great Lakes Regional Office, Windsor, ON, Canada Ralph W. Tingly III Department of Fisheries and Wildlife, Michigan State University, East Lansing, MI Darren Thornbrugh Oak Ridge Institute for Science and Education, Post-doctoral Participant, c/o National Health and Environmental Effects Research Laboratory, Western Ecology Division, U.S. Environmental Protection Agency, Corvallis, OR Arthur R. Cooper and Wesley M. Daniel Department of Fisheries and Wildlife, Michigan State University, East Lansing, MI *Present address for Yin-Phan Tsang: Department of Natural Resources and Environmental Management, 1910 EastWest Rd., Sherman 243, University of Hawaii, Manoa, Honolulu, HI 96822.
Fisheries | www.fisheries.org
549
Improving quality and better availability of continuous stream temperature data allow natural resource managers, particularly in fisheries, to understand associations between different characteristics of stream thermal regimes and stream fishes. However, there is no convenient tool to efficiently characterize multiple metrics reflecting stream thermal regimes with the increasing amount of data from continuously recording data loggers. This article describes a software program packaged as a library in R to facilitate this process. With this freely available package, users will be able to quickly summarize metrics that describe five categories of stream thermal regimes: magnitude, variability, frequency, timing, and rate of change. The installation and usage instruction of this package, the definition of calculated thermal metrics, as well as the output format from the package are described, along with an application showing the utility for multiple metrics. We believe that this package can be widely utilized by interested stakeholders and can greatly assist future fisheries studies.
StreamThermal: un software para calcular medidas térmicas a partir de datos de temperatura en ríos
Mejorar la calidad y disponibilidad de datos continuos de temperatura en los ríos permite a manejadores de recursos naturales, particularmente en pesquerías, entender la relación entre diferentes características de regímenes térmicos en los ríos y los peces que los habitan. No obstante, no existe una herramienta conveniente para caracterizar de forma eficiente diferente métricas que reflejen regímenes térmicos fluviales mediante la creciente cantidad de datos provenientes de dispositivos de registro continuo. En este artículo se describe un software programado en lenguaje R con el fin de facilitar dicho proceso. Con este software de acceso gratuito, los usuarios serán capaces de resumir rápidamente las métricas que describen cinco categorías de regímenes térmicos en ríos: magnitud, variabilidad, frecuencia, sincronización y tasa de cambio. Se describe la instalación e instrucciones de uso, la definición de las métricas utilizadas y el formato de salida de los archivos del programa; así mismo se ofrece una aplicación que muestra la utilidad de diferentes métricas. Creemos que este paquete puede ser ampliamente utilizado por usuarios interesados y puede ser de ayuda en un futuro para estudios de pesquerías.
StreamThermal: un progiciel de calcul des valeurs thermiques à partir des données de température des cours d’eau L’amélioration de la qualité et une meilleure disponibilité des données en continu de la température des cours d’eau permet aux gestionnaires de ressources naturelles, en particulier dans les pêcheries, de comprendre les associations entre les différentes caractéristiques des régimes thermiques des cours d’eau et les poissons de ruisseaux. Cependant, il n’existe pas d’outil pratique pour caractériser efficacement plusieurs paramètres reflétant les régimes thermiques des cours d’eau avec une quantité croissante de données provenant d’enregistreurs de données en continu. Cet article décrit un logiciel conditionné en package sous R pour faciliter ce processus. Avec ce package, disponible gratuitement, les utilisateurs seront en mesure de résumer rapidement les paramètres décrivant cinq catégories de régimes thermiques des cours d’eau : l’amplitude, la variabilité, la fréquence, le temps, et le taux de changement. Les instructions d’installation et d’utilisation de ce package, la définition des paramètres thermiques calculés, ainsi que le format de sortie du package sont décrits, et une application montre l’utilité de plusieurs paramètres. Nous croyons que ce package peut être largement utilisé par les parties intéressées et peut grandement aider les futures études sur les pêches.
MULTIPLE CHARACTERISTICS OF STREAM THERMAL REGIMES MATTER TO STREAM FISHES A stream’s thermal regime includes characteristics of water temperatures summarized over time periods of interest. Characteristics can include those used to define streamflow regimes like magnitude, timing, frequency, duration, and rate of change (e.g., Poff et al. 1997), and they may include variability in magnitudes and predictability of thermal patterns over time (e.g., Arismendi et al. 2013). Though many studies have shown how stream fishes respond to water temperatures characterized by magnitude, recent studies reveal how timing of and fluctuations in thermal events may also affect fishes (e.g., Wehrly et al. 2003; Mora and Maya 2006). Together, these ideas underscore the need for better understanding of relationships between stream fishes and multiple characteristics of stream thermal regimes. SUMMARIZING MULTIPLE CHARACTERISTICS OF THERMAL REGIMES: A CHALLENGE Though use of thermometers recording maximum and minimum temperatures over time periods of interest (days, months, seasons) offers insights into extreme conditions, expanding use of continuously recording data loggers offers additional information for characterizing multiple properties of thermal regimes. Currently, natural resource management
550
Fisheries | Vol. 41 • No. 9 • September 2016
agencies and researchers throughout the United States incorporate the collection of water temperature data with continuously recording loggers as part of stream assessment efforts, with individual record collection occurring in short time intervals (i.e., every second, every 15 minutes, hourly). This practice yields massive amounts of data for characterizing different aspects of thermal regimes. Paired with the growing understanding of influences of multiple characteristics of thermal regimes on fishes, such data can be used to explore relationships between stream fishes and many temperature metrics. However, managing these large data sets for a given site and synthesizing information from multiple sites requires a substantial time commitment to generate comparable metrics. STREAMTHERMAL To aid in efforts to more fully characterize stream thermal regimes, one of us (Yin-Phan Tsang) developed a coding package, StreamThermal version 1.0, for use in “R,” a language and an environment for running statistical and analytical processes (R Core Team 2014). R is publicly available and free to use, making it applicable for many users. StreamThermal synthesizes daily average, maximum, and/or minimum stream temperature records into thermal metrics for a time period of interest, including months or user-defined seasons. Multiple thermal metrics may be generated from StreamThermal and grouped into five categories describing different aspects
of stream thermal regimes (Table 1). Magnitude metrics characterize monthly and seasonal averages and the maximum and minimum from daily temperatures as well as 3-, 7-, 14-, 21-, and 30-day moving averages for mean and maximum daily temperatures. Variability metrics summarize monthly and seasonal range in daily mean temperatures as well as monthly coefficient of variation of daily mean, maximum, and minimum temperatures. Variability metrics also include moving averages for daily ranges and moving variability in extreme temperatures, calculated from differences in average high and low temperatures over various time periods. Frequency metrics indicate numbers of days in months or seasons that key events exceed user-defined temperatures. Timing metrics indicate Julian days of key events including mean, maximum, and minimum temperatures; they also indicate Julian days of mean, maximum, and minimum values over moving windows of specified size. The final category includes monthly and seasonal rate of change, which indicates the difference in magnitude of maximum and minimum temperatures divided by number of days between these events. To calculate stream thermal metrics, StreamThermal requires at least one month of data including date, and maximum, minimum, and mean daily temperatures, assembled in that order in four columns of data frame in R. When multiple years of data are available, users can separate data into individual years before running StreamThermal or may use the entire data set to calculate metrics over multiple years and observe long-term trends in the thermal regime. Missing records are allowed within the data set, and StreamThermal will calculate metrics for a time period of interest provided that data are available for two-thirds of that time and provided that there is no consecutive gap in records of more than five days. Metrics are calculated in groupings (Table 1), and R provides output in a data frame format. TESTING FISH ASSOCIATIONS WITH THERMAL METRICS To highlight the utility of StreamThermal, we tested associations between fishes with diverse thermal preferences and a subset of thermal metrics for streams in the Upper Midwest ecoregion (USEPA 2006), which includes portions of Michigan, Wisconsin, and Minnesota. Fish data assembled were collected between 1990 and 2010, and collection methods are described in Daniel et al. (2015). Fish data include abundances of coldwater species (e.g., Brook Trout Salvelinus fontinalis, Brown Trout Salmo trutta), warmwater species (e.g., Rock Bass Ambloplites rupestris, Common Shiner Luxilus cornutus), and transitional species (e.g., Creek Chub Semotilus atromaculatus, Johnny Darter Etheostoma nigrum), with thermal preferences assigned by Lyons et al. (2009). To describe thermal characteristics of stream reaches, we acquired daily data from U.S. Geological Survey stream temperature gauges located throughout the region and from datasets provided by the Michigan and Wisconsin Departments of Natural Resources and the Minnesota Pollution Control Agency. For analysis, 290 stream reaches were identified with both fishes and water temperature data, and daily maximum, mean, and minimum temperatures of streams served as input for StreamThermal. From the set of metrics calculated, four were chosen to test associations between fish abundances and different elements of thermal regimes, including representations of magnitude (summer mean and spring maximum average daily temperatures), variability (summer
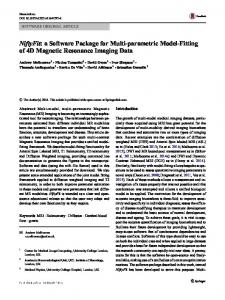
average daily range in temperature), and timing of thermal events (Julian day of maximum of daily temperature of the year; Figure 1). Associations were evaluated using Indicator Species Analysis (Dufrêne and Legendre 1997) with Threshold Indicator Taxa Analysis (Baker and King 2010). Methods are described in detail in Sievert et al. (2016). Associations between abundances of fishes and metrics were evaluated using bootstrapping procedures within Threshold Indicator Taxa Analysis (following Baker and King 2010). Significant associations were determined through consistencies in both purity (i.e., positive or negative directions) and reliability (90% of bootstrap replicates achieved, P < 0.05). SPECIES SHOW VARIED ASSOCIATIONS WITH THERMAL METRICS Species showed variable associations with magnitude, variability, and timing metrics. Coldwater species (Brown and Brook trouts) decreased with summer and spring magnitudes, whereas transitional and warmwater species increased with increasing magnitudes across the study region (Figures 1A and 1B). For summer average daily mean temperature (Figure 1A), abrupt shifts in abundances occurred between coldwater and transitional/warmwater species within the transitional range (17.5–21.0°C) identified by Lyons et al. (2009), whereas species associations were more variable with spring maximum daily mean temperature (Figure 1B). Brook and Brown trouts consistently showed negative associations with increases in temperature metrics; however, these species had markedly different within-metric associations. Brown Trout had significant negative associations with all thermal metrics, always with the lowest value along the temperature metric gradient. In contrast, Brook Trout were not significantly associated with summer average daily range (Figure 1C) and had a later seasonal association (late July vs. late June) with daily maximum temperature (Figure 1D). In contrast, neither warmwater species showed significant associations with variability in summer temperatures. These differences in associations and fish sensitivity to different levels of metrics suggest complex influences of thermal regimes on stream fishes. Robust evaluation of thermal influences on fishes, aided by generation of multiple metrics, can support development of differing management approaches for species of interest to current and projected thermal characteristics of streams, offering greater opportunities for conservation of stream fishes. SOFTWARE AVAILABILITY The StreamThermal version 1.0 package can be downloaded from github (github.com/tsangyp/StreamThermal), or type in “install_github(‘StreamThermal’,’tsangyp’, ref = “v1.0”)” in the R console, a function provided by “devtools” library. ACKNOWLEDGMENT We thank an anonymous reviewer for input. FUNDING This product was developed with support from the U.S. Geological Survey National Climate Change and Wildlife Science Center and was also supported by the U.S. Department of Interior Northeast Climate Science Center. Any use of trade, firm, or product names is for descriptive purposes only and does not imply endorsement by the U.S. Government.
Fisheries | www.fisheries.org
551
Figure 1. The selected fish species’ association with (A) summer average daily mean temperature, (B) spring maximum daily mean temperature, (C) summer average daily range in temperature, and (D) Julian day of maximum of daily maximum temperature of the year. Red solid circles indicate a positive association. Black solid circles indicate a negative association. Symbols are sized in proportion to z scores (Baker and King 2010). Horizontal lines overlapping each symbol represent 5th and 95th percentiles among 100 bootstrap replicates.
552
Fisheries | Vol. 41 • No. 9 • September 2016
Table 1. List of thermal metrics in five categories calculated by StreamThermal package (version 1.0). Metrics
Definition
Unit
Magnitude (58) Static average Monthlya ADmax
Average daily max temperature
°C
Admin
Average daily minimum temperature
°C
ADmean
Average daily mean temperature
°C
Seasonalb, c MaxDmean
Maximum daily mean temperature
°C
MinDmean
Minimum daily mean temperature
°C
AvgDmean
Average daily mean temperature
°C
Maximum of 30-, 21-, 14-, 7-, 3-day moving average of daily mean
°C
Maximum of 30-, 21-, 14-, 7-, 3-day moving average of daily maximum
°C
Moving average Max30MovingAMeanT Max21MovingAMeanT Max14MovingAMeanT Max7MovingAMeanT Max3MovingAMeanT Max30MovingAMaxT Max21MovingAMaxT Max14MovingAMaxT Max7MovingAMaxT Max3MovingAMaxT Variability (82) Static variability Monthlya ADrange
Average daily range in temperature
°C
Rmean
Range of daily mean temperature
°C —
CVDmax
Coefficient of variation of daily maximum temperature
CVDmin
Coefficient of variation of daily minimum temperature
—
CVDmean
Coefficient of variation of daily mean temperature
—
Seasonalb, c Rmax
Range of daily maximum temperature
°C
Rmin
Range of daily minimum temperature
°C
Rmean
Range of daily mean temperature
°C
Maximum of 30-, 21-,14-, 7-, 3-day moving average of daily range
°C
Moving variability Moving average of variability Max30MovingADRT Max21MovingADRT Max14MovingADRT Max7MovingADRT Max3MovingADRT Moving variability in extremes DiffExtreme6-30
The 6-day average high minus the 6-day average low over the warmest 30-day window
°C
DiffExtreme5-21
The 5-day average high minus the 5-day average low over the warmest 21-day window
°C
DiffExtreme4-14
The 4-day average high minus the 4-day average low over the warmest 14-day window
°C
tDiffExtreme2-7
The 2-day average high minus the 2-day average low over the warmest 7-day window
°C
DiffExtreme1-3
The 1-day average high minus the 1-day average low over the warmest 3-day window
°C
Frequency (48) Monthlya FmaxcT*
Number of days that daily maximum temperature exceeds temperature of interest
days
FmincT*
Number of days that daily minimum temperature exceeds temperature of interest
days
FmeancT*
Number of days that daily mean temperature exceeds temperature of interest
days
Seasonalb, c FmaxcT*
Number of days that daily maximum temperature exceeds temperature of interest
days
FmincT*
Number of days that daily minimum temperature exceeds temperature of interest
days
FmeancT*
Number of days that daily mean temperature exceeds temperature of interest
days
Fisheries | www.fisheries.org
553
Table 1 (continued). List of thermal metrics in five categories calculated by StreamThermal package (version 1.0). Metrics
Definition
Unit
Timing (63) Timing of static metrics Monthlya JDmaxMaxT
Julian day of maximum daily maximum temperature
day
JDminMinT
Julian day of minimum daily minimum temperature
day
JDmaxMeanT
Julian day of maximum daily mean temperature
day
Seasonalb, c JDmaxMaxT
Julian day of maximum daily maximum temperature
day
JDminMinT
Julian day of minimum daily minimum temperature
day
JDmaxMeanT
Julian day of maximum daily mean temperature
day
Julian day of maximum daily mean of 30-, 21-, 14-, 7-, 3-day moving window
day
Julian day of maximum daily maximum of 30-, 21-, 14-, 7-, 3-day moving window
day
Julian day of maximum daily range of 30-, 21-, 14-, 7-, 3-day moving window
day
The difference in maximum and minimum daily mean temperature divided by the number of days between events
°C/day
The difference in maximum and minimum daily mean temperature divided by the number of days between events
°C/day
Timing of moving metrics JDM30MAMeanT JDM21MAMeanT JDM14MAMeanT JDM7MAMeanT JDM3MAMeanT JDM30MAMaxT JDM21MAMaxT JDM14MAMaxT JDM7MAMaxT JDM3MAMaxT JDM30MADRT JDM21MADRT JDM14MADRT JDM7MADRT JDM3MADRT Rate of change (16) Monthlya RC Seasonal
b, c
RC
Monthly calculated for each month: January (1) through December (12). Metrics are calculated for spring (Sp), summer (Su), fall (Fa), and winter (Wi). These seasons may be defined by the user. c Metrics including user-defined parameters (e.g., seasons, temperature of interest). a
b
REFERENCES Arismendi, I., S. L. Johnson, J. B. Dunham, and R. Haggerty. 2013. Descriptors of natural thermal regimes in streams and their responsiveness to change in the Pacific Northwest of North America. Freshwater Biology 58(5):880–894. Baker, M. E., and R. S. King. 2010. A new method for detecting and interpreting biodiversity and ecological community thresholds. Methods in Ecology and Evolution 1(1):25–37. Daniel, W. M., D. M. Infante, R. M. Hughes, Y.-P. Tsang, P. C. Esselman, D. Wieferich, K. Herreman, A. R. Cooper, L. Wang, and W. W. Taylor. 2015. Characterizing coal and mineral mines as a regional source of stress to stream fish assemblages. Ecological Indicators 50:50–61. Dufrêne, M., and P. Legendre. 1997. Species assemblages and indicator species: the need for a flexible asymmetrical approach. Ecological monographs 67(3):345–366. Lyons, J., T. Zorn, J. Stewart, P. Seelbach, K. Wehrly, and L. Wang. 2009. Defining and characterizing coolwater streams and their fish assemblages in Michigan and Wisconsin, USA. North American Journal of Fisheries Management 29(4):1130–1151.
554
Fisheries | Vol. 41 • No. 9 • September 2016
Mora, C., and M. F. Maya. 2006. Effect of the rate of temperature increase of the dynamic method on the heat tolerance of fishes. Journal of Thermal Biology 31:337–341. Poff, N. L., J. D. Allan, M. B. Bain, J. R. Karr, K. L. Prestegaard, B. D. Richter, R. E. Sparks, and J. C. Stromberg. 1997. The natural flow regime: a paradigm for river conservation and restoration. BioScience 47:769–784. R Core Team. 2014. R: a language and environment for statistical computing. R Foundation for Statistical Computing, Vienna, Austria. Available: www.R-project.org. (June 2016). Sievert, N. A., C. P. Paukert, Y.-P. Tsang, and D. Infante. 2016. Development and assessment of an index to determine stream fish vulnerability to climate change and habitat degradation. Ecological Indicators 67:403–416. USEPA (U.S. Environmental Protection Agency). 2006. Wadeable streams assessment: a collaborative survey of the Nation’s streams. Office of Water, U.S. Environmental Protection Agency, Washington, D.C. Wehrly, K. E., M. J. Wiley, and P. W. Seelbach. 2003. Classifying regional variation in thermal regime based on stream fish community patterns. Transactions of the American Fisheries Society 132(1):18–38.