THE JOURNAL OF CHEMICAL PHYSICS 130, 204703 共2009兲
Structural transformations of nitrogen adsorbed on graphite: Monte Carlo studies of spatial heterogeneity in multilayer system M. Golebiowska,1,2 L. Firlej,1,2 B. Kuchta,1,3,a兲 and R. Fabianski4 1
Department of Physics and Astronomy, University of Missouri Columbia, Columbia, Missouri 65211, USA LCVN, Université Montpellier 2, 34095 Montpellier, France 3 Laboratoire Chimie Provence, Université de Provence, 13396 Marseille, France 4 Institut of Physical and Theoretical Chemistry, Technical University of Wroclaw, 50-370 Wroclaw, Poland 2
共Received 3 March 2009; accepted 5 May 2009; published online 26 May 2009兲 We present numerical Monte Carlo studies of nitrogen multilayers adsorbed on the basal plane of graphite. The analysis is focused on the system spatial heterogeneity and its influence on structures and phase transitions. The simulations have been carried out for surface coverage from monolayer to four layers, in canonical ensemble, in the temperature range from 5 to 100 K. An intricate phase situation is observed due to the competition between intermolecular and N2-graphite interactions. The commensurate monolayer is stabilized by the graphite corrugation. The multilayer commensurate structure is only metastable at low temperatures. Its stable structure is triangular, 1.08 times denser than the commensurate one stabilized by the N2 – N2 interactions. The multilayer structure is strongly spatially nonuniform, the individual layer structure changes from herringbone in the first layer to pinwheel arrangement in the fourth one. Two structural phase transitions, orientational order-disorder, and melting, are observed in each layer. Their mechanism and transition temperatures show strong variations depending on the position of the layer and the number of layers in the system. © 2009 American Institute of Physics. 关DOI: 10.1063/1.3142529兴 I. INTRODUCTION
Spatial nonuniformity is an intrinsic property of any nanometric size system. In this paper we will call it simply heterogeneity. There are two principal sources of spatial heterogeneity. First, it is the non-negligible number of atoms 共molecules兲 at the system edges with respect to those from the system interior. The second is an additional component of interaction that appears at the system-environment interface. This aspect is of predominant importance in all threedimensional 共3D兲 confined geometries where the presence of confining walls and the interaction with them makes the materials naturally heterogeneous. A similar situation one also encounters in two-dimensional 共2D兲 layers adsorbed on surfaces or at phase interfaces. The characterization of such systems is essential to improve our understanding of interfacial phenomena 共such as phase equilibria or adsorption兲 but also basic behavior of biological systems where most processes occur at interfaces. In this paper, we approach the problem of heterogeneity by analyzing layers of nitrogen adsorbed on graphite. The advantage of such a choice of a model system is that both 3D bulk phases and 2D monolayers of nitrogen were intensively analyzed numerically and experimentally in the past.1–19 Solid nitrogen has been considered for many years as a model for plastic phases and order-disorder transformations. The phase diagram of nitrogen is strongly dimensionality dependent: Those of bulk 共3D兲 and layered 共2D兲 systems1–19 are very different from each other. It suggests that in multilayer structures 共that constitute an intermediate stage a兲
Electronic mail:
[email protected].
0021-9606/2009/130共20兲/204703/7/$25.00
between 2D adsorbed layer and 3D crystal兲 the phase situation will be even more intricate. Certainly, the multilayer systems adsorbed on surfaces are frustrated because each adsorbed layer experiences different substrate forces. Therefore the multilayer structures can be strongly heterogeneous,1 even stronger than the systems under confinement 共for example, in nanometric slit pores14兲. The experimental phase diagram1,15–18 of nitrogen adsorbed on the basal plane of graphite shows that in nearly all thermodynamic conditions we may expect two 2D phases being in equilibrium and often coexisting with a bulk phase. The interpretation of experimental measurements is therefore difficult. It is also very challenging for the numerical modeling. In this paper, we model, for the first time, the multilayer systems of nitrogen adsorbed on graphite, build up with n = 1 – 4 layers. We analyze the heterogeneity of multilayer and determine how it evolves with temperature and coverage. The simulated situation is then compared to the phase diagram determined in experiment.1
II. POTENTIAL FORMS
The interaction between nitrogen molecules has been modeled using the potential of Marx and Wiechert.16 This potential has two atomic force centers for the overlap and dispersion interactions between molecules. They are located at the atomic positions, ⫾0.547 Å from the molecular center. The Coulomb forces are simulated by four point charges placed along the molecular axis at ⫾0.847 Å 共charges of
130, 204703-1
© 2009 American Institute of Physics
Downloaded 14 Sep 2009 to 162.38.157.1. Redistribution subject to AIP license or copyright; see http://jcp.aip.org/jcp/copyright.jsp
204703-2
J. Chem. Phys. 130, 204703 共2009兲
Golebiowska et al.
FIG. 1. 共Color online兲 共a兲 Hexagonal and 共b兲 cubic 共fcc兲 arrangement of nitrogen over the graphite surface in multilayer structures. The points indicate the position of molecular centers of mass.
0.373e兲 and at ⫾1.044 Å 共−0.373e兲 from the mass center. The analytical form of the interaction between two nitrogen molecules is then 4
U=
兺
i,j=1
2
冋
册
q iq j A + 兺 − 6 + F共exp共rkl兲兲 , rij k,l=1 rkl
共1兲
where rij and rkl are the distances between charges 共i , j兲 and atomic force centers 共k , l兲 on different molecules, respectively. The function F is essentially the exponential dependence of the interatomic distance, modified by a polynomial series in the vicinity of the potential well. The explicit form of the function F, the constant A, and other details about the potential are given elsewhere.20 It is important to remember that this potential comes entirely from ab initio data12 and partially includes many-body effects.13 It has been successfully used to calculate10 many properties of bulk solid and fluid N2 with high accuracy even if it assumes the molecule to be rigid 共the intramolecular degrees of freedom are static and equal to their average value兲. The overlap-dispersion interaction between the carbon and nitrogen atoms is described by a Lennard-Jones 共6–12兲 potential. The potential parameters are those deduced by Steele.21 The Fourier expansion form of the potential is used,22 including the second term of expansion that reflects the periodicity of the substrate-N2 interaction and takes into account the anisotropy of carbon atoms in graphite using the representation of Carlos and Cole.23 This procedure is now standard and will not be described again here. III. SIMULATION DETAILS
We have studied the structures of up to four layers of nitrogen adsorbed on the basal plane of graphite. We have performed Monte Carlo 共MC兲 simulations, in canonical ensemble 共NVT兲, separately for one to four adsorbed layers. The simulation box 共59.03⫻ 42.60 Å2兲 was commensurate with the substrate. Periodic boundary conditions have been used in the x and y directions and a hard wall has been located at z = 20 Å from the substrate. Typical runs contained the minimum number of 106 MC steps 共per molecule兲. The main results are extracted from the previously equilibrated runs. Each monolayer initially contained 160 N2 molecules. The initial configurations have been prepared as orientationally ordered herringbone arrangements. The three 共and four兲 layer systems can be constructed in two ways 共Fig. 1兲: 共i兲 ABA共B兲 hexagonal-like sequence, with the molecules of the third layer placed directly over the molecules of the first
layer, 共ii兲 ABC共A兲 face centered cubic 共fcc兲-like sequence, in which the molecules of the third layer are located over “the vacant” graphite hexagons. Both situations have been studied and compared in Sec. V. In principle, the choice of the initial configuration does not affect the final results because both positions and orientations of molecules are free to vary during the MC simulation. Practically, some metastable states can be observed because of the finite time accessible in numerical procedure.
IV. ORDER PARAMETERS
For the extended characterization of the thermodynamic properties of our systems several order parameters have been used. All of them have been used previously to give a complementary characterization of the in-plane and out-ofplane behavior of 2D systems. The herringbone order parameter, OPherr, is a measure of the in-plane orientational ordering of the molecular axis, OPherr =
1 NM
冓
NM
共− 1兲 jsin共2i兲 兺 i=1
冔
共2兲
.
N M is the number of molecules in the layer, i is an 共azimuthal兲 angle between the axis of the ith molecule and arbitrary chosen direction of the simulation box, j is the number of the sublattice, and the average is taken over a large number of uncorrelated configurations in a MC run. In a perfect herringbone structure, in which the molecules from different sublattices are perpendicular to each other, OPherr is equal 1. With increasing disorder OPherr progressively decreases and reaches the value zero when the sublattices become indistinguishable and no particular orientational order persists in the layer. The commensurate order parameter, OPcomm, monitors the registry of adsorbed molecules with the graphite substrate. It is defined as 1 OPcomm = 6N M
冓
NM 6
兺 exp共− igsri兲 兺 i=1 s=1
冔
.
共3兲
The outer sum runs over all 共N M 兲 molecular center of mass positions and the inner sum—over six graphite reciprocal lattice vectors, gគ sគ . The ri is the position of the center of the ith hexagon in the graphite plane. When all N2 centers of mass coincide with centers of graphite hexagons the OPcomm is equal 1. OPcomm ⬵ 0 for structures incommensurate with graphite. The ⌽6 order parameter measures the average bond order within a plane layer, 1 6 = NM
冓
NM
exp共in␣i兲 兺 i=1
冔
,
共4兲
where n = 6 and ␣i is the angle between vectors connecting ith molecule with two of its closest neighbors. ⌽6 = 1 for solid triangular layer and ⌽6 = 0 when in-plane, liquidlike disorder appears. The tilt order parameter, OPtilt, quantifies the out-ofplane orientation of molecules in the layer,
Downloaded 14 Sep 2009 to 162.38.157.1. Redistribution subject to AIP license or copyright; see http://jcp.aip.org/jcp/copyright.jsp
204703-3
J. Chem. Phys. 130, 204703 共2009兲
Nitrogen layers on graphite
FIG. 2. Order parameters in nitrogen monolayer: 共a兲 OPherr, 共b兲 OPcomm, 共c兲 OPtilt, and 共d兲 ⌽6. OPherr indicates the rotational transition 共Torient = 23⫾ 2 K兲, OPcomm, and ⌽6 indicate melting 共Tmelt = 80⫾ 1 K兲. OPtilt shows a change in the slope after the rotational transition and stabilizes about ⫺0.1 in the liquid phase.
1 OPtilt = 2N M
冓
NM
共3 cos2 i − 1兲 兺 i=1
冔
,
共5兲
where i is an 共tilt兲 angle between the surface normal and the long axis of the ith molecule. OPtilt = −0.5 when all the molecules are parallel to the surface of graphite; OPtilt = 1 when the molecules are perpendicular to the substrate. For a random distribution of molecular axis orientations OPtilt is equal zero. V. RESULTS AND DISCUSSION A. Monolayer
Monolayers of nitrogen adsorbed on graphite have been simulated for decades. Here we review its properties to obtain a reference data set for studying multilayer systems. The results of our simulations, performed on systems much larger than in the past 共larger MC boxes兲 have confirmed previous conclusions.1–7 The monolayer undergoes an orientational order-disorder transition from herringbone to orientationally disordered plastic phase at about 25 K and melts at about 80 K 关Figs. 2共a兲 and 2共b兲兴. The melting is initiated by formation of vacancies in the layer through promotion of molecules to the second layer.13 No hysteresis was observed. The aspect of both phase transitions that were not thoroughly discussed in previous work, but emphasized in the present study, is the variation of the tilt angle at the transitions 关Figs. 2共c兲 and 3兲. OPtilt is particularly useful when analyzing structural heterogeneity of systems built up with rodlike, rigid molecules: We will follow its variation in all multilayer systems studied in this paper. In the monolayer, the molecules in the low-temperature herringbone phase are confined to the plane parallel to graphite 关OPtilt ⬃ −0.5, Fig. 2共c兲兴. The rotational transition initiates molecules’ out-ofplane tilting. The tendency to tilt out of substrate increases with temperature up to melting. Above the melting transition OPtilt do not vanish but stabilizes at small negative value. It
FIG. 3. 共Color online兲 Distribution of the centers of mass of molecules in a monolayer at T = 75 K, in the direction perpendicular to the graphite. The insets show the cos共tilt兲 distributions 共from ⫺1 to 1兲 calculated within different slices of the layer 共clockwise, starting from the lower left兲: z ⬍ 3.25, 3.4⬍ z ⬍ 3.5, 3.5⬍ z ⬍ 3.6, 3.6⬍ z ⬍ 3.7, and z ⬎ 3.8. Qualitatively, this picture represents properties of contact layers in all multilayer configurations studied in this work.
indicates that even in the liquid phase molecular rotations are not totally isotropic as a consequence of strong anisotropic interaction with the graphite surface. By definition, OPtilt shows only the average molecular orientation at a given temperature, and it does not characterize microscopically the layer internal structure that can be in reality strongly heterogeneous in the direction perpendicular to the surface 共z direction兲. Figure 3 shows the distributions of cos共tilt兲, calculated at different height z with respect to graphite, at temperature close to melting 共T = 75 K兲. The further the molecule is from graphite, the more perpendicular is its orientation with respect to the surface. Clearly, the molecules’ dynamics must be strongly affected by the translational-rotational coupling. As a consequence, fluctuations of the molecules’ z coordinate within the layer are associated with changes in molecular orientations, as illustrated by the variations of the orientational distributions 共see the insets on Fig. 3兲. As we will show in Sec. V B, this coupling has an unexpected influence on the mechanism of melting in multilayer systems. B. Bilayer
The initial low-temperature configuration of a bilayer consists of two herringbone-type layers anchored over the neighboring centers of graphite hexagons 关Fig. 1共a兲兴. Both layers lose their orientational order with increasing temperature. This transformation occurs at ⬃27⫾ 1 K in the top layer and at slightly higher temperature 共⬃28⫾ 1 K兲 in the contact layer 关Fig. 4共a兲兴. At the same time, the translational order does not show any sign of relaxation. This observation confirms the conclusion obtained from molecular dynamics simulations19 that at low temperatures it is not really possible to obtain “translational” equilibrium within accessible simulation times. Therefore, the results presented in the Fig. 4 correspond to a metastable situation of a bilayer system. The situation changes totally at higher temperatures. Some precursor indications of bilayer relaxation appear already below 70 K. The molecules within each layer lose simultaneously the commensurability with graphite 关Figs. 4共b兲 and 4共d兲兴. At the same time, in both layers the out-of-
Downloaded 14 Sep 2009 to 162.38.157.1. Redistribution subject to AIP license or copyright; see http://jcp.aip.org/jcp/copyright.jsp
204703-4
J. Chem. Phys. 130, 204703 共2009兲
Golebiowska et al.
FIG. 6. 共Color online兲 In-layer radial distribution functions at 75 K for monolayer and for the first and second layers of the bilayer system.
FIG. 4. 共Color online兲 Order parameters in nitrogen bilayer: 共a兲 OPherr, 共b兲 ⌽6, 共c兲 OPtilt, and 共d兲 OPcomm. Contact layer: closed black symbols; top layer: open red symbols.
plane translational motion appears. Some of molecules evaporate from the surface already at 70 K 关Fig. 5共a兲兴. The others migrate between layers and, on average, the density of the contact layer increases 关Fig. 5共b兲兴. Consequently, the temperatures of melting of both layers decrease 共with respect to monolayer兲 and are separated by ⬃10 K due to the bilayer heterogeneity. This behavior is very peculiar: In fact, the presence of the second layer changes dramatically the mechanism of melting of the first one. In the monolayer, the rotationally disordered solid phase is stable until the thermal energy allows the system to form vacancies by promotion of molecules to the second layer. In the bilayer, the structural heterogeneity of the contact layer 共as shown in Fig. 3兲 facilitates the diffusion of molecules from the top layer into the first one. This disturbs the perfect triangular pattern of the contact layer. The molecules rearrange into somewhat frustrated structure that is denser and less stable than the monolayer. In consequence, the contact layer in the bilayer melts at lower temperature than the monolayer itself and the melting is smeared out over a wider range of temperatures. This effect is apparently counterintuitive: One would expect the temperature of melting in the layer confined between the graphite surface and the next layer of adsorbed molecules to be higher than in monolayer configuration. In fact, in finite
systems the temperatures of phase transitions at the system edges are always lower than in the bulk because there are fewer nearest neighbors and the cohesion forces are always weaker there. The same applies to the systems of layers adsorbed on a surface. We observe that in the bilayer of nitrogen adsorbed on graphite, both rotational and melting transformations occur at lower temperature in the top, than in the contact layer. At the same time, there is an increase in the orientational temperature of the contact layer with respect to monolayer, as a consequence of interplay between cohesion and adhesion forces in the bilayer. Figure 6 compares the radial distribution functions in the monolayer and the bilayer at a temperature close to the melting 共T = 75 K兲, when the migration of molecules between layers has already started. The densification of the contact layer and the decrease of density of the second layer in bilayer with respect to monolayer are clearly visible. This effect is due to a strong coupling between translational and rotational motion of molecules. The comparison with the experimental data1 leads to interesting observations. The experimental phase diagram shows that at surface coverage n = 2 the fully compressed solid triangular incommensurate 共TI兲 layer 共n = 1.11兲 coexists with amorphous 共or highly disordered兲 partial second layer. The second layer crystallizes only when the coverage increases to n = 3; then the two layers are commensurate with each other and remain in equilibrium with an amorphous partial third layer. The calculated evolution of the number of molecules in layers constituting bilayer 关Fig. 5共b兲兴 shows the same tendency, at nominal coverage n = 2, to form denser first layer and disordered partial second layer. C. Multilayer systems
FIG. 5. 共Color online兲 Migration of molecules between layers of a bilayer structure at 70 K: 共a兲 Evolution of molecular centers of mass positions with respect to the surface during a 共stabilized兲 MC run. 共b兲 Number of molecules as a function of temperature: first layer 共closed black circles兲, second layer 共open red squares兲, and number of molecules promoted to the third layer 共closed green triangles兲.
The structural nonuniformity increases when the subsequent layers 共third and fourth兲 are added to the system. It can be deduced from several system characteristics: Some of them are summarized in Tables I and II. As an example, Fig. 7 shows the temperature dependence of the order parameters OPherr, OPtilt, and ⌽6 calculated separately for each layer, and the number of molecules in each layer, for cubic ABCA fourlayer system. It is interesting to note that the density of the contact layer always increases before the layer melts, whereas in all
Downloaded 14 Sep 2009 to 162.38.157.1. Redistribution subject to AIP license or copyright; see http://jcp.aip.org/jcp/copyright.jsp
204703-5
J. Chem. Phys. 130, 204703 共2009兲
Nitrogen layers on graphite
TABLE I. Transition temperatures in mono- and multilayer systems of nitrogen adsorbed on graphite: 共a兲 rotational order-disorder transition and 共b兲 melting. We point out that the effect of different stacking, fcc 共ABC , ABCA兲 and hcp 共ABA , ABAB兲 is larger on melting than on order-disorder transition. A
AB
ABA
ABC
ABAB
ABCA
First layer Second layer Third layer Fourth layer
23
28 27
共a兲 33 32 24
33 33 30
34 33 26 24
38 37 36 29
First layer Second layer Third layer Fourth layer
80
74 67
共b兲 87 75 60
82 76 58
90 79 70 57
82 76 65 58
other layers vacancies must be created to allow melting to occur. This is a direct consequence of the attraction forces originating from the substrate that bond the first layer molecules stronger than the ones in the higher layers. This apparently stabilizing effect has a counterpart that ultimately destabilizes the solid state of the contact layer. In fact, the intermolecular binding energy of the denser 共incommensurate兲 layer is weaker than that of commensurate monolayer due to the increase of repulsive component of interaction. Globally, in multilayer systems the contact layer gains more energy due to the larger contribution from interaction with graphite rather than it loses due to repulsion appearing in higher density configuration. Therefore, the melting temperature is always higher for the contact layer than for those farther from graphite 关see Table I 共b兲兴. It also increases with the number of the adsorbed layers as each additional layer introduces new components of interactions which stabilize lower layers.
FIG. 7. 共Color online兲 Heterogeneity in multilayer system: four-layer cubic 共ABCA兲 structure. Temperature dependence of 共a兲 rotational transition 共characterized by OPherr兲, 共b兲 melting 共characterized by ⌽6兲, 共c兲 tilt angle parameter 共OPtilt兲, and 共d兲 number of molecules in each layer. Contact layer dependences are presented by closed black circles, second layer: open red squares, third layer: closed green triangles, and fourth layer: open blue triangles. Black open symbols in 共d兲 give the number molecules promoted to the fifth layer.
Within the four-layer structure the temperature of melting varies by more than 20 K 共from the first to the fourth layer兲. The character of melting changes as well: The transition progressively becomes broader 共occurring in a larger range of temperature兲. This feature is intrinsic but, to some extent, it can also be influenced by the rounding effects. For example, the melting in the contact layer 关Fig. 7共b兲兴 starts at 65–70 K but the transformation is not completed even at 100 K. At the same time, the character of melting varies from layer to layer; it becomes not only more abrupt, going toward the top layer, but also it happens at lower temperature. Certainly, the diffuse character of any phase transition renders ultimately impossible any nonambivalent determination of the transition temperature. This problem regularly appears when studying melting in pores of nanometric size:24 In such situations the definition of transition depends on the microscopic mechanism of melting. The temperature of rotational transition is less sensitive to the coverage and varies less from layer-to-layer than the melting temperature 关Table I 共a兲兴. Only the top layers undergo the transition at different 共lower兲 temperatures than other layers. In fact, the rotational transition is mainly determined by lateral, in-plane forces, and only weakly affected by the distance from the substrate. By increasing the coverage, one should be able to approach ultimately the limit of 3D behavior of the adsorbed system. This tendency is clearly emerging from our calculations: Both rotational and melting temperatures evolve toward the values characteristic for the bulk system. The increase in the out-of-plane tilting of molecules also demonstrates that the 3D structure starts to emerge. The lowtemperature structure of multilayer system 共n ⱖ 4兲 should be the cubic ␣ phase; and at higher temperature, the hexagonal  phase should be more stable. This conclusion can be already drawn if one compares the energies of cubic and hexagonal structures of three- and four-layer systems 共Table II兲. At low-temperature cubic arrangement of the layers is more stable than the hexagonal one. After rotational transition, the differences between internal energies of both arrangements become not significant. It is known, that the entropy effect plays a crucial role in the stabilization of the  phase;4 this contribution has not been evaluated in this paper.
Downloaded 14 Sep 2009 to 162.38.157.1. Redistribution subject to AIP license or copyright; see http://jcp.aip.org/jcp/copyright.jsp
204703-6
J. Chem. Phys. 130, 204703 共2009兲
Golebiowska et al.
FIG. 8. 共Color online兲 共a兲 ⌽6 order parameter and 共b兲 the number of molecules in the layers as a function of temperature in the runs with decreasing temperature for the nominal coverage n = 4. The symbol convention is the same as in Fig. 7.
The comparison with the experimental data1 leads to several conclusions. In experimental conditions, at the coverage n = 4 the actual state of the multilayer may consist of several coexisting phases, and its composition depends on system’s temperature: 共i兲 T ⬍ 23 K: two ordered solid layers coexisting with a fraction of an amorphous state, 共ii兲 23 K ⬍ T ⬍ 30 K: one ordered solid layer coexisting with three fluid layers and bulk cubic ␣-phase, 共iii兲 30 K ⬍ T ⬍ 34 K: one disordered solid layer coexisting with three fluid layers and bulk cubic ␣-phase, and 共iv兲 34 K ⬍ T ⬍ 37 K: one disordered solid layer coexisting with three fluid layers and bulk hexagonal -phase. Certainly, canonical MC simulations cannot reproduce such experimental conditions and the direct comparison of simulation results with the experiment is extremely difficult. However, the evolution of the number of molecules in the layers seems to be consistent with the experimental situation 共variable sample density兲, within the constraints defined by canonical ensemble 共fixed density in the constant volume兲. D. Toward multiphase equilibrium
The conclusion emerging from the results presented in Sec. V C is the following. The equilibrium of nitrogen multilayer on graphite is largely determined by rich structural heterogeneity associated with all degrees of freedom: translational 共between the layers兲 and orientational 共between and within layers兲. To explore more deeply this property, we have simulated the system starting from liquid phase 共T = 100 K兲 and decreasing temperature to T = 5 K. Figure 8 shows the evolution of ⌽6 order parameter and of the number of molecules in each layer when the initial liquid phase is cooled down. No hysteresis between melting and freezing was observed 关see Figs. 7共b兲 and 8共a兲, the differences for the fourth layer are due to the smaller number of molecules in the layer after the translational relaxation of the TABLE II. The average energy 共in K兲 of four-layer 共4L兲 and three-layer 共3L兲 systems at different temperatures. Temperature 共K兲
4L-cubic
4L-hexagonal
3L-cubic
3L-hexagonal
5 45 65 80
⫺1203.9 ⫺1074.4 ⫺959.5 ⫺898.7
⫺1197.6 ⫺1057.6 ⫺957.4 ⫺900.4
⫺1144.6 ⫺994.3 ⫺895.7 ⫺836.8
⫺1136.2 ⫺994.2 ⫺897.6 ⫺834.4
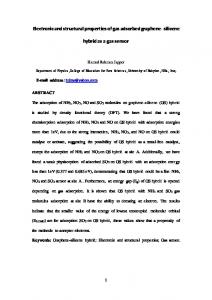
FIG. 9. 共Color online兲 Instantaneous configurations of four-layer system at 10 K. The first layer 共a兲 is a herringbone. Starting from the second layer 共b兲 there are pinwheel configurations. The pinwheel configurations in layers 3共c兲 and 4共d兲 form the bulk cubic ␣-phase.
system兴: It means that the mechanisms of both transition remains the same. However, with decreasing temperature the system spontaneously solidifies into a denser layered solid. Below the freezing temperature each layer shows triangular translational order, incommensurate with graphite, and of density ⬃1.08 共with respect to the commensurate monolayer兲. Despite higher density of layers 1–3, the temperatures of freezing remain the same as the temperatures of melting of slightly less dense structures 关as reported in the Table I 共b兲兴. The top layer melts at slightly lower temperature and less abruptly, mostly because it has become incomplete 关see Fig. 8共b兲兴. However, below freezing the system shows very strong orientational heterogeneity. Figure 9 presents instantaneous configurations of the molecules, separately for each of four formed layers. Their analysis turns out to be very instructive. The first layer stays within in-plane orientations. Staring from the second layer 共and very clearly in the third and fourth layers兲, a strong orientational heterogeneity appears. One part of the system orders in herringbone arrangement; the other forms a pinwheel-like structure. It is amazing that such structural heterogeneity can be observed even within relatively limited size of our simulation box. Moreover, the changes in in-layer structure are accompanied by changes in layering sequence: hexagonal ABA for the first three layers but cubic ABC for layers 2–4. Therefore, the overall sequence of the system is now ABAC 共versus initial ABCA兲. In fact, the observed pinwheel arrangement 共characteristic for cubic ␣-phase兲 of molecules is a signature that the 3D cubic solid nitrogen phase starts to crystallize in the system. This result is consistent with the experimental observations where for equivalent n = 4 coverage the cubic ␣-phase has been detected together with herringbone-type contact layer.1 It may also explain why the experimental diffraction pattern can be fitted reasonably assuming a coexistence of several structures: herringbone, pinwheel, and amorphous or liquidlike. VI. CONCLUSIONS
The multilayers of nitrogen adsorbed on graphite are strongly heterogeneous systems. This heterogeneity is re-
Downloaded 14 Sep 2009 to 162.38.157.1. Redistribution subject to AIP license or copyright; see http://jcp.aip.org/jcp/copyright.jsp
204703-7
J. Chem. Phys. 130, 204703 共2009兲
Nitrogen layers on graphite
sponsible for a translational-rotational coupling which strongly affects the mechanism of phase transformations. The effects reported in this paper may be totally missed if a molecular fluid is simulated using the isotropic, superatom model where the orientational degrees of freedom are suppressed. Such approximation has been very often used when modeling the adsorption in porous materials because it allowed simulation of large systems with a reasonable expense of simulation time. Our results suggest that at least some test of this approximation should be always performed if the thermodynamic conditions close to phase transformations are being simulated. The variation of the transition temperatures 共orientational and melting兲 observed in simulations is the most evident symptom of the strong heterogeneity in the simulated multilayer systems. At the same time, the experimental phase diagram shows totally different tendency; the temperature of the transitions remains constant when the coverage changes. This experimental observation is rather counterintuitive because the variable environment existing in each layer should naturally affect the transition temperatures. There are few possible explanations for that. First of all, our simulations have been carried out in canonical ensemble starting from the low-temperature configuration and increasing temperature. Our results are consistent with such thermodynamic conditions. Although the initial low-temperature solids appeared to be very stable in the simulations, an important migration of molecules between the layers has been observed at high temperature. Starting from the coverage n = 2 共bilayer system兲 the first layers systematically tend to densify 共to the coverage n ⬃ 1.08, higher than the commensurate arrangement兲, whereas the higher layers always evolve to lower density structures. Such behavior is consistent with the experimental determination of density n = 1.11 with respect to the registered one.1 Therefore we conclude that the simulated low-temperature structure has been stabilized in a metastable state. At low temperature, the kinetics of this metastable structure is extremely slow and prevents the system’s relaxation into a denser phase in a reasonable simulation time. To get more insight in the metastability aspect of the simulated situation and better understanding of the experimental phase diagram, we performed simulations where temperature was being lowered, starting from liquidlike disordered configurations. We observed that layers formed on freezing had higher than commensurate density. Certainly, it
was only possible if more than one layer of molecules was adsorbed: A monolayer stabilized by the strong graphite interaction has always the commensurate structure which seems to be the most stable one. However, in the multilayer systems the intermolecular interactions overcome the influence of graphite corrugation. The final structure results from the competition between the interaction with graphite 共which tries to stabilize the herringbone structure兲 and the 3D intermolecular forces 共which favor cubic ␣-phase兲. For this reason the pinwheel-like arrangement is observed in higher layers, as a part of molecular order in the 具111典 crystallographic planes of cubic structure. The same competition must be responsible for multistructure arrangements observed in the experiments.1,15–18 We plan to carry out a larger scale simulation to perform a more deep analysis of multiphase equilibrium in the multilayer nitrogen system. ACKNOWLEDGMENTS
The authors acknowledge fruitful discussions with H. Taub and C. Wexler. 1
S.-K. Wang, J. C. Newton, R. Wang, H. Taub, J. R. Dennison, and H. Shechter, Phys. Rev. B 39, 10331 共1989兲. 2 G. Pangilinan, G. Guelachvili, R. Sooryakumar, K. Narahari Rao, and R. H. Tipping, Phys. Rev. B 39, 2522 共1989兲. 3 B. Quentrec, Phys. Rev. A 12, 282 共1975兲. 4 B. Kuchta and R. D. Etters, J. Chem. Phys. 102, 3349 共1995兲. 5 O. G. Mouritsen and A. J. Berlinsky, Phys. Rev. Lett. 48, 181 共1982兲. 6 J. Talbot, D. J. Tildesley, and W. A. Steele, Mol. Phys. 51, 1331 共1984兲. 7 J. Talbot, D. J. Tildesley, and W. A. Steele, Surf. Sci. 169, 71 共1986兲. 8 R. M. Lynden-Bell, J. Talbot, D. J. Tildesley, and W. A. Steele, Mol. Phys. 54, 183 共1985兲. 9 C. Peters and M. L. Klein, Mol. Phys. 54, 895 共1985兲. 10 B. Kuchta and R. D. Etters, Phys. Rev. B 36, 3400 共1987兲. 11 B. Kuchta and R. D. Etters, Phys. Rev. B 36, 3407 共1987兲. 12 B. Kuchta and R. D. Etters, J. Chem. Phys. 88, 2793 共1988兲. 13 B. Kuchta and R. D. Etters, Phys. Rev. B 54, 12057 共1996兲. 14 J. Kamakshi and K. G. Ayappa, Langmuir 17, 5245 共2001兲. 15 R. Wang, S.-K. Wang, H. Taub, J. C. Newton, and H. Shechter, Phys. Rev. B 35, 5841 共1987兲. 16 D. Marx and H. Wiechert, Adv. Chem. Phys. 95, 213 共1996兲. 17 U. G. Volkmann and K. Knorr, Phys. Rev. Lett. 66, 473 共1991兲. 18 T. E. Burns, J. R. Dennison, and S. N. Erhlich, Langmuir 15, 1423 共1999兲. 19 V. R. Bhethanabotla and W. A. Steele, J. Chem. Phys. 91, 4346 共1989兲. 20 R. D. Etters, V. Chandrasekharan, E. Uzan, and K. Kobashi, Phys. Rev. B 33, 8615 共1986兲. 21 W. A. Steele, J. Phys. 共Paris兲, Colloq. 38, C4 共1978兲. 22 W. A. Steele, Surf. Sci. 36, 317 共1973兲. 23 W. Carlos and M. Cole, Surf. Sci. 91, 339 共1980兲. 24 B. Kuchta, R. Denoyel, and L. Firlej, Colloids Surf., A 241, 143 共2004兲.
Downloaded 14 Sep 2009 to 162.38.157.1. Redistribution subject to AIP license or copyright; see http://jcp.aip.org/jcp/copyright.jsp